Relative oral bioavailability of lead from
Dutch made grounds
Report 711701086/2009
RIVM Report 711701086/2009
Relative oral bioavailability of lead from Dutch made
grounds
W.I. Hagens1 N. Walraven2 M. Minekus3 R. Havenaar3 J.P.A. Lijzen4 A.G. Oomen1 1: RIVM, Centre for Substances and Integrated Risk Assessment (SIR), Bilthoven
2
: Geoconnect, Castricum
3
: TNO-quality of life, Zeist
4
: RIVM, Laboratory for Ecological Risk Assessment (LER), Bilthoven
Contact:
RIVM/SIR Werner.Hagens@rivm.nl Agnes.Oomen@rivm.nl
This investigation has been performed by order and for the account of the Ministery of Housing, Spatial Planning and the Environment (VROM), DGM-DP and DGR-LOK, within the framework of project M/711701/BE, Risico’s in relatie tot bodemkwaliteit/Implementatie biobeschikbaarheid mens.
RIVM Report 711701086 2
© RIVM 2009
Parts of this publication may be reproduced, provided acknowledgement is given to the 'National Institute for Public Health and the Environment', along with the title and year of publication.
Abstract
Relative oral bioavailability of lead from Dutch made grounds
Several laboratory models exist for assessing the amount of lead that is released from soil and available for absorption by the gastrointestinal tract of children. Both the static in vitro digestion model (IVD) of the National Institute for Public Health and Environment (RIVM) and the dynamic Tiny-Tim model of the Netherlands Organisation for Applied Scientific Research (TNO) mimic the physiological conditions of the gastrointestinal tract of a child. However, the IVD model estimates a higher risk than the Tiny-Tim model. Exposure to too high levels of lead poses a particular health risk to children, one of which is a negative impact on IQ development.
The soil in the historical inner (city) areas of many Dutch cities and villages is often polluted with lead. This lead originates from several sources, including the accumulation of lead-containing waste products and building rubble associated with centuries of urban development and industrial activities. This has resulted in a rubble layer that is referred to as made ground.
Made grounds from different sources appear to have rather uniform soil characteristics, despite differences in the original soil lithology (clay, sand, loess). Possibly because of this uniformity, no relation has been observed between the release of lead from made grounds and soil characteristics. Results obtained using the IVD model, however, do indicate a qualitative relation between lead mineralogy and the release of lead from made grounds.
The results of prior comparisons of the IVD and Tiny-TIM models using human and animal data are in close agreement. To obtain a definitive answer on the usability of these models in risk assessment, however, the RIVM recommends that additional validation tests be run using relevant human or animal data.
This report offers policy-makers useful information on how to deal with lead bioavailability in the soil which allows a more precise risk assessment.
Key words:
RIVM Report 711701086 4
Rapport in het kort
Relatieve orale biobeschikbaarheid van lood uit Nederlandse stedelijke ophooglagen
Er bestaan meerdere laboratoriummodellen die schatten hoeveel lood uit de bodem vrijkomt en bij kinderen in het maagdarmkanaal vrijkomt. Het model van het Rijksinstituut voor Volksgezondheid en Milieu (RIVM) schat het risico echter hoger in dan het model van de Nederlandse Organisatie voor Toegepast Natuurwetenschappelijk Onderzoek (TNO). Beide modellen, het Tiny-TIM-model van TNO en het in-vitrodigestie(IVD)model van het RIVM, bootsen in laboratoria de condities van het menselijke maagdarmkanaal na. Vooral kinderen zijn gevoelig voor de toxische effecten van lood. Een te hoge concentratie kan het IQ verminderen. De bodem van Nederlandse oude binnensteden is vaak verontreinigd met lood. Dat komt doordat veel Nederlandse dorpen en steden eeuwenlang zijn bewoond en de bewoners al heel lang lood in allerlei producten gebruiken. Deze bodem wordt de stedelijke ophooglaag genoemd.
Er is geen relatie gevonden tussen bodemeigenschappen van de stedelijke ophooglagen en de mate waarin lood vrijkomt. Dat komt waarschijnlijk doordat de stedelijke ophooglaag vrij uniforme bodemeigenschappen heeft, ondanks de verschillen in de oorspronkelijke ondergrond (zand, klei, löss). Met het IVD-model is wel een verband gevonden tussen de chemische vorm van lood en de geschatte mate waarin het in het lichaam wordt opgenomen.
Eerdere vergelijkingen tussen de modellen met gegevens van mensen of dieren kwamen wel overeen. Om uitsluitsel te krijgen over de bruikbaarheid van de modellen adviseert het RIVM om enkele testen in mens of dier uit te voeren, en deze resultaten te vergelijken met de resultaten van de modellen. Het rapport doet enkele handreikingen voor de manier waarop beleidsmakers kunnen omgaan met biobeschikbaarheid van lood in de bodem voor een humane risicobeoordeling.
Trefwoorden:
Acknowledgements
The sixteen cities that provided relevant soil information are acknowledged for their cooperation. The members of the NOBOWA-lood discussion groups are acknowledged for their relevant recommendations. Menno Duits, Peter Kootstra and Saskia Sterk (RIVM) are thanked for the experimental work with the in vitro digestion model. Gerard Boom (RIVM) is acknowledged for the metal analysis in the digestive juices, pellets and soils. Jan van de Kassteele (RIVM) is thanked for his statistical input throughout this project. The members of the BARGE (BioAccessibility Research Group Europe) are thanked for their help and suggestions throughout this project.
Anton Roeloffzen (DCMR) is thanked for his support during the start of this project. Piet Otte and Martine Bakker (RIVM) are acknowledged for reviewing this report and for their help, input and support during the whole project.
RIVM Report 711701086 6
Contents
SUMMARY ... 11
1 INTRODUCTION ... 13
1.1 BIOAVAILABILITY... 14
1.2 THE RELATIVE BIOAVAILABILITY FACTOR... 14
1.3 CURRENT USE OF BIOAVAILABILITY IN RISK ASSESSMENT... 15
1.4 AIM OF THE RESEARCH... 16
1.5 APPROACH... 17
2 SITE SELECTION, SAMPLING, PREPARATION OF SOILS ... 19
2.1 SITE SELECTION... 19 2.2 SOIL SAMPLING... 20 2.3 SOIL PREPARATION... 20 2.3.1 The 2 kg part ... 21 2.3.2 The 0.5 kg part ... 21 2.4 DISCUSSION... 22 2.5 CONCLUSIONS... 22 3 SOIL CHARACTERISATION ... 23 3.1 INTRODUCTION... 23 3.2 METHODS... 23 3.3 RESULTS... 24 3.4 DISCUSSION... 24 3.5 CONCLUSIONS... 27 4 LEAD CHARACTERISATION... 29 4.1 INTRODUCTION... 29
4.2 TOTAL LEAD DETECTION... 29
4.2.1 Introduction ... 29
4.2.2 Methods... 29
4.2.3 Results... 30
4.2.4 Discussion... 31
4.3 MULTI-ELEMENT ANALYSIS... 35
4.3.1 Introduction ... 35
4.3.2 Methods... 35
4.3.3 Results... 36
4.3.4 Discussion... 38
4.4 LEAD ISOTOPE ANALYSIS... 39
4.4.1 Introduction ... 39
4.4.2 Methods... 39
4.4.3 Results... 40
4.4.4 Discussion... 40
4.5 MINERALOGY AND PARTICLE SIZE... 43
4.5.1 Methods... 43
4.5.2 Results... 43
RIVM Report 711701086 8
4.6 CONCLUSIONS... 49
5 BIOACCESSIBILITY EXPERIMENTS: IVD MODEL... 51
5.1 INTRODUCTION... 51
5.1.1 Bioaccessibility ... 51
5.1.2 Relative oral bioavailability... 51
5.1.3 Physiological conditions ... 51
5.1.4 Application of relative oral bioavailability in risk assessment ... 52
5.1.5 Validation of the IVD model ... 53
5.2 METHODS... 55 5.2.1 Fasted conditions ... 55 5.2.2 Fed conditions... 55 5.2.3 Lead analysis ... 56 5.3 RESULTS... 56 5.4 CONCLUSIONS... 57
6 CORRELATING SOIL CHARACTERISTICS WITH RELATIVE BIOAVAILABILITY59 6.1 INTRODUCTION... 59
6.2 STATISTICAL METHODS... 59
6.2.1 Single regression analysis... 59
6.2.2 Multiple regression analysis ... 59
6.2.3 Statistical software... 60
6.3 RESULTS... 60
6.3.1 Single regression analysis... 60
6.3.2 Multiple regression analysis ... 62
6.4 DISCUSSION... 63
6.5 CONCLUSIONS... 64
7 CORRELATING LEAD CHARACTERISTICS WITH RELATIVE BIOAVAILABILITY.. ... 65 7.1 INTRODUCTION... 65 7.2 METHODS... 66 7.3 RESULTS... 67 7.4 DISCUSSION... 69 7.5 CONCLUSION... 72
8 BIOACCESSIBILITY EXPERIMENTS: TINY-TIM MODEL ... 75
8.1 INTRODUCTION... 75
8.1.1 Dynamic gastrointestinal conditions ... 75
8.1.2 Simulation of gastrointestinal conditions in Tiny-TIM ... 75
8.2 METHODS... 77
8.2.1 Test products... 77
8.2.2 Test variations... 78
8.2.3 Experimental conditions ... 79
8.2.4 Sampling and analysis ... 80
8.2.5 Calculation of the bioaccessibility of lead ... 80
8.3 RESULTS AND DISCUSSION... 80
8.3.1 Bioaccessibility of lead from lead acetate ... 80
8.3.2 Bioaccessibility of lead from soils ... 82
9 BIOACCESSIBILITY EXPERIMENTS: IVD AND TINY-TIM METHODS... 85
9.1 INTRODUCTION... 85
9.2 METHODS... 85
9.3 RESULTS... 86
9.4 DISCUSSION... 88
9.4.1 Separation method: centrifugation versus ultrafiltration ... 88
9.4.2 Calculation of the relative bioavailability ... 90
9.4.3 Physiological conditions ... 91
9.4.4 Dynamic versus static ... 92
9.4.5 The amount of soil introduced per digestion experiment ... 93
9.4.6 Bioaccessibility of lead from food and water... 93
9.4.7 Additional information on the bioaccessibility and bioavailability of lead from soil, food and water... 94
9.5 CONCLUSION... 95
9.6 RECOMMENDATIONS... 96
10 DISCUSSION ... 99
10.1 LEAD CONTAMINATION... 99
10.2 MODELS TO ASSESS THE BIOAVAILABILITY OF LEAD IN RISK ASSESSMENT... 100
10.2.1 In vivo models ... 100
10.2.2 In vitro models ... 100
10.2.3 Generic models ... 101
10.3 THE MADE GROUNDS... 101
10.4 LEAD CHARACTERISTICS OF THE SOIL... 101
10.5 THE RELATIVE ORAL BIOAVAILABILITY OF LEAD FROM SOIL... 102
10.6 CORRELATING SOIL AND LEAD CHARACTERISTICS TO ORAL RELATIVE BIOAVAILABILITY.... 105
10.6.1 Correlating soil characteristics to relative oral bioavailability ... 105
10.6.2 Correlating lead characteristics to relative oral bioavailability ... 105
10.7 COMPARISON OF TINY-TIM AND IVD RESULTS... 105
11 CONCLUSIONS AND RECOMMENDATIONS... 109
11.1 THE MADE GROUND... 109
11.2 VARIATION IN TOTAL LEAD MEASUREMENT... 109
11.3 THE SOILS ARE HETEROGENIC IN LEAD... 110
11.4 CORRELATING SOIL AND LEAD CHARACTERISTICS TO ORAL RELATIVE BIOAVAILABILITY.... 110
11.5 THE DIFFERENCES IN RELATIVE ORAL BIOAVAILABILITY (IVD AND TINY-TIM)... 110
12 INTERNATIONAL: USE OF BIOAVAILABILITY OF LEAD FROM SOIL IN RISK ASSESSMENT ... 113
12.1 USA... 113
12.1.1 Comparison of IVD and RBLP bioaccessibility values... 113
12.2 DENMARK... 114
12.3 UK... 114
12.4 CANADA... 115
12.5 BARGE ... 115
12.6 INTERNATIONAL ORGANISATION FOR STANDARDIZATION... 115
RIVM Report 711701086 10 APPENDIX 1... 127 APPENDIX 2... 129 APPENDIX 3... 131 APPENDIX 4 ... 134 APPENDIX 5... 135 APPENDIX 6 ... 136 APPENDIX 7 (available on the RIVM website; www.rivm.nl) APPENDIX 8 (available on the RIVM website; www.rivm.nl)
Summary
Many sites in the Netherlands are contaminated with lead. This lead may form a potential health risk. Especially young children are at risk since children ingest larger quantities of soil than adults because of hand-to-mouth behaviour. Moreover, it is known that children are susceptible to lead. By using knowledge on the bioavailability of lead to the human body, the human risk assessment of contaminated soil can be made more realistic. Insight into the bioavailability can be obtained from models that simulate the human digestion process (in vitro digestion models). These physiologically based in vitro models estimate the fraction of lead that can be released from the soil after ingestion (bioaccessible fraction). Bioaccessibility is a sub-process of bioavailability, which refers to the fraction of a substance that reaches the systemic circulation. The bioaccessible fraction can be translated into a relative oral bioavailability factor, which represents the bioavailability of lead from soil relative to the bioavailability as assumed in the toxicological reference value for lead. The relative bioavailability factor can directly be applied in human health risk assessment of contaminated soils.
The aim of the present research was to improve human health risk assessment for made grounds (in Dutch: stedelijke ophooglaag) by deriving one or more correction factor(s) for the relative bioavailability of lead from these soils so that information on the bioavailability of lead from soil can be estimated with information on soil and/or lead characteristics. Made ground is defined as the man-made soil layer that is applied on the original soil lithology. This specific rubble containing layer is laid down to prepare the soil for city use (consolidate, raise or fill the original soil).
In order to cover the most relevant areas in the Netherlands, ninety made grounds were collected in this project. Soils were selected on soil lithology (dune sands, loess, fluviatile sand/clay, aeolian sand and marine sand/clay) and type of lead contamination. Of these made grounds from in total sixteen different Dutch cities, specific lead and soil characteristics were determined. The bioaccessibility of lead from the soils was determined by the in vitro digestion (IVD) model of the National Institute for Public Health and the Environment (RIVM). Out of the total ninety samples, sixteen representative soils were selected for additional bioaccessibility experiments with the Tiny-Tim model of the Netherlands Organisation for Applied Scientific Research (TNO).
The made grounds appear to have rather uniform soil characteristics, despite the differences in original subsoil. Possibly because of this uniformity, no relation has been observed between the release of lead from made grounds and soil characteristics. Results obtained using the IVD model, however, do indicate a qualitative relation between lead mineralogy and the bioavailability of lead from made grounds.
The relative oral bioavailability factor of lead from made grounds as estimated by IVD can be characterised as high, whereas this factor estimated by Tiny-TIM can be characterised as low. When applied in risk assessment, these different results could lead to different decisions
RIVM Report 711701086 12
concerning remediation and/or risk based soil management measures. Both models have, as far as possible, been compared to bioavailability data from animal and human studies, e.g. in vivo data. The similarity with in vivo data appeared to be good for most cases. Nevertheless, both models show some unexpected findings, i.e. in some cases a higher bioaccessible for lead from soil was observed than lead from water for the IVD model, while the Tiny-TIM model resulted in low bioaccessibility values for lead from food spiked with lead. Yet, correlations between in vitro and in vivo data (IVD) or a direct comparison between bioaccessibility and bioavailability of specific soils (IVD and Tiny-TIM) were in general satisfactory. Hence, based on the present information, neither IVD nor Tiny-TIM could be assigned as providing incorrect bioaccessibility data. Yet, it is clear that the bioaccessibility results of the made grounds are so different between both models that they cannot both be true. The present research was not intended to be able to identify the most appropriate in vitro digestion model, making it impossible to assign at present the model that provides the most realistic data. Therefore, various scenarios are identified for future directions for bioavailability of lead from soil in human health risk assessment.
1
Introduction
In the Netherlands, the natural lead content of soils varies from 1.6 to 32 mg/kg (AW2000, 2004; Groot et al., 1998). However, at many sites, the lead concentration in soil often exceeds the present Intervention Value in the Netherlands (530 mg/kg). The soil in Dutch cities and villages can be contaminated with lead. This lead originates from several sources including old city waste and historic (industrial) activities. In previous times, this waste (coal ashes, lead glazed rooftiles and potsherds, lead-based paint, building waste) used to be dumped in backyards, or just outside the city walls. Due to city growth and city renewal (including the use of former industrial sites) many of these areas with this lead-polluted made ground (in Dutch: stedelijke ophooglaag) are nowadays residential areas. Repeated human contact (exposure) with these urban soils may form a health risk. Especially young children may be at risk since children ingest larger quantities of soil particles than adults because of hand-to-mouth behaviour (Lijzen et al., 2001). Moreover, it is known that children absorb lead better than adults do. It is assumed that lead is (partly) absorbed by the same mechanism as calcium (Diamond et al., 1997). Calcium is better absorbed in children than in adults as growth demands more calcium (Clarkson, 1993). Also from a toxicological point of view, children are the group at risk. Lead already affects children at low doses, resulting, among others, in impaired neurobehavioral functioning and decreased haemoglobin levels (IPCS, 1995).
In order to derive an Intervention Value for lead in soil, various assumptions were made. One of these assumptions used to be that the bioavailability of lead from soil equals the bioavailability of lead in the studies underlying the toxicological reference value. The toxicological reference value is in this case the Maximum permissible Risk (MPR), i.e. the amount of lead that children can daily be exposed to without any adverse effect. The studies underlying the toxicological reference value were performed in children that were exposed to lead via their normal diet (Ziegler et al., 1978; Ryu et al., 1983; Baars et al., 2001). Hence, the bioavailability of lead in these studies is associated with the intake of food. Many studies (in vitro and in vivo) indicate that the bioavailability of lead from soil may be lower than the bioavailability of lead from food (Freeman et al., 1994; Casteel et al., 1997; Fries et al., 1989; Freeman et al., 1996; Schroder et al., 2004). If this is the case the risks associated with the present Intervention Value for lead in soil may be overestimated. If the bioavailability of lead from soil could be taken into account in the human risk assessment of lead in soil, costs associated with soil remediation and public commotion could be avoided or reduced, whereas the safety for human health is warranted.
In the past decade, RIVM has investigated the bioavailability of lead from soil and developed a method to estimate the bioavailability of lead from soil by using an in vitro digestion model (Oomen et al., 2003; Oomen et al., 2006). Furthermore, the application of this information in the present risk assessment of lead from soil has been described (Lijzen et al., 2006). One of the findings with historically contaminated soils was that the bioavailability of lead is influenced by the soil characteristics and lead speciation (Oomen et al., 2006). This implies that information on the bioavailability of lead from soil is site-specific. However, it also suggests that the
RIVM Report 711701086 14
bioaccessibility of lead from soil may be predicted from information on the lead and/or soil characteristics. It may therefore be possible to derive general information about the bioaccessibility and relative bioavailability of lead from soil for specific soils and/or lead types.
1.1
Bioavailability
According to the general interpretation in pharmacology, oral bioavailability (F) is defined as the fraction of an orally administered dose that reaches the systemic circulation. Oral bioavailability (F) can be divided into three different major processes (equation 1; Oomen et al., 2006).
(1)
F
=
F
B× ×
F
AF
HAfter ingestion of soil, the total bioavailability (F) depends on the amount of contaminant that is released from the matrix (i.e. soil) during digestion in the gastrointestinal tract. This is referred to as bioaccessibility, (with FB the bioaccessible fraction). Part of the bioaccessible fraction is
transported across the intestinal epithelium and reaches the portal vein (absorbed fraction; FA).
Metabolization of the contaminant may occur in the intestinal epithelium and/or in the liver (first-pass effect). The fraction that is not metabolized (FH) is transported throughout the body and
represents the bioavailable fraction (F). Please note that lead is not metabolized, resulting in a FH
fraction of 1 (More information can be found in (Oomen et al., 2006)).
1.2
The relative bioavailability factor
In the body, not all bioaccessible lead (i.e. the lead released from the matrix) will become bioavailable (i.e. reach the systemic circulation). Therefore, the in vitro determined bioaccessibility value of lead from soil (FB,soil) should be converted to a bioavailability value (F)
of total lead in the body (see also equation 1).
The bioavailability of lead from soil (Fsoil) is not equal to the bioavailability of dietary lead based
on the studies that were used for deducting the Maximum Permissible Risk (MPRhuman) for lead
(FMPR) (IPCS, 1995; FAO/WHO, 1993; (Baars et al., 2001). To account for the difference in
bioavailability of dietary lead and lead from soil, the relative bioavailability correction factor (Rel F) can be used. This relative bioavailability correction factor (Rel F) for lead from soil is calculated by dividing the bioavailability of lead from soil (Fsoil) by the bioavailability of lead
from the MPR studies (FMPR). The relative F is therefore the ratio of two bioavailability values,
Fsoil and FMPR (equation 2; Oomen et al., 2006). The Rel F can be applied in risk assessment to
account for the difference in bioavailability of lead between lead from soil and dietary lead (Oomen et al., 2006).
(2) lead lead from soil dietary lead
F
F
F
(3) lead B,soil A,soil H,soil B,soil A,soil B,MPR A,MPR H,MPR B,MPR A,MPR
F
F
F
F
F
F
=
F
F
F
F
F
Rel
×
×
=
×
×
×
×
If lead is the contaminant, no metabolization is expected, resulting in a FH, soil fraction of 1. For
FMPR a value of 0.4 is used, as it is assumed that the bioavailability of dietary lead in the studies
underlying the MPR was 40 %. In addition, for the “average physiological state”, the fraction of bioaccessible lead that is absorbed is assumed to be 0.8 (FA, soil = 0.8), based on a FA,fed for
children of 0.62 and a worst case assumption of FA,fasted for children of 1. Further details are
explained in Oomen et al., (2006). If these values are introduced in equation 3, the relationship between relative bioavailability factor and bioaccessibility of lead from soil becomes:
(4) B,soil A,average,children B,soil B,soil B,soil
MPR
F
F
F
0.8
F
F
2 F
F
0.4
0.5
Rel
=
×
=
×
=
= ×
The relative bioaccessibility, as derived with equation 4, is valid for orally ingested soil.
1.3
Current use of bioavailability in risk assessment
In the present risk assessment of contaminated soils, the potential risk (for children) might be overestimated since information concerning the oral bioavailability of lead from soil by the human body is missing. This overestimation could lead to unnecessary remediation of sites resulting in high clean up costs and possible social unrest in contaminated areas.
The Dutch risk assessment for lead is based on a criterion laid down by the FAO/WHO (1993) and the IPCS (1995). The recommendation is to avoid blood lead levels above 50 μg/l, corresponding with a provisional tolerable weekly intake (PTWI) of 25 μg/kg body weight per week (equal to a Tolerable Daily Intake (TDI) of 3.6 μg/kg body weight per day (Baars et al., 2001)). This Maximum Permissible Risk (MPR) criterion is based on the bioavailability (F,MPR) of
40 % of dietary lead for children (Ziegler et al., 1978; Ryu et al., 1983).
The present Dutch Intervention Value for lead in soil is 530 mg/kg dry matter for standard soil (10% organic matter and 25% clay). For other soil types a generic correction is used (VROM, 2006). The difference in bioavailability of lead from soil between soil and dietary lead is taken into account using a “default” intervention value correction factor for the relative oral bioaccessibility of 0.74. This factor is based on the P80 percentile of all the relative bioavailability factors determined for soil for fasted conditions (Rel Ffasted) up till 2006 of 0.87 (Lijzen et al.,
2006). Moreover, the average physiological condition of the human gastrointestinal tract is taken into account (assumption of half fasted and half fed conditions). It is known that, the bioavailability of lead from soil is lower for fed (or average) conditions compared to fasted conditions, as the higher pH in the stomach decreases the release of lead from soil. Since exposure to lead is a chronic process, and children’s physiological state can be assumed to be sometimes
RIVM Report 711701086 16
fed, sometimes fasted, and sometimes in-between, the assumption of an average physiological state for the derivation of a relative bioavailability factor seems reasonable. Therefore, an “average physiological state” correction factor (CFAPS, 2006) was taken into account. This factor is
based on the P80 percentile of the RIVM in vitro digestion (IVD) model performed with 11 soils for both fasted and fed conditions (CFAPS, 2006) up till 2006 (=0.854). Therefore, the provisional
correction factor for the intervention value for relative bioavailability (P80 [Rel Ffasted, 2006] × P80
[CFAPS, 2006] = 0.87 × 0.854) was 0.74. Additional information on the derivation of this
intervention value correction factor and information to assess the human health risk for specific sites can be found in the following reports (Oomen et al., 2006; Lijzen et al., 2006).
As already indicated in 2006, the provisional correction factor for bioavailability of lead from soil (0.74) is based on a relative small number of soils. In 2008, a letter report updated the “average physiological state” correction factor with bioaccessibility data of lead (fasted and fed conditions) of additional soils (seventy soils in total) for derivation of CFAPS (P50 = 0.81; Hagens et al.,
2008). These data are also included in this report.
Furthermore, previous studies by Oomen et al. (2006) suggested that the bioavailability of lead depends on soil characteristics and the lead speciation (Oomen et al., 2006). It was therefore decided to determine the bioavailability of lead from soil in a considerable number of soils. In order to focus the research, soils would be selected that provide the most beneficial information for policy makers and local authorities, i.e. the soils that regularly exceed the intervention value of lead and for which exposure to humans is considerable. These conditions especially hold for made grounds.
1.4
Aim of the research
The aim of the present research is to improve human health risk assessment for made grounds by deriving one (or more) generic correction factor(s) for the relative bioavailability of lead from these typical city soils. In this way and with suitable data, based on soil characteristics and lead mineralogy only, the bioavailability of lead from soil might be estimated without site specific measurements.
In this present research, a relative bioavailability factor is determined for a large number of made grounds (ninety) that are typical for old inner cities. In addition, relationships between relative bioavailability factors and soil and/or lead characteristics will be studied and recommendations on the application of Rel F in risk assessment will be made.
In addition, the relative bioavailability of these soils as determined with the in vitro digestion (IVD) model of RIVM and the Tiny-TIM model of TNO will be compared and discussed.
1.5
Approach
To obtain the needed samples of made grounds representative for the Netherlands, Dutch cities were selected based on their original soil characteristics. The environmental services of these cities were asked to provide information on relevant locations with lead contamination within their city. Besides information about the contamination of the location, also information concerning the former use of the location and the lead and soil characteristics was gathered. Subsequently, ninety appropriate soils were selected and sampled.
The bioaccessibility of lead from these soils was determined by the IVD digestion model. Subsequently, the lead and soil characteristics were determined, including total lead content, pH, organic matter and determination of the carbonate, iron, sulphur and clay content. On a subset of thirty soils a multi-element analysis was performed to determine the major, trace and lead isotopic composition of these soils, which provides information on the origin of lead. A smaller subset of sixteen representative soils was selected (including soils from all cities) for additional bioaccessibility experiments by the Tiny-TIM model of TNO. Moreover, the chemical composition and the particle size of the lead phases present in these sixteen soils was determined by scanning electronic microscopy. Relationships between the bioavailability of lead from soil with soil characteristics and lead speciation were investigated.
Furthermore, the Tiny-TIM and IVD data, including the methodology were compared and discussed.
RIVM Report 711701086 18
2
Site selection, sampling, preparation of
soils
2.1
Site selection
In order to cover the most relevant areas in the Netherlands, the sample sites (cities) were selected based on soil lithology. The number of sample sites was divided equally over cities that are located on the following subsoils: dune sands, loess, fluviatile clay/sand, marine clay/sand and aeolian sands (In Dutch: duinzand, loss, rivierklei/zand, zeeklei/zand and pleistoceen zand, respectively). Subsequently, made grounds must be present in the selected city. Preferably, the made ground should be present in the top soil (0-20 cm), since children are primarily exposed to this top soil layer. The sampled made grounds should contain a concentration of lead relevant for human health risks. Therefore, sites with a lead content of approximately one to five times the present Intervention Value of lead (530 mg/kg) were selected.
In this study, the made ground is defined as the man-made soil layer that is applied on the original soil. This specific layer is laid down to prepare the soil for city use (consolidate, raise or fill the original soil). Made ground contains non-soil phases such as rubble, building waste, residential garbage and/or waste from former industrial activities. The characteristics of a specific made ground can be determined by (pre) investigation of the location (according to NEN 5740:1999). It was intended to sample up to three sites per city. From each sample location, two samples were taken from the made ground. Due to sampling difficulties (too low lead concentration, impenetrable layer or restricted access to the location) alterations were envisaged.
The criteria for the selection of the soils in short: • presence of a made ground
• access to location and soil
• lead contamination between 500 and 2500 mg/kg (~one to five times the current intervention value)
• selection of cities with different lithology (original soil) • selection of lead contamination from different sources
• preferably, samples should be taken from the top soil (0-20 cm)
From May - July 2007, the environmental services of more than a dozen cities with known lead polluted soils were approached with the question to cooperate. The environmental services were asked to appoint sample sites that meet the criteria above. Based on this information, the final selection of sixteen cities was made (Table 2.1).
RIVM Report 711701086 20
2.2
Soil sampling
In August – September 2007, ninety lead contaminated soil samples were collected by BKK bodemadvies (Meijel, the Netherlands) based on the information gathered during the soil selection phase. At the location, at least 2.5 kg mixed soil was sampled (according to NEN5740). The lead content of the soil sample was measured on-site with a portable XRF, a mobile detector capable of
measuring a variety of elements including lead. If the concentration of lead was too low (< Intervention value of 530 mg lead/kg dry soil) or too high (> five times Intervention Value), the soil sample was discarded and a new sample was taken. Of each sample, a short description of the layer, including the made ground was given. In addition, of each location, a photograph was taken.
An overview of the collected samples is represented in Table 2.1. It was intended to select up to three sample sites per city. Per sample location, two samples were taken from the “made ground”. However, sampling difficulties at the selected location (too low lead concentration as assessed with the portable XRF, impenetrable layer or restricted access to the location) caused some minor alterations in soil sampling.
Table 2.1: Composition of the total set of samples from the made grounds, including their location.
2.3
Soil preparation
The ninety field-wet soil samples (2.5 kg) were split in one part of 0.5 kg and one part of 2 kg (splitting performed by BLGG, Oosterbeek, the Netherlands).
Samples per city
Locations
per city Lithology
1 Alkmaar 2 1 2 Den Haag 8 5 3 Haarlem 6 3 4 Echt-Susteren 9 4 5 Maastricht 8 4 6 Leiden 5 2 7 Schoonhoven 6 3
8 Wijk bij Duurstede 2 1
9 Zutphen 4 2 10 Groningen 6 2 11 Nijmegen 6 3 12 Utrecht 7 4 13 de Rijp 7 4 14 Delft 6 3 15 Rotterdam 6 3 16 Schiedam 2 1
90 samples 45 location 5 types of subsoil Cities 16 cities Marine sand / clay Dune sand Loess Fluviatile sand / clay Aeolian sands 1 2 3 4 5 6 7 8 9 10 11 13 12 14 16 15 1 2 3 4 5 6 7 8 9 10 11 13 12 14 16 15
2.3.1
The 2 kg part
The 2 kg part was processed according to NEN 5751. This preparation included drying, homogenisation, milling and sieving (2 mm) of the sample (performed by BLGG). The sample was evenly divided in four parts.
− Part A was used to measure the bioaccessibility by the IVD method of RIVM. In addition, part A was also used to measure the total lead content of the soil (Alcontrol). For this additional total lead measurement at Alcontrol, the soil (part A) was prepared according AS3000 (homogenisation and grinding to < 500 µm, in accordance with NEN 5709 followed by the microwave assisted destruction and lead detection).
− Part B was stored at the RIVM as a back-up sample.
− Part C was send to TNO for the Tiny-TIM bioaccessibility experiments (for sixteen samples). − Part D was used by BLGG for the determination of the soil characteristics.
2.3.2
The 0.5 kg part
The 0.5 kg field-wet subsamples were send to Deltares (Utrecht, the Netherlands) for preparation and additional analyses. Deltares prepared sixteen soil samples for scanning electron microprobe (SEM) analysis and thirty samples for ICP major, trace and Pb isotope analysis (aluminium (Al), barium (Ba), calcium (Ca), cerium (Ce) , cobalt (Co), chromium (Cr) , copper (Cu), iron (Fe), potassium (K), lithium (Li), magnesium (Mg), manganese (Mn), sodium (Na), nickel (Ni), phosphorus (P), lead (Pb), sulphur (S), strontium (Sr), titanium (Ti), vanadium (V), yttrium (Y), zinc (Zn) , zirconium (Zr), arsenic (As), cadmium (Cd), antimony (Sb), tin (Sn), silver (Ag) and the 206Pb/207Pb and 208Pb/206Pb ratios).
For SEM analysis, approximately 400 g of each selected soil sample was freeze dried to avoid clottering and hardening of the samples. For optimal SEM analysis, the physical structure of the soil samples must not be altered by the preparation process. The sixteen freeze dried soil samples were send to CORUS (IJmuiden, the Netherlands) for SEM analysis. CORUS cast the soil samples in epoxy resin, made polished sections of the cast samples and coated the polished sections with carbon prior to the SEM analysis.
For ICP analysis, approximately 40 g of each selected soil sample was freeze dried. The dried soil samples were digested according to the following procedure: subsamples of 0.125 g were weighed into Savillex 50 ml Teflon vessels and 1 ml 16 M HNO3, 1.5 ml 12 M HClO4 and 2.5 ml 29 M HF
was added. The vessels were closed and heated overnight in an aluminium heating block at 90ºC. The vessels were opened and evaporated to incipient dryness in an aluminium heating block at a maximum temperature of 160ºC. Five ml 16 M HNO3 was added and the open vessels were
heated for 1 hour in an aluminium heating block at 90ºC. Finally 20 ml 1 M HNO3 was added and
the open vessels were heated for 2 hours in an aluminium heating block at 90ºC. After cooling and dilution (about a 1000 times) digestions were ready for ICP analyses.
RIVM Report 711701086 22
2.4
Discussion
In 2007, RIVM published a guideline for determination of oral bioavailability of lead from soil, including guidance on soil sampling and preparation (Hagens et al., 2007). The soil sampling strategy, as outlined in the guideline, was not followed completely in the present research (see also section 2.6 of the guideline (Hagens et al., 2007)). The sampling strategy in the guideline is to obtain an average soil sample of the location. To acquire an average sample, fifty small digs of the location are combined to one blended sample. Due to the specific research question of this project, combined with the above mentioned criteria, an “average” sample is not suitable. In that case differences in soil characteristics and lead speciation would be levelled out. Rather, a single soil sample (of 2.5 kg) from the made ground contaminated with lead (> Intervention value of lead) was used for the present research.
For other aspects of soil sampling and preparation, i.e sieving, splitting and drying of the soil, the guideline is followed.
2.5
Conclusions
Sixteen cities were selected for soil sampling based on the selection criteria 1) difference in lithology and 2) presence of lead polluted “made ground”. The presence of the “made ground” was confirmed visually in the field. With a portable XRF, only lead polluted soils were selected for further research. This sampling strategy resulted in a total of ninety soil samples that represent lead polluted “made grounds” in many Dutch cities and villages.
3
Soil characterisation
3.1
Introduction
As mentioned in chapter 1, the bioavailability of lead from soil may be different than the bioavailability of lead from food (Freeman et al., 1994; Casteel et al., 1997; Fries et al., 1989; Freeman et al., 1996; Schroder et al., 2004). According to these studies, this difference might be caused by specific soil characteristics (addressed in this chapter) and lead characteristics (addressed in chapter 4), Of the soil characteristics, the pH, organic matter, clay (lutum), calcium carbonate, total sulphur and reactive iron content are determined for each made ground.
3.2
Methods
After collection of all the ninety samples (2.5 kg), the samples were pre-treated for further analysis. The soil characteristics were analysed on Part D of each soil (see section 2.3.1). Of each soil, the following characteristics were determined (by BLGG), according to current guidelines: soil pH, organic matter, clay (lutum), calcium carbonate, total sulphur and reactive iron content. All measurements are single measurements (no multiple determinations of the characteristics).
Soil pH. The soil pH is determined according the international standard for the routine
determination of pH. This method uses a glass electrode in a 1:5 (volume fraction) suspension of soil in 0.01 mol/l calcium chloride (NEN-ISO 10390:2005).
Organic matter. The organic matter of the pre-treated soils is determined by the (international)
standard NEN 5754, NEN-ISO 11465. This method determines the organic content of soil on a mass basis as loss-on ignition.
Clay. The clay content (in Dutch: lutum) in each soil is determined by sieve and pipette according
to the standard NEN 5753.
Calcium carbonate. The calcium carbonate content in each soil is determined according to the
international standard NEN-ISO 10693.
Total sulphur. The total sulphur content in each soil is determined following the international
standard ISO 15178. This determination uses the dry combustion method.
Reactive iron. The reactive iron content in an ammonium oxalate-oxalic acid extract of each soil
RIVM Report 711701086 24
3.3
Results
The soil characteristics are determined for the ninety soils from made grounds. These results are listed in Appendix 1 of this report. A summary of the results is represented in Table 3.1. This table includes the average values and standard deviation of the ninety made grounds for each determined soil characteristic. In addition, the lowest and highest value of the ninety made grounds is indicated.
Table 3.1: Averaged soil characteristics of the made grounds, including the standard deviation, highest and lowest value measured.
pH Organic
matter Clay
Carbonate
content Total Sulphur Iron content
% % % CaCO3 mg S/kg mmol Fe/kg
7.1 6.7 7 2.9 1408 89 0.5 4.7 5 2.4 2518 61 6.0 1.4 1 0.2 171 28 9.5 21.8 24 11.7 17986 319 Made grounds Soil characteristics (n = 90 samples) Average Standard deviation Lowest Highest
3.4
Discussion
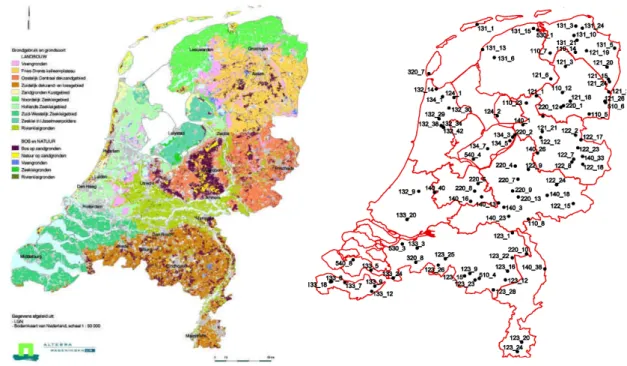
To interpret the data, listed in Table 3.1, these values are compared with published values of hundred unpolluted rural Dutch soils (only background exposed soils). In this recent study, referred to as “achtergrondwaarden 2000” (AW2000, 2004), the background concentrations for in total 252 contaminants have been determined. The soils were taken from nature reserves and farms in the Netherlands in order to compile a database of unexposed Dutch rural soil values for both the top soil (0-20 cm) and the subsoil (50-100 cm). Moreover, several soil characteristics were analysed and reported. The results of the AW2000 are based on 100 (unexposed) sites throughout the Netherlands with different lithology. These sites were sampled throughout the Netherlands, based on a stratified, random sampling strategy (Figure 3.1; AW2000, 2004). The average soil characteristics of the examined soils are summarized in Table 3.2. For comparison, the soil characteristics of the “made ground” are also given this table.
Figure 3.1: The soil lithology in the Netherlands, indicated with different colours (left panel) and the random selected soil locations for AW2000, indicated with numbers (right panel) (adapted from the AW2000 report, Figures 1 and 2, AW2000, 2004).
Table 3.2: Averaged soil characteristics, including the standard deviation, from rural, background exposed soils in the Netherlands (AW2000, reported in 2004) and the made ground (present study).
top soil (0-10cm) subsoil (50-100cm)
Samples (#) 100 100 90 organic matter (%) 8.1 4.3 6.7 standard deviation 11.2 10.5 4.7 clay (%, < 2µm) 11.6 10.5 7.0 standard deviation 11.5 11.3 5.0 pH 5.6 6.0 7.1 standard deviation 1.4 1.3 0.5 CaCO3 (%) 1.1 1.3 2.9 standard deviation 2.3 2.5 2.4
1: Background values of soils in the Netherlands (Achtergrondwaarden 2000, reported in 2004) 2: This study, 2009
NB: Reactive iron and total sulphur content were not reported in the AW2000 study Rural, background exposed soil (Netherlands)1
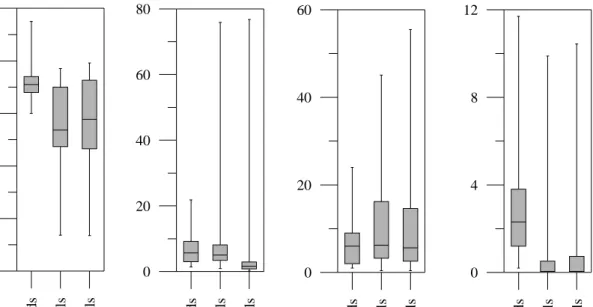
RIVM Report 711701086 26 0 2 4 6 8 10 pH Ma de g rou nds Ru ra l to p so il s R u ra l su bsoi ls 0 20 40 60 80 OM (wt %) Made gr o und s R u ra l t o p so ils Ru ra l s u bs o ils 0 20 40 60 Clay (wt %) M a d e g rou nd s Ru ra l tops oil s R u ra l su bso ils 0 4 8 12 CaCO3 (wt %) M a d e g rou nd s Ru ra l tops oil s R u ra l su bso ils
Figure 3.2: Box-and-whisker plots of the soil characteristics pH, organic matter (OM), clay (lutum) and calcium carbonate from ninety made grounds (this study) and hundred rural, background exposed soils in the Netherlands (AW2000, reported in 2004). The whiskers represent the lower and upper quartile (25 and 75 percentile).
Table 3.2 and Figure 3.2 indicate that the average clay (lutum) content and organic matter content (top and subsoil) of the rural soils are comparable with the made grounds. However, the standard deviation of the rural soils is larger compared to the made grounds. Moreover, the pH of the made ground is higher than the average background exposed soils. It is suggested that the higher calcium carbonate content accounts for this difference in pH. Calcium carbonate in the made ground is amongst others included in the rubble and poses the capacity to buffer the soil. This will most likely result in a higher pH compared to the rural soils that do not contain rubble particles containing calcium (Table 3.2, Figure 3.2).
No large differences in soil characteristics (pH, carbonate content, clay and organic matter, Table 3.1) were identified for the made ground originating from five different types of subsoils (Table 3.2, Figure 3.2). Therefore, it can be concluded that the “made ground” shows rather uniform soil characteristics. The specific “made ground” is a rubble containing layer on top of the original lithology. The relationship between the bioaccessibility of lead from a “made ground” and the soil characteristics could therefore, in principle, be applicable for any lead contaminated made ground. This conclusion does not rule out exceptions in which a “made ground” shows deviating soil characteristics.
3.5
Conclusions
Although the ninety made grounds were taken from sites that have, in total, five different soil types, the made grounds show a remarkable similarity in soil characteristics. It is concluded, based on the soil pH, organic matter, clay and carbonate content, that the determined soil characteristics are typical “made ground” characteristics. Therefore, the relationship between the bioaccessibility of lead from a “made ground” and the soil characteristics could, in general, be applicable for any lead contaminated made ground.
RIVM Report 711701086 28
4
Lead characterisation
4.1
Introduction
The aim of the present research is to examine the bioavailability of lead from specific made grounds and to link the bioavailability to soil and lead characteristics. In order to examine the relationship between lead bioavailability and specific lead characteristics, lead was characterized by the determination of:
1. the total concentration of lead in the made grounds; 2. the source of lead in the made grounds;
3. the primary and secondary lead phases. The mineralogy of lead that entered the soil (primary lead phase) can dissolve over time and form secondary lead containing minerals;
4. the chemical composition and size (diameter) of the lead phases.
Based on previous research by e.g. Steele et al., (1990), Cotter-Howells and Thornton (1991), Davis et al., (1993), Ruby et al., (1992, 1996, 1999), Rieuwerts et al., (2000), Hettiarachchi and Pierzynski (2004) and Walraven et al., (in prep.) it is known that the chemical composition of the anthropogenic lead source and size of lead in soils might be associated with the bioaccessibility of lead from soils.
4.2
Total lead detection
4.2.1
Introduction
The total lead content of the soils is determined with various methods (XRF, real total ICP and so-called total ICP) by various institutes (RIVM, TNO Quality of Life, Deltares, Alcontrol and BKK Bodemadvies). Moreover, since each in vitro digestion experiment contains a detection of the released lead from soil into the chyme (the bioaccessible lead fraction) and a measurement of the total lead that remains in the soil, a mass balance (released lead from soil + remained lead in soil) should, in principle, equal the total lead in the soil prior to experimentation. These experiments are performed twice (in duplo). Therefore, ninety mass balance estimations in duplo of the total lead concentration are obtained.
4.2.2
Methods
Lead was detected in soil by several methods:
Field-XRF method. BKK Bodemadvies determined the total lead content of all soil
samples with a NITON portable XRF. The measuring time was set at 2 minutes per soil sample.
RIVM method. The total lead concentration in the ninety soils was detected by a method
RIVM Report 711701086 30
that a 1:3 dilution of aqua regia with distilled water was used. Following the destruction, the soluble lead in the acidic mixture was detected with ICP-MS according NEN-ISO 17294-2.
Alcontrol method. The total lead concentration in the ninety soils was measured by a
method according to NEN 6961: microwave assisted destruction of soil with undiluted aqua regia. Following the destruction, the soluble lead in the acidic mixture was detected with ICP-AES according NEN 6966.
Deltares method. The soil samples were digested according to the method described in
section 2.3.2. Following the destruction, the soluble lead was detected with ICP-AES analyses in accordance with NEN 6966.
In addition, lead was detected in chyme. For the RIVM method, the chyme was diluted with 0.1 M HNO3, after which the concentration of lead was determined with ICP-MS according to
NEN-ISO 17294-2.
Note that for the RIVM in vitro digestion (IVD) experiment (chapter 5), the part of lead that remains attached to the digested soil (pellet) is separated from the soluble lead in the digestion juice (chyme) by centrifugation. The part of lead in the chyme is referred to as the bioaccessible fraction of lead.
Furthermore, lead was detected in the pellet obtained after the IVD digestion experiment. For the RIVM method, the total lead concentration in the pellets (i.e. the digested soil after in vitro digestion) was detected by a method based on the microwave assisted destruction of the soil according to NEN 6961, except that a 1:3 dilution of aqua regia with distilled water was used. Following the destruction, the soluble lead in the acidic mixture was detected with ICP-MS according NEN-ISO 17294-2. In theory, the amount of the contaminant in the chyme and pellet should equal the amount of contaminant in the soil before the start of the digestion (mass balance). This mass balance can be used to evaluate the quality of the experiments.
4.2.3
Results
The total lead concentrations of the soils is determined with several different methods (field XRF, RIVM, Alcontrol (ninety soils), HF (thirty soils), TNO (sixteen soils) and by calculating a mass balance (ninety soils, in duplo). These data are listed in Appendix 2 of this report. A summary of the results is presented in Table 4.1. This table includes the average values of the ninety soils for each method.
Table 4.1: Averaged total lead concentrations of the soil samples from made grounds (note the difference in the number of samples).
field-XRF ICP-MS ICP-AES HF
BKK RIVM Alcontrol Duplo I Duplo II TNO Deltares
90 90 90 90 90 16 30
845 1268 1148 1061 1244 1268 1501
Made grouds Mass balance:
Chyme + Pellet Amount of samples
Total lead detection in soil (mg Pb/kg soil)
Average lead
4.2.4
Discussion
As can be seen in Table 4.1, the determined lead concentration for a specific soil can differ substantially with the different methods. Therefore, the choice for a specific lead detection method to use for the calculation of the bioaccessibility of lead from soil will have an impact on the calculated bioaccessibility of lead from soil. The bioaccessibility of lead from soil is calculated by dividing the amount of lead released from the soil in the in vitro digestion by the total lead concentration found in the soil.
In Table 4.1, the portable Field XRF method results in the lowest average lead concentrations. It is suggested that this method underestimates the total lead concentration in soil since this measurement was performed on the wet soil. Moreover, this method was only used to check whether the lead concentrations were high enough to include the soils in this study. Therefore, the concentration obtained with the field-XRF can be considered to be indicative. Moreover, the highest lead concentrations in the soils were detected with the HF method, performed at Deltares. On average, the HF method (n=30) is able to detect 18 % more lead in soil compared to the same thirty soils measured by RIVM method. Lastly, the total lead determinations, performed at RIVM, Alcontrol and TNO show smaller variations in average lead concentration than when compared with results with HF destruction and field-XRF. The Alcontrol method detects systematically less total lead in soil compared to the soils measured by RIVM (n=90) and TNO (n=16) (see also section 4.2.4.1). Yet, for individual soils, considerable differences in detected total lead concentration can be observed between RIVM, Alcontrol and TNO.
Heterogeneity of the soil samples is another source of variation of total lead concentration. It is possible that, for instance, lead is associated with rubble particles in the made ground. Although these soils (sieved to < 2 mm) were intensively mixed, it may be that the lead is not evenly divided in the soil, resulting in variations in lead content per measured soil sample. To solve this problem, it is recommended to measure the total lead concentration per method at least in duplo or triplo to obtain an average lead concentration per sample.
It is expected that the destruction method used will have impact on the total lead detection in soils. It is known that destruction with aqua regia will not dissolve all lead in soil. Only HF destruction will completely dissolve all lead from soil, since this method also dissolves immobile and encapsulated lead. For risk assessment, it can be assumed that this immobile and encapsulated part of lead from soil will not be bioavailable and therefore not cause a potential health risk. After
RIVM Report 711701086 32
all, if a microwave digestion with aqua regia is not able to release this stable part of lead from soil, it can be expected that the human gastric tract will also not be able to release the lead from this immobile and encapsulated matrix. For the calculation of the bioaccessibility of lead from soil, the HF total lead measurements can, in principle, be used, as this provides for certain the total amount of lead in soil. However, the obtained bioaccessibility calculated with total lead in soil obtained with HF destruction results will not equal the bioaccessibility calculated with total lead in soil obtained with the microwave assisted aqua regia destruction. As this latter method is normally used as a default, is cheaper, less labour intensive and, relative to the HF method, less dangerous to perform, the microwave assisted aqua regia destruction is the preferred method of choice by NEN.
However, the results of the RIVM and Alcontrol method, based on the microwave assisted aqua regia destruction are not quite comparable. Therefore, a more thorough discussion is needed to appoint the method of choice for the calculation of the bioaccessibility of lead from soil in this study.
4.2.4.1 Lead detection: comparison of RIVM and Alcontrol method
The total lead concentrations obtained with the RIVM and Alcontrol method are significantly different, based on the Wilcoxon signed rank test. Figure 4.1 reveals the X-Y scatter plot of the total lead concentration determined with the Alcontrol method (x-axis) versus the RIVM method (Y-axis). With the statistical software package R 2.7.1 (R Development Core Team, 2008), four outliers were detected, being sample 8, 22, 55 and 63. These outliers were excluded from the database prior to making the XY-scatter plot. It is noted that the Wilcoxon signed rank test revealed a significant outcome before and after the exclusion of the four identified outliers.
The systematic difference in both methods is ~20 %, based on the slope of the trendline. This implicates that the RIVM method detects about 20 % higher lead concentration compared to measurements from the same soil by the Alcontrol method. As a consequence, the calculated bioaccessibility values and the relative oral bioavailability factors, based on RIVM and Alcontrol total lead data, are significantly different. Therefore, the choice which method for total lead analysis is used for the determination of the bioaccessibility of lead from soil will, unfortunately, influence the outcome of the risk assessment for these soils.
Figure 4.1: The X-Y scatter plot of the total lead concentration in soil determined with the Alcontrol method (X-axis) versus the RIVM method (Y-axis). A trendline is plotted in this graph, including the equation and the R2 of the trendline. Also, the Y=X line is plotted in this figure.
There are two main differences identified between the Alcontrol and RIVM lead detection method, being the method for lead detection (1) and the destruction method of the soil (2).
4.2.4.2 Lead detection
The RIVM and Alcontrol method use a different detection technique to determine the dissolved lead after the destruction step.
• The RIVM lead detection method uses the ICP-MS technique according NEN-ISO 17294-2. • The Alcontrol lead detection method uses the ICP-AES technique according NEN 6966. It is expected that the detection method used will not account for the considerable differences found in estimated lead concentrations in soils. Both methods are performed according standard guidelines and use appropriate quality controls.
4.2.4.3 Destruction method
Prior to lead detection, the soils are destructed in a microwave to dissolve the lead in a hot and acid mixture under pressure.
• The RIVM destruction method is based on the current NEN 6961-guideline. However, in contradiction with the guideline, the RIVM method used diluted aqua regia (1:3) with water. • The Alcontrol destruction method is according to the current NEN 6961-guideline.
y = 1.22x R2 = 0.80 0 1000 2000 3000 4000 5000 6000 0 1000 2000 3000 4000 5000 6000
Total lead Alcontrol method (mg Pb/kg)
T o ta l l ead RI V M m e thod ( m g P b /k g ) Y=X
RIVM Report 711701086 34
It could be anticipated that undiluted aqua regia would be able to dissolve more lead in soil. This would results in higher lead concentrations determined by the Alcontrol method compared to the RIVM method. However, the RIVM method, with diluted aqua regia, revealed systematically higher lead concentrations from soil (20 %), compared to the Alcontrol method. An explanation for this result could be that next to the dilution of the aqua regia, also the conditions inside the microwave (pressure, temperature and time) are important for the result of the microwave assisted digestion. Moreover, the NEN 6961 guideline specifies the destruction conditions as a range in temperature and time (Figure 4.2). Hence, the exact destruction conditions can vary within the specified range. This is probably the reason for the systemic difference in the outcome of the total lead concentration in the soils.
Figure 4.2: The range of the destruction temperature and corresponding destruction time, indicated in grey. This picture represents Figure 1 from the NEN 6961:2005 guideline and is reproduced with permission from NEN (Delft, the Netherlands; www.nen.nl).
In addition, a previous RIVM report described the optimisation of the destruction method with soils. In this study, several different dilutions of aqua regia were tested (under the same microwave conditions). As a result, no differences were observed between diluted and undiluted aqua regia destruction (and the subsequent lead detection) of the reference soil Montana Soil 2710 (Van der Velde-Koerts, 1997). So, probably, the difference in microwave conditions and not the dilution of aqua regia is responsible for the different results of RIVM and Alcontrol method. The reference soil Montana Soil 2710, certified by NIST (National Institute for Standardization and Technology), was also studied in the present study by the RIVM. The thus obtained values for
Destruction time (min)
De st ru ct io n tempe ra tu re (° C)
Destruction time (min)
De st ru ct io n tempe ra tu re (° C)
lead were close to the certified lead concentration of MS2710 (5519 mg/kg measured by RIVM versus 5532 mg/kg certified by NIST).
4.2.4.4 Decision for the total lead detection method in soil
Based on the above considerations, it was concluded that although the RIVM method was not performed according to the NEN 6961 guideline, the obtained lead concentrations were in agreement with the reference soil MS 2710 and the reported TNO lead concentrations (chapter 8). It is recognized that, since the NEN 6961 guideline specifies temperature and time as a range, lab to lab differences can occur (Figure 4.2). The data obtained with the Alcontrol method resulted in lower lead concentrations as expected. Therefore, in this study, the preference was given to the total lead data obtained with the RIVM method. Hence, the bioaccessibility of lead from soil is calculated with total lead concentrations in soil obtained with the RIVM method.
4.3
Multi-element analysis
4.3.1
Introduction
Made grounds can be polluted with various lead sources, e.g. lead-glazed potsherds, white lead, industrial waste, etc. These lead sources can contain, besides lead, various other metals, like iron, zinc, copper, arsenic, barium, nickel, chromium, cadmium, tin, antimony and silver. The presence and content of metals in the soil samples, can give information about the anthropogenic lead sources in the soil samples, and can thus indicate the origin of the lead pollution.
Multi-element analysis in combination with “fuzzy c-means (FCM)” clustering is performed to characterize the lead pollution in thirty selected samples. The results of the multi-element and FCM cluster analysis are used to determine if the made grounds are polluted with the expected lead sources, based on historic information and/or pre-investigation of the sites. The expected lead sources are white lead, ceramic industry slag, vitriol slag, zinc white slag and city waste (mixture of e.g. lead-glazed potsherds, coals ashes, lead based paint flakes and chips of lead sheets).
White lead and ceramic industry slag (mainly lead glazed rooftiles) are characterized by high amounts of lead and can be accompanied with trace amounts of e.g. silver and antimony. Vitriol slag is dominated by high contents of iron, sulphur, zinc, lead and barium. These are the waste products of pyrite ore. The chemical composition of zinc white slag resembles that of vitriol slag, but can be distinguished based on the higher zinc content in relation to the iron, sulphur, lead and barium content. Since city waste is a mixture of various lead sources and other heavy metal sources, the chemical composition of this source can be variable. However, city waste is mainly dominated by high contents of lead and zinc.
4.3.2
Methods
The thirty selected soil samples are prepared according to the method described in section 2.3.2. Aluminium (Al), barium (Ba), calcium (Ca), cerium (Ce), cobalt (Co), chromium (Cr), copper (Cu), iron (Fe), potassium (K), lithium (Li), magnesium (Mg), manganese (Mn), sodium (Na),
RIVM Report 711701086 36
nickel (Ni), phosphorus (P), lead (Pb), sulphur (S), strontium (Sr), titanium (Ti), vanadium (V), yttrium (Y), zinc (Zn) and zirconium (Zr) content is determined with an ICP-AES according NEN 6966. The arsenic (As), cadmium (Cd), antimony (Sb), tin (Sn) and silver (Ag) content is determined according NEN-ISO 17294-2.
4.3.2.1 Fuzzy c-means clustering
Fuzzy c-means (FCM) clustering is used to try to subdivide the multi-element dataset into homogeneous groups. FCM clustering is chosen as clustering technique because it allows some vagueness in the description of the cluster model and thus deals better with overlap between clusters. A statistical technique to evaluate the FCM clustering is non-linear mapping. FCM clustering and non-linear mapping are based on different theoretical considerations, and thus any similarities between the data structures elucidated in the application of both techniques are a strong indication of their true existence (Vriend et al., 1988). For the present dataset, the aim was to label clusters based upon differences in lead sources.
To eliminate the influence of lithological differences between the made grounds, the clustering is performed on the enriched metal content of the samples. Van der Veer (2006) developed an enrichment/depletion model based on the aluminium content of soils to estimate enrichment/depletion of elements in Dutch soils. This model is used to calculate the enriched content (pollution) of metals in the made grounds. For more details see Van der Veer (2006).
4.3.3 Results
The results of the multi-element analysis are listed in Appendix 3. The enrichment/depletion model of Van der Veer (2006) shows that the lead, zinc, copper, arsenic, nickel, antimony, tin and barium content is enriched in the majority of the thirty selected samples. The elements titanium, chromium, potassium, lithium, magnesium, vanadium and yttrium were not, or only incidentally, enriched in the made grounds.
The model of Van der Veer (2006) cannot be applied for sodium, calcium, strontium, manganese, sulphur, phosphorus, cadmium, mercury, molybdenum and zirconium. These elements were therefore beforehand excluded from the FCM clustering analysis. Van der Veer (2006) did not include cerium, cobalt and silver in his enrichment/depletion model. Since silver is known to be present in the lead ore galenite, it was decided to include the silver data in the clustering analysis. Since the number of samples was limited, 6 enriched elements were selected for the FCM cluster analysis: EPb, EZn, EFe, ESb, EBa andEAg. The content of these elements is listed in Appendix 4.
This selection is based on the expected chemical differences between the lead sources.
In order to obtain a meaningful FCM clustering, the dataset has been examined for missing values and for deviations from normality. Missing values are omitted for statistical purposes. Normal probability plots show that the enriched elements EPb, EZn, ESb, EFe, EBa and EAg have a lognormal