OPPORTUNITY OR BARRIER?
The effect of the two-cycle Bologna
structure on social inequalities in the
tertiary educational system in Flanders
OPPORTUNITY OR BARRIER?
The effect of the two-cycle Bologna structure
on social inequalities in the tertiary
educational system in Flanders
Ilse Laurijssen & Ignace Glorieux
Promotor: Ignace Glorieux
Research paper SSL/2016.05/4.1.3
Leuven, juni 2016
Het Steunpunt Studie- en Schoolloopbanen is een samenwerkingsverband van KU Leuven, UGent, VUB, Lessius Hogeschool en HUB.
Gelieve naar deze publicatie te verwijzen als volgt:
Laurijssen, I. & Glorieux, I. (2016). Opportunity or barrier? The effect of the two-cycle Bologna structure on social inequalities in the tertiary educational system of Flanders. Research paper SSL/2016.05/4.1.3, Leuven: Steunpunt Studie- en Schoolloopbanen (SSL).
Voor meer informatie over deze publicatie torinfo@vub.ac.be
Deze publicatie kwam tot stand met de steun van de Vlaamse Gemeenschap, Programma Steunpunten voor Beleidsrelevant Onderzoek.
In deze publicatie wordt de mening van de auteur weergegeven en niet die van de Vlaamse overheid. De Vlaamse overheid is niet aansprakelijk voor het gebruik dat kan worden gemaakt van de opgenomen gegevens.
D/2016/4718/typ het depotnummer – ISBN typ het ISBN nummer © 2016 STEUNPUNT STUDIE- EN SCHOOLLOOPBANEN
p.a. Secretariaat Steunpunt Studie- en Schoolloopbanen HIVA - Onderzoeksinstituut voor Arbeid en Samenleving Parkstraat 47 bus 5300, BE 3000 Leuven
Inhoud
Inhoud v
Beleidssamenvatting 1 Opportunity or barrier? The effect of the two-cycle Bologna structure on social inequalities in the
tertiary educational system in Flanders 5
1 Abstract 5
2 Introduction 7
3 Institutional background 9 4 Theoretical framework 13
4.1 Social differences in educational choice 13
5 Hypotheses 17 5.1 Cost 17 5.2 Return 18 5.3 Probability of success 19 6 Data 21 6.1 Dependent variable 21
6.2 Independent variables: background characteristics 23
6.3 Grouping level: field of study of the bachelor programme 24 6.4 Independent variables: labour market opportunities of the bachelor degree 26
7 Analyses 29
7.1 Transition to a master programme for professional bachelor graduates (PBA) 31 7.2 Transition to a master programme for academic bachelor graduates (ABA) 33 7.3 No effect of labour market opportunities? Sensitivity analyses 35
8 Discussion 37
Beleidssamenvatting
In deze paper gaan we na welke studenten opteren om na het behalen van hun bachelordiploma door te stromen naar een masteropleiding eerder dan uit te stromen naar de arbeidsmarkt. De doorstroom van een bachelor- naar een masteropleiding is in twee opzichten beleidsrelevant. Ingevolge de Bolognahervormingen dienen alle eerste cyclusopleidingen in het hoger onderwijs aan studenten kansen te geven op een volwaardige arbeidsmarktparticipatie. Om die reden kunnen vragen gesteld worden bij de erg lage uitstroom uit het hoger onderwijs van studenten die een academisch bachelordiploma behalen in het Vlaams onderwijssysteem. Anderzijds dienen alle eerste cyclusopleidingen eveneens de mogelijkheid te geven aan studenten om door te stromen naar een tweede cyclusopleiding. In dat opzicht is het de moeite na te gaan in welke mate die optie ook effectief blijkt genomen te worden door studenten die een diploma behalen van een professionele bachelor. Voor deze laatste groep blijkt er over de tijd sprake van een duidelijke toename van de doorstroom naar een opleiding die voorbereidt of verder toegang geeft tot het inschrijven in een masteropleiding. De focus van de analyses van de doorstroomkansen van een bachelor- naar een masteropleiding is tweeërlei, enerzijds bestuderen we de rol van een aantal achtergrondkenmerken en anderzijds gaan we in op de rol van de arbeidsmarktkansen die specifieke bacheloropleidingen blijken te bieden. We gebruiken data van alle inschrijvingen van studenten in het Vlaamse hoger onderwijs. In het bijzonder bekijken we het vervolgtraject van studenten die hun bachelordiploma behaalden in de academiejaren 2006-2007 tot en met 2010-2011. De analyses hebben betrekking op ruim 155.000 bachelorgediplomeerden, met een iets grotere groep van afgestudeerden uit een professionele bachelor (57%) dan van een academische bachelor (43%). Voor onze analyses gebruiken we bovendien informatie over de arbeidsmarktkansen van de verschillende richtingen in het hoger onderwijs. Daarvoor doen we beroep op gegevens van het pilootproject rond schoolverlaters van de Vlaamse Steunpunten Studie- en Schoolloopbanen (SSL) en Werk en Sociale Economie (WSE), waarbij data uit verschillende administratieve bronnen werden gekoppeld.
Uitgaand van de literatuur naar sociale ongelijkheid in onderwijskeuzes en in het bijzonder het daarin gehanteerde individueel keuzemodel, beschouwen we de beslissing om verder te studeren als een investering die studenten en hun sociale omgeving maken op basis van de verwachtte kosten, verwachtte opbrengst en verwachtte slaagkans van de verdere studie, gemodereerd door de wijze waarop het onderwijssysteem is georganiseerd.
De multilevel analyses bevestigen dat de structuur van het hoger onderwijssysteem, met name de twee types bacheloropleidingen, de doorstroom van bachelorstudenten naar een masteropleiding sterk beïnvloedt. Met een doorstroompercentage van meer dan 97% is de kans om verder te gaan studeren bij studenten met een diploma van een academische bachelor – in de eerste plaats op
Opportunity or barrier? | 2
doorstroom naar de master – veel groter dan van studenten met een diploma van een professionele bachelor (19%) – meer georiënteerd op uitstroom naar de arbeidsmarkt. De beslissing om aan een academische bachelor te beginnen wordt zo quasi meteen een beslissing om een masteropleiding te volgen (mits met succes afgerond). De keuzes die afgestudeerden van een professionele bacheloropleiding maken zijn daarentegen minder homogeen. Hoewel de meerderheid van hen uitstroomt naar de arbeidsmarkt, is sprake van een toename in het aantal inschrijvingen in een programma voorbereidend op een masteropleiding bij afgestudeerden van een professionele bacheloropleiding. Zo lijken de Bologna hervormingen de toegankelijkheid van een tweede cyclus opleiding te hebben verbeterd voor de studenten van een professionele bachelor. Gezien de quasi universele doorstroom naar een master bij de studenten van een academische bachelor, lijken de Bologna hervormingen er daarentegen niet in geslaagd om de perceptie te veranderen dat dit het eerste cyclus niveau geschikt is om zich mee op de arbeidsmarkt te begeven.
Omdat verder studeren toch een aanzienlijke financiële investering vraagt, zij het dat voornamelijk de indirecte kosten eerder dan de directe kosten doorwegen, verwachtten we dat studenten met beperkte financiële middelen minder gemakkelijk de keuze maken om door te stromen naar een masteropleiding. Die verwachting kwam evenwel niet uit, immers studenten die een studiebeurs ontvingen in het jaar waarin ze hun bachelordiploma behaalden blijken niet minder door te stromen naar een masteropleiding dan studenten zonder studiebeurs. Vanuit een academische bacheloropleiding, blijken beursstudenten zelfs vaker door te stromen dan niet-beursstudenten, al moet deze bevinding voorzichtig geïnterpreteerd worden, gezien de erg beperkte en dus selecte groep van studenten met een academisch bachelordiploma die niet doorstroomt naar een masteropleiding. In ieder geval blijken beperkte financiële middelen geen beperkend element in de beslissing om de studies na een bachelor- verder te zetten naar een masteropleiding. Deze bevinding kan positief geëvalueerd worden in termen van de Bologna doelstelling om de kansen van sociaal zwakkere leerlingen te verbreden, al is het wel zo dat de doorstroom van kansengroepen naar het hoger onderwijs beperkter is.
Een verwachting die deels wel uitkwam is dat studenten met een niet-Belgische nationaliteit minder van een bachelor- naar een masteropleiding doorstromen. Maar opnieuw blijkt dit niet zo te zijn bij studenten met een professioneel bachelordiploma, enkel bij de afgestudeerden van een academische bacheloropleiding. Mogelijk gaan buitenlandse studenten na het afronden van een academische bacheloropleiding in hun eigen land verder studeren. Blijft dat we dit niet vinden voor de buitenlandse studenten die een professionele bachelordiploma behaalden. Dat zou er op kunnen wijzen dat een diploma van een academische bachelor meer wordt gewaardeerd door buitenlandse dan Vlaamse studenten, mogelijk omdat in hun land van herkomst de perceptie van de bruikbaarheid van dit (in Vlaanderen relatief nieuwe) studieniveau op de arbeidsmarkt veel gunstiger is.
Verder blijken mannen meer dan vrouwen verder te gaan studeren nadat ze hun bachelordiploma behaalden, zowel vanuit een academische als een professionele bacheloropleiding. Ook maakt de leeftijd waarop de student zijn of haar bachelordiploma behaalt een duidelijk verschil: studenten die in de loop van hun voorafgaand onderwijstraject (in het hoger onderwijs of al daarvoor)
studievertraging opliepen, maken de transitie naar een masteropleiding beduidend minder vaak, opnieuw gaat dit op voor beide types bacheloropleidingen. Dit kan duiden op de rol van studieprestaties en hoe gemakkelijk of moeilijk het onderwijstraject verliep in de keuze om al dan niet door te stromen na een bachelor. Tevens kan het te maken hebben met omstandigheden en verwachtingen die te maken hebben met de levensloop, als studenten met leeftijdsvertraging eerder in een andere levensfase terecht komen.
Tenslotte vonden we geen enkele aanwijzing voor de rol van de arbeidsmarktperspectieven die de studie in het hoger onderwijs biedt. Noch van de tewerkstellingsgraad noch van het loonniveau van de studierichting blijkt een statistisch significant effect op de doorstroom van een bachelor- naar een masteropleiding. Studenten lijken bijgevolg de economische kansen van hun bachelordiploma niet mee in overweging te nemen op het ogenblik dat ze moeten beslissen om door te gaan naar een masteropleiding dan wel om in te treden op de arbeidsmarkt. Die conclusie veronderstelt evenwel dat studenten weten wat hun diploma waard is op de arbeidsmarkt. Een alternatieve verklaring zou kunnen zijn dat studenten de economische uitkomsten van hun diploma toch belangrijk vinden, maar dat ze niet voldoende en correct geïnformeerd zijn over de waarde van hun diploma op de arbeidsmarkt in termen van tewerkstellingskansen en loonvooruitzichten (Wiswall & Zafar, 2013). Een beperking van de analyses waarover in dit rapport wordt gerapporteerd is evenwel dat slechts een beperkt aantal verklarende factoren mee in rekening worden gebracht. Door gebruik te maken van externe gegevens over het arbeidsmarktsucces van afgestudeerden in specifieke studierichtingen, operationaliseren we hoe verschillen tussen verschillende studierichtingen een rol kunnen spelen bij de keuze om al dan niet door te stromen naar een masteropleiding. Deze uitbreiding van de data is mogelijk omdat we ze doen op het niveau van de opleidingen. Op het niveau van de studenten evenwel, is het aantal indicatoren van sociale achtergrond bijvoorbeeld erg beperkt, net zoals de informatie over de voorgaande schoolloopbaan, in het bijzonder in het secundair onderwijs. Met data van de inschrijvingen in het hoger onderwijs van recentere academiejaren, zou ook aan deze beperking in grote mate tegemoet gekomen kunnen worden, aangezien voor bachelorstudenten uit die recentere academiejaren een koppeling kan worden gemaakt met de administratieve gegevens over het secundair onderwijs, en zo niet alleen informatie over hun trajecten in het secundair onderwijs maar tevens meer indicatoren over hun sociaal-economische context beschikbaar zouden zijn.
Opportunity or barrier? The effect of the two-cycle
Bologna structure on social inequalities in the
tertiary educational system in Flanders
11 Abstract
As stipulated by the Bologna Declaration of 1999, the Bologna structure should offer first-cycle (bachelor) graduates the opportunity (1) to continue their educational career into the second-cycle (master), or (2) enter the labour market with the attained degree (Eurydice, 2012). In this study, we take a closer look at the post-bachelor options in the Bologna structure taken by students in Flanders. Using administrative data on all higher education enrolments, we conduct multilevel analyses to explain who decides to progress towards a master programme, and who decides to leave education in order to enter the labour market. We find very large differences between the two types of bachelor programmes that are offered in the Flemish higher educational system, with an almost universal continuation to a master programme for graduates from an academic bachelor, and much more diversity among the graduates from a professional bachelor. The results also show some socio-demographic differences, with higher continuation rates for men than women and diminishing continuation rates with increasing age of obtaining the bachelor degree. The financial situation of the students and their nationality on the other hand do not have consistent effects. Finally, we do not find any indications that the labour market perspectives of the field of study matter.
1 A precursor of this paper was presented at the Transitions in Youth Conference, 2-5 September 2015, Brno (Glorieux, Laurijssen & Magits: Opportunity or threshold: the effect of the two-cycle Bologna structure on social inequalities in the tertiary educational system of Flanders).
2 Introduction
The start of the Bologna Process has recently passed its 16th anniversary and during that period, it has impressively and fundamentally reshaped tertiary education in Europe. One of the most notable characteristics of the harmonization of the educational systems of the European Higher Education Area (EHEA) is the introduction of a two-cycle degree system2 in all of the now 49 participating countries.
Especially the relevance for the labour market of the qualifications obtained with each cycle seems to be one of the major concerns of the Bologna Process. The first objective that the Bologna Declaration (1999) discusses is the “adoption of a system of easily readable and comparable degrees […] in order to promote European citizens employability” and continues with the necessity that the degree of every cycle, including the first one, should be “[…] relevant to the labour market as an appropriate level of qualification”. Later agreements likewise stress that the Bologna Structure should “facilitate students’ access to the European labour market” (Prague Communiqué, 2001:2), make students “achieve their full potential for European identity, citizenship and employability” (Berlin Communiqué, 2003:6), and that “higher education should equip students with the advanced knowledge, skills and competences they need throughout their professional lives [since] employability empowers the individual to fully seize the opportunities in changing labour markets” (Leuven and Louvain-la-Neuve Communiqué, 2009:3).
Despite these explicitly stated employability objectives, however, research from the European Commission (Eurydice, 2012:39) indicates that the transfer of first-cycle graduates into the labour market is showing difficulties in a considerable amount of countries. In a number of countries, entering the labour market with ‘only’ a first-cycle (Bachelor) degree is very unpopular, with several educational systems even reporting enrolment rates into the second-cycle (Master) of 75% or more (Eurydice, 2012:38). For some countries, the high continuation rate into the second cycle is explained by limited employment opportunities caused by the economic crisis (for instance Italy). In others, a possible explanation for elevated second cycle enrolment rates could be a perception that a first cycle degree is not properly accepted by the labour market (Croatia). In the same vein, some countries still need to adjust to the new Bologna system. Although a majority of the participating states in the EHEA already had a two-cycle degree system in place, this was not the case for instance in Austria, Belgium, Croatia, Italy and Portugal (Neugebauer, 2014:7; Eurydice, 2012:39; Di Pietro, 2012). In these countries, the two-cycle degree system replaced a long-standing one-cycle structure, in which entering the labour market after a “first stage” of the programme was far less evident.
2 In recent years, the doctoral degree was introduced as the third cycle of the Bologna structure. Since this third cycle was developed later and this cycle is not the focus of this research, we continue to define the core of the Bologna degree structure as a two-cycle structure (European University Association, 2008; Neugebauer, 2014:1).
Opportunity or barrier? | 8
Surprisingly, only a limited amount of research has empirically analysed the pathways of students after first cycle graduation. The question remains whether entering the labour market can be considered a real option for Bachelor’s graduates. Secondly, it is not unlikely that students from different social backgrounds would tend to take different pathways after first cycle graduation, with different socio-economic outcomes as a result. However, little is known thus far about the effect of the two-cycle Bologna structure on social inequalities. In this study, we analyse the decisions of Bachelor’s graduates in the tertiary educational system of Flanders, the Dutch-speaking part of Belgium3. By doing so, we
add to the research on the transition from a one-cycle tertiary educational structure towards the two-cycle Bologna structure, and to the literature on educational opportunities in tertiary education in general.
3 In Belgium, the tertiary educational system is organized and managed separately by the different language communities (cf. infra).
3 Institutional background
Since 1988, the Belgian federal government has transferred all responsibilities regarding education to the three language communities of the country. This means that there are three distinct (but often similar) educational structures in Belgium. In this study we focus on the tertiary educational system of the Flemish Community4. Although many (international) articles – including several Bologna reports –
(Neugebauer, 2014; Eurydice, 2010 & 2012) discuss the Flemish educational system before the Bologna reforms as a “single cycle system”, in which leaving the educational programme after the “first episode” was not possible or highly unusual, the subject of this research requires us to be somewhat more specific.
The Flemish Community of Belgium organizes its tertiary education according to two types of institutions; universities (universiteiten) and colleges (hogescholen). Before the Bologna reforms, Flemish universities offered programmes of minimum 4 years after which students obtained a “licentiaat”; a degree that is now corresponding to a second-cycle (master) degree. These university study programmes also offered an intermediate degree after the first 2 years – called “kandidaat” – that acted as a prerequisite to continue university studies but – unlike a first cycle (bachelor) degree – was not intended to be relevant for the labour market and not considered an equivalent to a first cycle (academic bachelor, cf. infra) degree (Tauch & Rauhvargers, 2002).
Colleges offered 2 kinds of programmes, oriented more towards the labour market. First, there were 4 year long programmes called Hoger Onderwijs Lange Type (HOLT), which now have been changed into second-cycle (master) degrees. Next to the HOLT-programme, colleges also offered shorter programmes of 3 years, called Hoger Onderwijs Korte Type (HOKT) (Belet et al., 2001:21; Belgische Federale Overheidsdiensten, 2015), which are now equivalent to a first cycle (professional bachelor, cf. infra) degree.
It is therefore inaccurate to define the Flemish system of pre-Bologna tertiary education as “single cycle”, since the Flemish Community did have experience with what we would now call a “first cycle programme”. However, these degrees were not linked in the sense that after a HOKT-programme students could easily progress towards a HOLT- or University programme. The introduction of the Bologna process expanded the concept of first cycle degrees towards all tertiary study programmes and, at the same time, specified that all first cycle degrees must have applicable value on the labour market.
Flanders implemented the two-cycle degree structure of the Bologna Process in the academic year of 2004-2005. The first-cycle (bachelor) consists of 180 ECTS-credits or “studiepunten”, while the
4 For a more comprehensive overview of the Flemish educational system we refer to Flemish Ministry of Education and Training (2009).
Opportunity or barrier? | 10
cycle (master) programme holds a minimum of 60 ECTS-credits (Glorieux e.a., 2012:18-21). An important feature of the tertiary education in Flanders after the Bologna process is the existence of two kinds of first-cycle-programmes, each orientated towards a specific trajectory.
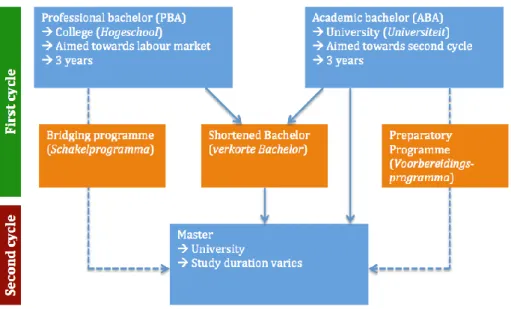
Academic bachelors (academische bachelor, ABA) are offered by universities.5 They orientate their
students towards further education, and allow for direct access to at least one second-cycle programme. For students who wish to enter a second cycle programme that has limited connection substantively with their academic bachelor degree, “shortened bachelors” (verkorte bachelor) or “preparatory programmes” (voorbereidingsprogramma) are offered so that they can catch up with the subject. Although the academic orientation of these bachelor programmes does not preclude entry into the labour market6, reports show that leaving the educational system is highly unpopular among
ABA-graduates; only 2.96% of the Flemish school-leavers are ABA-graduates (Glorieux et al., 2012:19; VDAB, 2012).
Figure 1: Structure of Flemish higher educational system
The professional bachelor (professionele bachelor or PBA) is more practice-oriented and offered by ‘hogescholen’ or colleges. PBA-studies prepare their graduates for the labour market, and do not offer direct access into the second-cycle. However, the post-Bologna tertiary educational system of Flanders does provide a variety of short-cycle programmes that offer these first-cycle graduates access to further education. Graduates with a PBA-degree who wish to continue towards the second-cycle can follow a “shortened bachelor” (verkorte bachelor) or a “bridging programme” (schakelprogramma),
5 Initially, the HOLT-programmes at colleges were also transformed into academic bachelors. In 2013, however, these programmes have been integrated into the universities (the so-called academisering).
6 In fact, in 2014, next to the transfer to a master programme, the transfer to the labour market was added as objective for the academic bachelors, in Flemish law (which changed the Decreet betreffende de herstructurering van het hoger onderwijs in Vlaanderen of 2003).
which in turn give access to second-cycle studies. Reports from the Flemish Ministry of Education and Training (2014:4) show that graduates are making relatively good use of these programmes; in the academic years 2013-2014 and 2014-2015, the number of enrolments in a bridging program is almost 7% of the enrolments in a PBA-study. Considering that students with a model trajectory have three enrolments in a PBA-study, the number of students that decide to continue their education by entering a bridging program could be about one in five, making (the path towards) the second-cycle a realistic option for the PBA-program. But as some students can have multiple successive enrolments in a bridging program before completing the program, this number is an overestimation. Running ahead of the analyses we conduct in this paper, in our data 16,8% of the students who obtain a degree of a professional bachelor enrol into a bridging program in the same or the next academic year (table 1
4 Theoretical framework
What drives some bachelor graduates to enter the labour market and thereby (for the moment) forfeiting the possible rewards of a subsequent degree, and others to pursue further education instead of gaining a wage? Although there is a vast literature on social inequalities at educational transitions, the educational choice made at this stage of the post-Bologna tertiary educational system is (yet) discussed much less. An overview of this literature, nonetheless, offers a good starting point to formulate our theoretical expectations with regard to social differences in this post-bachelor educational transition.
4.1 Social differences in educational choice
In order to explain social differences in educational outcomes, the literature often relies on the individual decision model developed by Boudon (1974), and further expanded by Breen & Goldthorpe (1997) and Erikson & Jonsson (1996). This model considers an (educational) choice as the combined result of three factors; (1) the expected return on investment, (2) the expected cost and (3) the expected probability of success.
With regard to educational opportunities, the expected return of further (higher) education depends on how useful students and their social environment (notably their parents) consider the successful completion of the desired educational programme. Not all students value the (expected) returns the same way. According to Breen & Goldthorpe (1997), expected returns are strongly linked with the social background of the students because of what they define as “Relative Risk Aversion” or RRA. Central assumption of the RRA hypothesis is that students - and people in general – do not aim to get as high on the social ladder as possible. Instead, their goal is to avoid downward mobility, using their parent’s social position as reference. Obtaining a certain educational level is therefore less necessary for students from a low educated background than for students who have highly educated parents, as it implies a lower probability of downward social mobility for them. For students from a low educated social environment, obtaining a (higher) tertiary degree does not hold the same value or, more precisely, not obtaining a tertiary degree does not imply the same social penalty.
Similarly, the (expected) costs of pursuing further education do not put the same financial strains on every household. It is important here to specify that the cost of continuing tertiary education is not limited to the direct cost of the registration fee, but also includes indirect costs of study material, housing and/or transportation, as well as the opportunity cost of not gaining a (fulltime) wage. For students with limited financial resources, the decision to continue further education will entail a heavier financial burden than for those who can rely on sufficient funding, therefore also limiting their continuation from a bachelor degree towards a master programme.
Opportunity or barrier? | 14
Finally, students from different social backgrounds also differ in the assessment of their chances of
success. On the one hand, this is related to differences in previous educational achievements and
experiences. Because of their more vulnerable position, students from less privileged backgrounds tend to perform less good on tests and other evaluations, negatively impacting their probability of successful completion of an additional educational programme (Tolsma, Need & De Jong, 2010). On top of that, studies show that students from lower social backgrounds systematically underestimate their probability of educational success compared to students from more privileged backgrounds, even when both show similar educational achievements (Morgan, 2005). Furthermore, students from less privileged backgrounds seem to be less effective in assessing the institutional context of the programme at hand, rendering them less informed about the effect of a particular educational pathway on future opportunities in and outside the educational system (Pfeffer, 2008).
Using the individual decision model, an impressive amount of studies provides evidence of social inequalities when it comes to enrolment into the subsequent educational level in non-compulsory education (some recommendations: Spruyt & Laurijssen, 2011; Lucas, 2001; Pustjens e.a. 2004; Breen & Jonsson, 2000; Cappelari & Lucifora, 2009; Di Pietro, 2012; Neugebauer, 2014; Jackson, 2013; Need & De Jong, 2000; Tolsma, Need & De Jong, 2010). However, the vast majority of the research discusses educational transitions within or after secondary education or educational transitions in (mostly Anglo-Saxon) higher educational systems not implemented according to the Bologna structure.
Social inequalities in educational decisions made within the Bologna system are still underresearched, but results suggest a picture at odds with the goal of educational inclusiveness formulated in the Bologna process. Two studies on social inequalities during the post-bachelor transition of its Bologna structure in Germany (Auspurg & Hinz, 2011; Neugebauer, 2014) concluded that the adoption of the two-cycle Bologna structure has had a negative effect on the educational opportunities of students from low-educated backgrounds, by diverting them towards less rewarding positions on the labour market. In Hungary too, it was concluded that the transition to a master programme is more likely for students with higher qualified parents (at the individual level) (Veroszta, 2013) and for students from bachelor programmes with a student population from a more favourable social background (measured at the faculty level) (Nyüsti & Veroszta, 2015).
In this paper we wish to extend the literature on post-bachelor choices in the Bologna structure by analysing the transition rates of different categories of students with a bachelor degree to enrolment into a master programme or entering the labour market in Flanders, the Dutch-speaking part of Belgium. In the next paragraph we hypothesise that social background affects this post-bachelor educational decision, implying that the two-cycle structure of the Bologna programme could diminish the educational opportunities of people from less privileged backgrounds, instead of improving them, in accordance with the results of the studies cited above.
In addition, we will take into account the labour market opportunities of different kinds of bachelor degrees explicitly. By considering the role of employability, we expand on the factors that are probably taken into account by students when they evaluate the returns of continuing further education but
that studies into educational choice do not commonly include. Furthermore, by considering the employment prospects of different fields of study, we are acknowledging the heterogeneity in higher education programs, and its potential in explaining differences in further educational decision making.
5 Hypotheses
The previously discussed theoretical framework based on the individual decision model of Boudon (1974), Breen & Goldthorpe (1997) and Erikson & Jonsson (1996), leads us to the general expectation to find social inequalities in the transition rate from a bachelor to a master programme in the tertiary educational system of Flanders. We specify this main hypothesis further below, by decomposing the assumption of this model that students and their social environment consider the enrolment into an educational programme as a potential investment, of which the commitment depends on the expectations of (1) the cost, (2) the return and (3) the probability of successfully obtaining the degree. The goal of this investment is the avoidance of downward mobility in comparison to the social status of the student’s parents. In addition to these assumptions we also articulate our expectations with regard to differences between different kinds of studies, in particular, as they are associated with varying levels of employability.
5.1 Cost
When considering the direct cost of higher education, it has to be noted that in Flanders tertiary education is relatively inexpensive. Tuition fees only cover about 3% of total costs for the organisation of higher education for Flemish government (Cantillon et al. 2006). In both the first and the second cycle, students annually pay an amount of “invariable tuition fees” (‘vast studiegeld’) plus an additional variable sum (‘variabel studiegeld’) depending on the amount of credit points (ECTS) that the student takes up. In addition, the amounts of these two components of the tuition fee also depend on the type of contract and whether or not the student receives a study grant7 (Vlaams Ministerie voor Onderwijs
en Vorming, 2015a). For full-time enrolment (60 ECTS) with a credit or diploma contract in a bachelor or master programme, the total amount of tuition fees to be paid amounts to 890€ for students without a study grant and 105€ for students with a study grant (for the year 2015-20168).9
However, the cost of education is more than the tuition fee. Entering an educational programme also includes paying for educational equipment, transportation, student housing, etc. Probably because of this and the fact that students with a study grant get a large reduction, the tuition fees only marginally explain the lower enrolment rates in higher education of students from lower SES in Flanders (Declercq & Verboven, 2014)10.
7 The eligibility for a study grant mainly depends on household income.
8 The tuition fees mentioned here date from after they were increased substantially; before, students without study grants needed to pay only 620€; for students with study grants the amount has not changed (except for financial inflation adaptation).
9 The tuition fees of further studies in higher education (Bachelor after bachelor, Master after master) are higher (Flemish Ministry of Education and Training, 2015a).
10 More important factors according to the study of Declercq & Verboven (2014) are the previous schooling and “preferences” or expectations about the returns or higher indirect costs.
Opportunity or barrier? | 18
Since students take all of these study-related costs into consideration, however, we expect that
bachelor graduates with limited financial resources will be less inclined to enrol into a master programme.
In addition to the direct and indirect costs of education, there is also the opportunity cost of forfeiting the wage the student could have gained by entering the labour market. This would imply that bachelor graduates with a high-profile degree with good chances for quick employment and a high paying job would be less inclined to continue their education than graduates of bachelor programmes for which the employment opportunities are less optimistic. Correspondingly, we hypothesise that entering a
master programme is more attractive for students who obtained a bachelor degree that offers limited opportunities on the labour market.
5.2 Return
Next to the cost, the decision to continue from a bachelor to a master programme also depends on what could be gained by achieving this higher degree or, more specifically, how severe the penalty of downward social mobility could be. For students from less privileged background, the goal of gaining a similar or higher social position than their parents could well be achieved by graduating with a bachelor degree, therefore making the continuation of their education after having obtained a bachelor degree already less of a necessity, while bachelor graduates from more privileged
backgrounds will show a higher transition rate to a master programme.
In addition, what could be gained from continuing to a master programme most likely also depends on the perceived status of the obtained bachelor degree. If employment prospects are already good, there is less of a need to pursue further education. Different studies have already concluded that labour market perspectives are an important element in the decision to continue further studies after having completed a bachelor degree. A study in Hungary concluded that the labour market opportunities of the graduates of bachelor programmes influenced the continuation of studies on a master level (Nyüsti & Veroszta, 2015). More specifically, higher continuation rates to a master were found for students in faculties where more professional work is performed during the studies, so when students experience that a higher rate of their fellow students are capable of working in professional positions before graduation (Nyüsti & Veroszta, 2015), even though another study reported that having worked during the bachelor (at the individual level) diminished the odds of progressing towards a master programme in Hungary (Veroszta, 2013).
One of the most important motives that bachelor graduates in Germany state for continuing to a master programme, is that they feel that they are not enough prepared for the labour market and want to enhance their opportunities on the labour market (Erl, 2013). This perception is mirrored by employers in Germany who are reluctant to hire bachelor graduates from universities because they feel they have not acquired the same competency level as master graduates to transition into the labour market (Erl, 2013).
This employers’ perspective however, is not present in all European countries. Humburg et al. (2013) researched employers’ preferences for bachelor versus master graduates in nine European countries looking at the odds of getting invited for a job interview using hypothetical curricula. In general, they found a slight preference of graduates with a master’s degree over graduates with a bachelor degree. The authors find this preference for master graduates, which is “against the rational of the Bologna reform” (p.33) only in five of the nine countries that they studied, with two other countries with no significant difference and another two countries where bachelor graduates are preferred rather than master graduates. The advantage of graduates with a master degree according to the employers is that they need less training to become productive workers because of their higher level of specialisation, maturity and independence. On the other hand, bachelor graduates, because of being younger and less specialised, are more receptive to organisational culture and should integrate more easily into the organisation.
So, again, we hypothesise that entering a master programme is more attractive for students who
obtained a bachelor degree that offers limited opportunities on the labour market.
5.3 Probability of success
We also need to take into account the institutional framework of the tertiary educational system of Flanders. As discussed in section two, the Flemish first-cycle in higher education can be divided in two types of programmes - the labour market-oriented PBA and the second cycle-oriented ABA - that do not offer their graduates the same access possibilities towards the second cycle due to several mechanisms.
First, the Flemish educational structure requires PBA-graduates to enter an intermediate programme before they can enrol in a second cycle programme. This additional effort makes continuing their education less attractive for PBA-graduates than for ABA-graduates, who have immediate access to at least one second-cycle programme.
Secondly, the PBA-programme with its more practical orientation has proven to be more popular among students from less advantaged backgrounds (in terms of SES and ethnicity but also of previous type of schooling in secondary education; Glorieux, Laurijssen & Sobczyk, 2014), all factors associated with lower (expectations of) educational success, which subsequently diminishes these students’ probability to continue further education.
Finally, due to the orientation of the PBA-programme towards the labour market and its similarity with the pre-Bologna HOKT-programme (which in turn offers the labour market some familiarity with the content of this degree), it is likely that a PBA-degree offers better prospects on the labour market than an ABA-degree (much in the same way as is found for bachelor graduates from Fachhochschule versus from universities in Germany; Erl, 2013). We therefore expect that the type of bachelor programme
6 Data
To test these hypotheses we use data of the Flemish Ministry of Education and Training on all of the tertiary education enrolments of students. We selected the students who obtained their bachelor diploma between the academic years 2006-2007 and 2010-2011, resulting in a sample of 155.923 first-cycle graduates, of which 89.545 were involved in a PBA-programme (57.4%) and 66.378 (42.6%) in the ABA-programme.
List wise deletion of missing values on explanatory variables resulted in a final sample for analysis of 155.821 (99,93%). We supplied these data with information on the labour market prospects of different bachelor programmes, by using data from a pilot project of the Flemish Policy Support Centres for Study and School Careers and Work and Social Economy.
6.1 Dependent variable
We looked up in the data whether these bachelor graduates were enrolled in a master programme or a programme preparing for a master programme in the same academic year or the one following the year in which they obtained their bachelor diploma. Because we want to know what explains students’ initial choice best, we only consider those who continue their education without interruption. This implies that transition probabilities are underestimated because students can decide to pursue further education after one or more years. Master programmes or programmes preparing for participation in a master programme that we selected are: a master, a master after a professional bachelor, a bridging programme, a preparatory programme, a licentie or equivalent (dating from before the Bologna reforms). In addition, we selected enrolments in an academic bachelor for students who graduated in a professional bachelor, and enrolments in an academic bachelor in another field of study11 for
students who graduated in an academic bachelor.
If there is no enrolment of the student in any of these kinds of programmes in the same or next academic year, we presume that the student left higher education for the labour market. This probably is not the case for smaller numbers of graduates, as our data only relate to higher education enrolments in Flanders, so no data is available about which students might go study abroad. Also, some school leavers perhaps do not intend to find a job and thus are not really entering the labour market. In addition, for a number of bachelor graduates we did find higher education enrolments but in other programmes, mainly other first cycle programmes – most commonly professional bachelors and bachelor after bachelorprogrammes among the graduates from a professional bachelor (see also table 1).
Opportunity or barrier? | 22
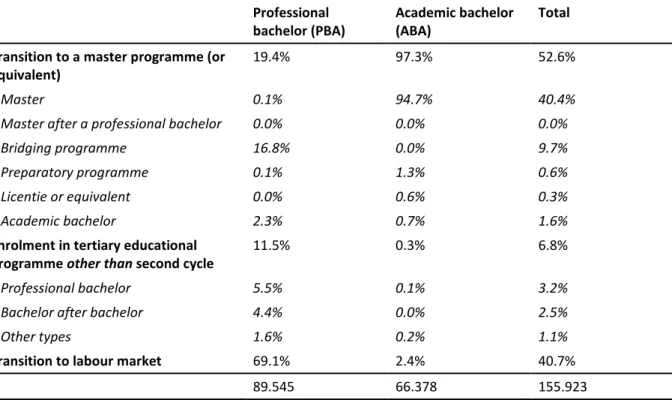
Table 1: Destination after bachelor graduation, according to the type of bachelor diploma
Professional bachelor (PBA)
Academic bachelor (ABA)
Total Transition to a master programme (or
equivalent)
19.4% 97.3% 52.6%
Master 0.1% 94.7% 40.4%
Master after a professional bachelor 0.0% 0.0% 0.0%
Bridging programme 16.8% 0.0% 9.7%
Preparatory programme 0.1% 1.3% 0.6%
Licentie or equivalent 0.0% 0.6% 0.3%
Academic bachelor 2.3% 0.7% 1.6%
Enrolment in tertiary educational programme other than second cycle
11.5% 0.3% 6.8%
Professional bachelor 5.5% 0.1% 3.2%
Bachelor after bachelor 4.4% 0.0% 2.5%
Other types 1.6% 0.2% 1.1%
Transition to labour market 69.1% 2.4% 40.7%
N 89.545 66.378 155.923
Note: numbers shown for the specific programmes are an underestimation, because students can have multiple enrolments in different types of programmes. Here the first or most important enrolment is selected. For the sake of our analyses, enrolments in a master programme or equivalent take precedence over enrolments in other tertiairy educational programmes.
When comparing the continuation rates to a master programme (or equivalent) of bachelor graduates in Flanders, our data confirm the large differences documented in previous reports (Flemish Ministry of Education and Training, 2014; Eurydice 2013:39) between ABA and PBA graduates (see table 1). Students with an ABA-degree enter the second cycle en masse. With more than 97% of the graduates entering a master programme, options other than continuing towards the second cycle prove to be not popular at all. Only 2.4% decide to enter the labour market, while 0.3% of the ABA-graduates enrol in other forms of tertiary education.
For the PBA-graduates, the picture is quite different: most graduates seem to follow the path towards the labour market that their programme intends; almost 70% of the PBA-students decide to enter the labour market after graduation.
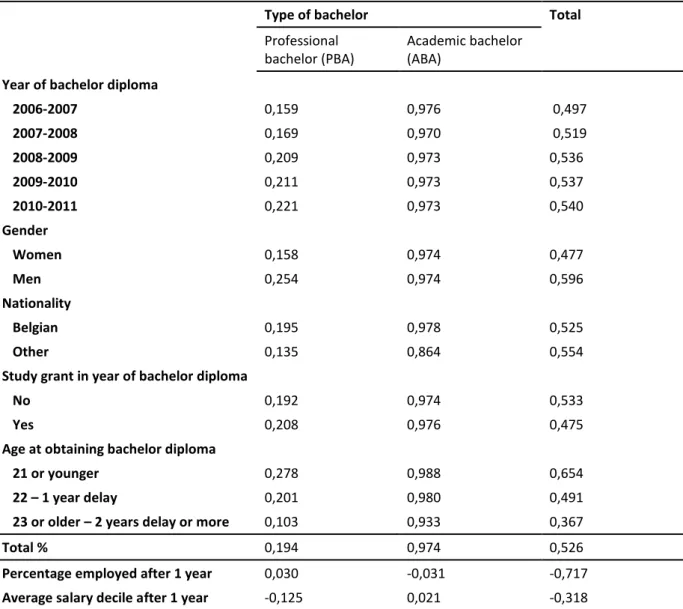
Nonetheless, the situation is not as clear-cut as with the ABA-graduates. Almost one third of the PBA-graduates remain in the educational system, either to pursue a second cycle degree (19,0%) or other kinds of education (11.5%). In addition, table 2 shows that continuing towards the second cycle has become more popular over the years for this group of students; in 2006-2007 only 15.9% of the PBA-graduates enrolled in (a programme towards) the second-cycle, while in 2010-2011 this number has risen to 22.1%, implying that the intermediate programmes are being put to good use. For the ABA-graduates, on the other hand, there has been no substantial change during this time period in the transition rates to a master programme.
6.2 Independent variables: background characteristics
Table 2: Transition rates to a master programme (or equivalent) for bachelor graduates, for each of the explanatory variables (proportions or correlations)
Type of bachelor Total
Professional bachelor (PBA)
Academic bachelor (ABA)
Year of bachelor diploma
2006-2007 0,159 0,976 0,497 2007-2008 0,169 0,970 0,519 2008-2009 0,209 0,973 0,536 2009-2010 0,211 0,973 0,537 2010-2011 0,221 0,973 0,540 Gender Women 0,158 0,974 0,477 Men 0,254 0,974 0,596 Nationality Belgian 0,195 0,978 0,525 Other 0,135 0,864 0,554
Study grant in year of bachelor diploma
No 0,192 0,974 0,533
Yes 0,208 0,976 0,475
Age at obtaining bachelor diploma
21 or younger 0,278 0,988 0,654
22 – 1 year delay 0,201 0,980 0,491
23 or older – 2 years delay or more 0,103 0,933 0,367
Total % 0,194 0,974 0,526
Percentage employed after 1 year 0,030 -0,031 -0,717
Average salary decile after 1 year -0,125 0,021 -0,318
Note: Correlation between the two labour market perspectives indicators: 0,275; 0,641; 0,475. To measure the financial resources students can rely upon, we formed a dummy-variable indicating whether or not a student had received a study grant from the Flemish government – which depends on the income of the student or that of his parents/caretakers – in the year in which they obtained their bachelor degree. Eligibility for receiving a study grant from the Flemish government does not depend on (demonstrated or future) academic abilities12.
Some socio-demographic variables will also be included in the analyses. With regard to gender, men more often than women make the transition from a bachelor to a master programme (see table 2), although there is no difference according to gender for students graduating from an academic
12 For the requirements of obtaining financial assistance for students in Flemish higher education, see Flemish Ministry of Education and Training (2015b).
Opportunity or barrier? | 24
bachelor. The same goes for students with the Belgian nationality as compared with students with a non-Belgian nationality, but in this case the difference is larger for students with an academic bachelor degree than for professional bachelor students. Finally, we also include the age at obtaining the bachelor degree, as a measure for study delay; with older students typically less prone to continue to a master programme after having obtained their bachelor degree (table 2), for both kinds of bachelor degrees.
6.3 Grouping level: field of study of the bachelor programme
We use multilevel modelling, with the field of study as second level of analyses (the first level is the individual level), because this is the level at which we enriched the data with information about the labour market opportunities of school-leavers (see below, for information on the data source). The fields of study in the Flemish tertiary education students’ dataset as well as in the dataset on school-leavers are coded in terms of the International Standard Classification of Education (ISCED) fields of study (Andersson & Olsson, 1999). For school-leavers, however, the number of cases is smaller than for the students, so we needed to group some fields of study with others in more broad study domains, and the source of data on which we based this grouping, was the one on school-leavers.
For school-leavers with a professional bachelor degree (PBA) we used the ISCED-fields of study at a 3-digit level where possible, in case of smaller numbers (<50, for 9 study domains) groups were combined at a 2-digit level. In addition, 2 separate groups were taken together with other groups with similar subjects and labour market perspectives.
For school-leavers with an academic bachelor degree (ABA), we needed to group study domains at a higher level, i.e. 2 digits, because of smaller numbers of school-leavers. Some study domains with even smaller numbers were grouped with others, at the 1-digit level (i.e. science; engineering and construction), economics and law were merged, and in five cases we categorised fields of study with small numbers along with similar other study domains.
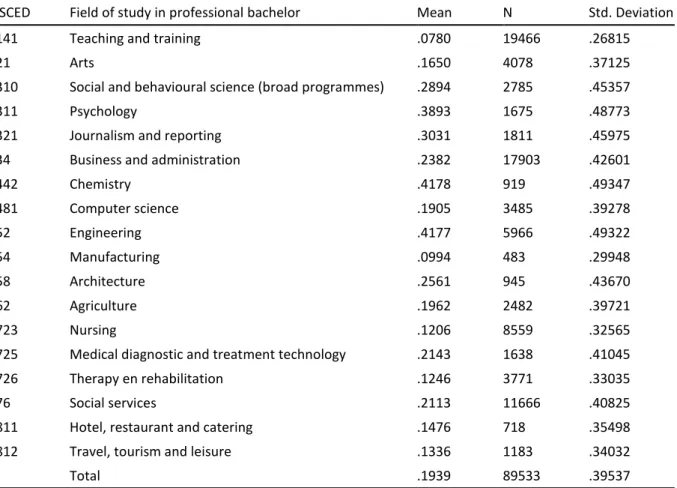
Using these groupings of the fields of study, we can now turn to differences in the transition rates to a master programme. First, for the professional bachelor graduates (table 3), transition rates to a master programme vary from as low as 7.8% for the graduates from a teaching training programme or 9.9% for manufacturing graduates to 41.8% for graduates with a professional bachelor in engineering or chemistry. Second, for the academic bachelor graduates (table 4), variation is much less, with the lowest, but still very high transition rate of 90.4% for students from arts programmes and even transition to the master rates of more than 99% for students with an academic bachelor degree in engineering and construction, or in health.
Table 3: Transition rates to a master programme (or equivalent) for professional bachelor graduates, according to field of study
ISCED Field of study in professional bachelor Mean N Std. Deviation
141 Teaching and training .0780 19466 .26815
21 Arts .1650 4078 .37125
310 Social and behavioural science (broad programmes) .2894 2785 .45357
311 Psychology .3893 1675 .48773
321 Journalism and reporting .3031 1811 .45975
34 Business and administration .2382 17903 .42601
442 Chemistry .4178 919 .49347 481 Computer science .1905 3485 .39278 52 Engineering .4177 5966 .49322 54 Manufacturing .0994 483 .29948 58 Architecture .2561 945 .43670 62 Agriculture .1962 2482 .39721 723 Nursing .1206 8559 .32565
725 Medical diagnostic and treatment technology .2143 1638 .41045
726 Therapy en rehabilitation .1246 3771 .33035
76 Social services .2113 11666 .40825
811 Hotel, restaurant and catering .1476 718 .35498
812 Travel, tourism and leisure .1336 1183 .34032
Total .1939 89533 .39537
Table 4: Transition rates to a master programme (or equivalent) for academic bachelor graduates, according to field of study
ISCED Field of study in academic bachelor Mean N Std. Deviation
21 Arts .9041 5472 .29454
22 Humanities .9415 8962 .23464
31 Social science .9812 10839 .13590
34 Business and administration .9846 13809 .12324
4 Science .9781 3798 .14622
5 Engineering and construction .9915 12282 .09207
72 Health .9934 11126 .08074
Opportunity or barrier? | 26
6.4 Independent variables: labour market opportunities of the
bachelor degree
Employability for tertiary education graduates is, amongst others, about their ability to gain initial and meaningful employment (Euridyce, 2012: 103, 112). To calculate the labour market prospects of graduates, we used a dataset on all of the Flemish school-leavers of the 2011. This dataset resulted from a pilot project by the two Flemish Policy Support Centres on Study and School Careers, and on Work and Social Economy, and compiled data from social security sources (Kruispuntbank Sociale Zekerheid) with, amongst others, data from the Department of Education and the Flemish job placement centre (VDAB) (Herremans, Laurijssen, Rober, 2015). From this school leavers-cohort, we selected the students who graduated with a bachelor degree in 2011 and who did not have any other tertiary degree at that time.
We identified the labour market opportunities of these bachelor graduates by looking at their position on the labour market at the end of the second quarter of 2012 (=june 2012), which is approximately one year after they left education. We use two indicators: having a paid job, and the salary of the employees. The salary is expressed in deciles with reference to the total working population. Aggregating this dataset by the same fields of study already described above, we calculated the employment rates of the different bachelor degree disciplines, as well as their average wage level (defined in deciles).
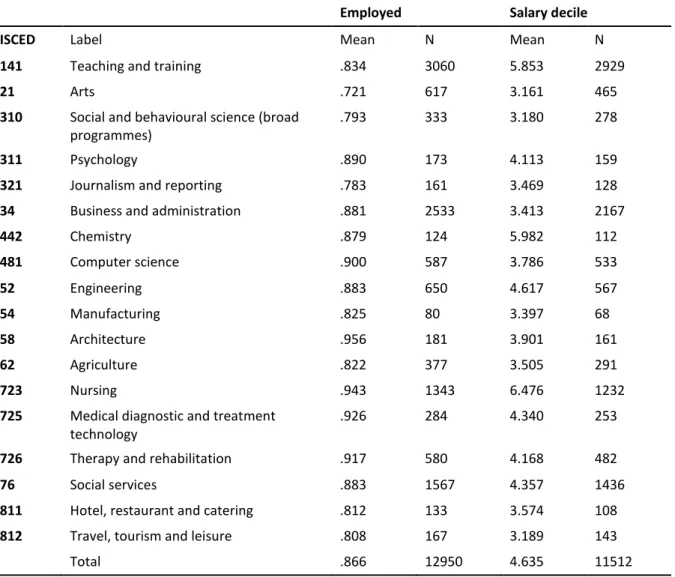
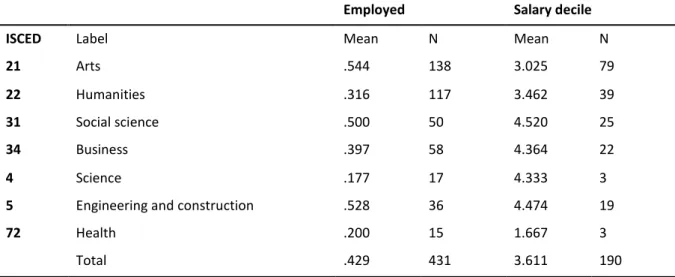
Looking at the labour market perspectives of first-cycle graduates, we see a possible indication why entering the labour market is so unpopular among ABA-graduates (table 5 and 6). Compared to PBA-degrees, ABA-degrees seem to translate in quite limited labour market opportunities. While 86.6% of the PBA-graduates have found employment within one year after graduation, more than half of the ABA-graduates are still looking for work after that same time period. Furthermore, those who do find employment have to make due with a lower salary than employees with a PBA-degree. Judged by these indicators of the labour market opportunities, leaving education after the first-cycle seems to be far less interesting for ABA-degree holders than for graduates with a PBA, which might explain why the vast majority of the ABA-graduates choose to enter a master programme.
Of course, the results we see here are from a selection of graduates; perhaps only the less motivated or less promising ABA-students decide to take their chances on the labour market after graduation, while the rest of the students enter the expected path towards the second cycle. For PBA-graduates on the other hand, entering the labour market is an expected and respectable route, ending their career in tertiary education.
Even when we take into account the different fields of studies within each bachelor programme, no ABA degree offers better employment perspectives than the most precarious PBA study domain. While ABA-studies of Arts offer the best chances on employment one year after graduation (54.4%), PBA-studies on the same subject report employment rates of 72.1%, which is the lowest score of any study
in the PBA-programme. The lowest employment rate is for the ABA-bachelors in Science (17.7%), the highest employment rate is for the PBA-bachelors in Architecture (95.6%).
The data on salary offer a similar, yet less dramatic insight; ABA-studies that offer the highest salary perspective are bachelors of Social Sciences (4.5), which is less than the average level of salary for PBA-graduates (4.6). The highest salary is found among the PBA-PBA-graduates in Nursing. The PBA-study with the lowest salary outcomes (again studies in Arts) is 3.2, but the lowest salary for ABA-graduates is 1.7 for those who studied Health. Although we need to be careful because of the rather low numbers of ABA-graduates entering the labour market, these results seem to indicate that the labour market opportunities for academic first-cycle degrees are troublesome.
Table 5: Labour market opportunities for professional bachelor graduates, according to field of study
Employed Salary decile ISCED Label Mean N Mean N
141 Teaching and training .834 3060 5.853 2929
21 Arts .721 617 3.161 465
310 Social and behavioural science (broad programmes)
.793 333 3.180 278
311 Psychology .890 173 4.113 159
321 Journalism and reporting .783 161 3.469 128
34 Business and administration .881 2533 3.413 2167
442 Chemistry .879 124 5.982 112 481 Computer science .900 587 3.786 533 52 Engineering .883 650 4.617 567 54 Manufacturing .825 80 3.397 68 58 Architecture .956 181 3.901 161 62 Agriculture .822 377 3.505 291 723 Nursing .943 1343 6.476 1232
725 Medical diagnostic and treatment technology
.926 284 4.340 253
726 Therapy and rehabilitation .917 580 4.168 482
76 Social services .883 1567 4.357 1436
811 Hotel, restaurant and catering .812 133 3.574 108
812 Travel, tourism and leisure .808 167 3.189 143
Opportunity or barrier? | 28
Table 6: Labour market opportunities for academic bachelor graduates, according to field of study
Employed Salary decile ISCED Label Mean N Mean N
21 Arts .544 138 3.025 79
22 Humanities .316 117 3.462 39
31 Social science .500 50 4.520 25
34 Business .397 58 4.364 22
4 Science .177 17 4.333 3
5 Engineering and construction .528 36 4.474 19
72 Health .200 15 1.667 3
7 Analyses
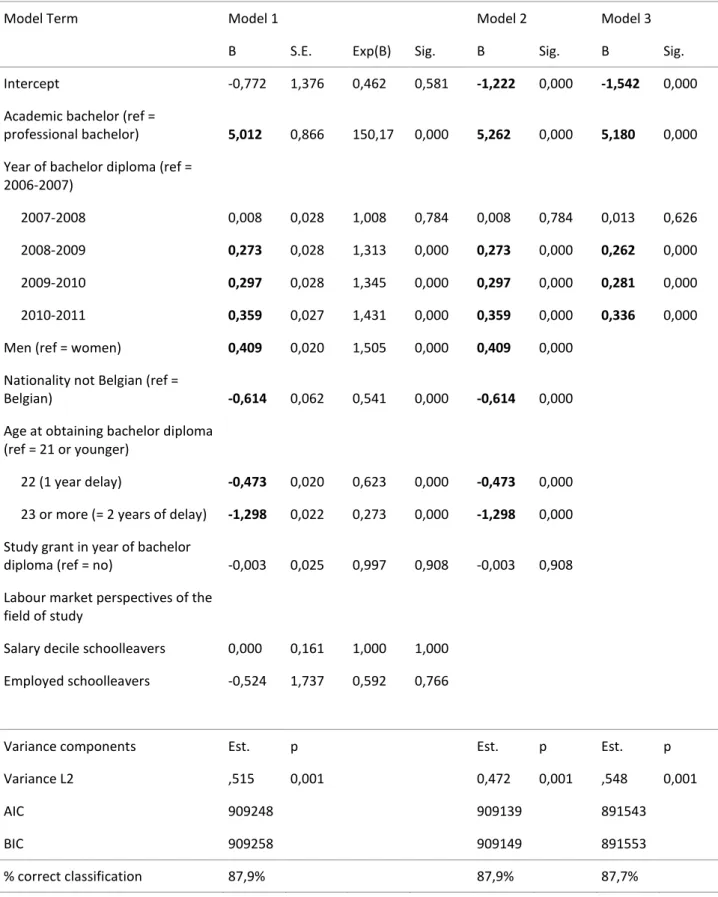
Multilevel logistic regression of the transition rates to a master programme after the PBA- and ABA-programmes, combined, in table 7 reveals 1) large differences according to the kind of programme, and 2) some social inequalities. As already noted several times before, the type of first-cycle programme in which students have graduated strongly influences the probability of their entrance into a second cycle programme; the odds of continuing to a master rather than entering the labour market for academic bachelor graduates are 178 times those of the professional bachelor graduates (odds ratio from Model 3)! These differences cannot be explained by differences in background characteristics of the students (odds ratio in Model 2: 193). The differences do become somewhat smaller when also controlling for the labour market opportunities of the different studies (odds ratio in Model 1: 150).
Secondly, the analysis shows significantly lower transition probabilities for women than for men; the odds of continuing towards the second-cycle are 1.5 times higher for male students than for female students. First-cycle graduates without a Belgian nationality also continue their education less often; their odds to proceed to the second-cycle are only half of these for Belgian nationals.
Age also impacts the decision to continue to a master programme, as the transition probability is lower for those students with some delay in their studies (i.e. who obtained their bachelor degree at an age > 21 years). Rather unexpected, the financial situation of students (and their parents), as indicated by receiving a study grant, has no effect on the post-bachelor choice, also the labour market perspectives of the fields of study do not explain variation in the transition rates.
But, important to note, the effects of these background characteristics, may vary according to the type of bachelor programme, as hypothesised above. This is why we report next on models for the professional and academic bachelor graduates separately.
Opportunity or barrier? | 30
Table 7: Multilevel models for the transition to a master programme (or equivalent), for the 2 types of bachelor graduates together
Model Term Model 1 Model 2 Model 3
B S.E. Exp(B) Sig. B Sig. B Sig.
Intercept -0,772 1,376 0,462 0,581 -1,222 0,000 -1,542 0,000 Academic bachelor (ref =
professional bachelor) 5,012 0,866 150,17 0,000 5,262 0,000 5,180 0,000 Year of bachelor diploma (ref =
2006-2007)
2007-2008 0,008 0,028 1,008 0,784 0,008 0,784 0,013 0,626 2008-2009 0,273 0,028 1,313 0,000 0,273 0,000 0,262 0,000 2009-2010 0,297 0,028 1,345 0,000 0,297 0,000 0,281 0,000 2010-2011 0,359 0,027 1,431 0,000 0,359 0,000 0,336 0,000 Men (ref = women) 0,409 0,020 1,505 0,000 0,409 0,000
Nationality not Belgian (ref =
Belgian) -0,614 0,062 0,541 0,000 -0,614 0,000
Age at obtaining bachelor diploma (ref = 21 or younger)
22 (1 year delay) -0,473 0,020 0,623 0,000 -0,473 0,000 23 or more (= 2 years of delay) -1,298 0,022 0,273 0,000 -1,298 0,000 Study grant in year of bachelor
diploma (ref = no) -0,003 0,025 0,997 0,908 -0,003 0,908 Labour market perspectives of the
field of study
Salary decile schoolleavers 0,000 0,161 1,000 1,000 Employed schoolleavers -0,524 1,737 0,592 0,766
Variance components Est. p Est. p Est. p
Variance L2 ,515 0,001 0,472 0,001 ,548 0,001
AIC 909248 909139 891543
BIC 909258 909149 891553
7.1 Transition to a master programme for professional bachelor
graduates (PBA)
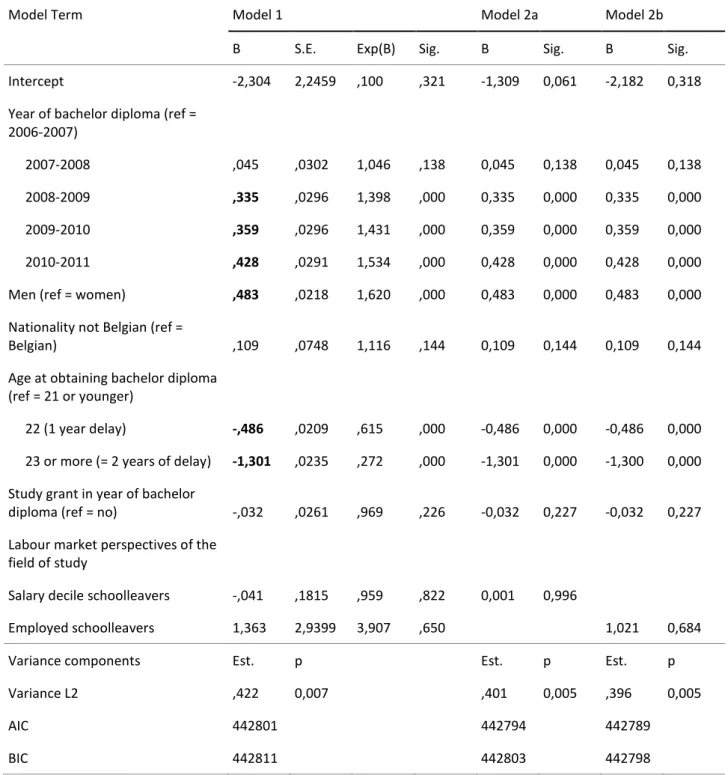
The results of the multilevel logistic model for the professional bachelor graduates separately (table 8, Model 1), are similar to those presented above, with the exception that the nationality of the student does not affect the transition probabilities in any statistically significant way.
Although this is not the main original orientation of PBA-programmes (yet required by the Bologna process agreements), entering (intermediate programmes towards) a second-cycle programme proves to be more and more popular among PBA-graduates between 2006 and 2010. But this advancement in educational opportunities is not equally divided among PBA-graduates. Again, male graduates are more likely to enrol into a second-level programme. Students who have graduated their bachelor at the age of 22 or 23 or more – indicating one or two or more years of study delay - show a handicap; with more years of study delay it becomes less likely to transition to a tertiary education programme aimed at obtaining a master degree.
Again, against expectations, PBA-graduates with a study grant (indicating weaker household income) show no fundamentally different probabilities to enter a master programme than their fellow students who did not receive a study grant in their year of bachelor graduation. In addition, for the PBA-bachelor graduates, no differences are found in the transition rates between Belgian and other nationals. Similar against expectations, we find that the economic perspectives of the discipline of the bachelor degree have no effect on the post-bachelor decision of PBA-students. The employment rate of the degree one year after graduation as well as the wage level have no significant effect on the enrolment of PBA-graduates.
Opportunity or barrier? | 32
Table 8: Multilevel models for the transition to a master programme (or equivalent), for professional bachelor graduates
Model Term Model 1 Model 2a Model 2b
B S.E. Exp(B) Sig. B Sig. B Sig.
Intercept -2,304 2,2459 ,100 ,321 -1,309 0,061 -2,182 0,318 Year of bachelor diploma (ref =
2006-2007)
2007-2008 ,045 ,0302 1,046 ,138 0,045 0,138 0,045 0,138 2008-2009 ,335 ,0296 1,398 ,000 0,335 0,000 0,335 0,000 2009-2010 ,359 ,0296 1,431 ,000 0,359 0,000 0,359 0,000 2010-2011 ,428 ,0291 1,534 ,000 0,428 0,000 0,428 0,000 Men (ref = women) ,483 ,0218 1,620 ,000 0,483 0,000 0,483 0,000 Nationality not Belgian (ref =
Belgian) ,109 ,0748 1,116 ,144 0,109 0,144 0,109 0,144
Age at obtaining bachelor diploma (ref = 21 or younger)
22 (1 year delay) -,486 ,0209 ,615 ,000 -0,486 0,000 -0,486 0,000 23 or more (= 2 years of delay) -1,301 ,0235 ,272 ,000 -1,301 0,000 -1,300 0,000 Study grant in year of bachelor
diploma (ref = no) -,032 ,0261 ,969 ,226 -0,032 0,227 -0,032 0,227 Labour market perspectives of the
field of study
Salary decile schoolleavers -,041 ,1815 ,959 ,822 0,001 0,996
Employed schoolleavers 1,363 2,9399 3,907 ,650 1,021 0,684
Variance components Est. p Est. p Est. p
Variance L2 ,422 0,007 ,401 0,005 ,396 0,005
AIC 442801 442794 442789
BIC 442811 442803 442798
Null model: ,392 L2 variance (p=0,004); AIC 432537 BIC 432546
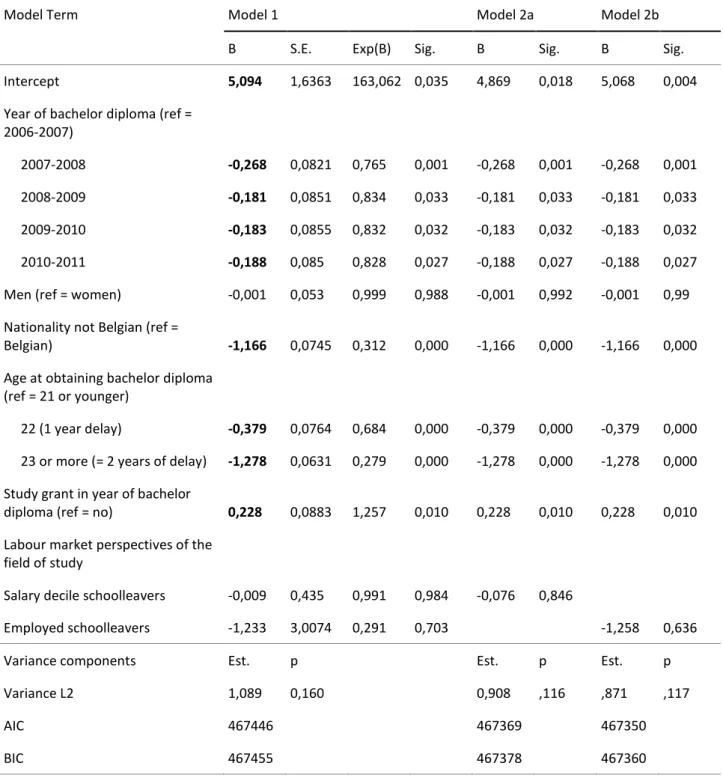
7.2 Transition to a master programme for academic bachelor
graduates (ABA)
As already noted multiple times, the transition rate to a master programme is very high for academic bachelor graduates (which also translates in a very high odds for the reference group in the analysis of 163 against 1 of making the transition); the graduates who decide to enter the labour market are a very small, probably very select, group. The same fact also put limits on identifying the labour market opportunities for school-leavers with an academic bachelor degree with a good reliability. Because of these factors, we should interpret the findings of the models that we run for the academic bachelors (table 9) with caution. We discuss the findings mainly by comparing with the results for the professional bachelor graduates.
Compared to the PBA-graduates, in this model for the ABA-graduates, the transition rates to a master programme show no change over time. Also gender does not make a difference. However, ethnic and financial backgrounds do impact the decisions of academic bachelor graduates. As expected, the probability of continuing to a master study is lower for students who do not have the Belgian nationality. On the other hand, students with a study grant in their bachelor graduation year more often decide to continue to a master study. This finding is opposite to what we expected, i.e. that for students with fewer financial means, the pull factor of earning a salary on the labour market would be stronger. Finally, similar effects among the ABA-graduates are found for age at graduation (age delay reduces the transition to the master), and the labour market opportunities of the specific fields of study (no statistically significant effects).
Opportunity or barrier? | 34
Table 9: Multilevel models for the transition to a master programme (or equivalent), for academic bachelor graduates
Model Term Model 1 Model 2a Model 2b
B S.E. Exp(B) Sig. B Sig. B Sig.
Intercept 5,094 1,6363 163,062 0,035 4,869 0,018 5,068 0,004 Year of bachelor diploma (ref =
2006-2007)
2007-2008 -0,268 0,0821 0,765 0,001 -0,268 0,001 -0,268 0,001 2008-2009 -0,181 0,0851 0,834 0,033 -0,181 0,033 -0,181 0,033 2009-2010 -0,183 0,0855 0,832 0,032 -0,183 0,032 -0,183 0,032 2010-2011 -0,188 0,085 0,828 0,027 -0,188 0,027 -0,188 0,027 Men (ref = women) -0,001 0,053 0,999 0,988 -0,001 0,992 -0,001 0,99 Nationality not Belgian (ref =
Belgian) -1,166 0,0745 0,312 0,000 -1,166 0,000 -1,166 0,000 Age at obtaining bachelor diploma
(ref = 21 or younger)
22 (1 year delay) -0,379 0,0764 0,684 0,000 -0,379 0,000 -0,379 0,000 23 or more (= 2 years of delay) -1,278 0,0631 0,279 0,000 -1,278 0,000 -1,278 0,000 Study grant in year of bachelor
diploma (ref = no) 0,228 0,0883 1,257 0,010 0,228 0,010 0,228 0,010 Labour market perspectives of the
field of study
Salary decile schoolleavers -0,009 0,435 0,991 0,984 -0,076 0,846
Employed schoolleavers -1,233 3,0074 0,291 0,703 -1,258 0,636
Variance components Est. p Est. p Est. p
Variance L2 1,089 0,160 0,908 ,116 ,871 ,117
AIC 467446 467369 467350
BIC 467455 467378 467360
Null model: ,997 L2 variance (p=0,085); AIC 457243 BIC 457252