EU Interlaboratory comparison study
food II (2007)
Bacteriological detection of Salmonella in minced beef
Report 330604010/2008RIVM Report 330604010/2008
EU Interlaboratory comparison study food II (2007)
Bacteriological detection of Salmonella in minced beef
A.F.A. Kuijpers C. Veenman J. Kassteele van de K.A. Mooijman Contact: A.F.A. Kuijpers
Laboratory of Zoonoses and Environmental Microbiology (LZO) angelina.kuijpers@rivm.nl
This investigation has been performed by order and for the account of European Commission, Health and Consumer Protection Directorate-General and the Laboratory for Zoonoses and the Environmental Microbiology (LZO) of the RIVM, within the framework of V/330604/07/CS by the Community Reference Laboratory for Salmonella
© RIVM 2008
Parts of this publication may be reproduced, provided acknowledgement is given to the 'National Institute for Public Health and the Environment', along with the title and year of publication.
Abstract
EU Interlaboratory comparison study food II (2007) Bacteriological detection of Salmonella in minced beef
From the 30 European National Reference Laboratories (NRLs) for Salmonella, 29 were found to be able to detect high and low levels of Salmonella in minced beef. However, five laboratories did require a follow up test to reach this level. One laboratory was still unable to produce satisfactory results in the follow up test. The reasons for this failure are currently being investigated. These results were shown in the second interlaboratory comparison study on food, organized by the Community Reference Laboratory (CRL) for Salmonella. The CRL for Salmonella is part of the National Institute for Public Health and the Environment (RIVM). The comparison study was conducted in November 2007, with the follow up in February 2008. All European Member States (MS) are obliged to participate in this study.
The study also investigated what the best method for detecting Salmonella in minced beef was out of three methods regularly used. One of the detection methods standardised at international level for the detection of Salmonella in food was found not to be the most effective. Only 69% of the samples tested with this method were found to be positive. The internationally prescribed method for the detection of Salmonella in veterinary samples gave the best results (86%).
In order to improve the performance testing of the laboratories, lower levels of contamination were used in the tests compared to earlier studies. For this study, each laboratory received a package containing minced beef and 35 gelatin capsules containing Salmonella spp. at different levels. The laboratories were instructed to spike the minced beef with the capsules and test the samples for the presence of Salmonella.
Key words: Salmonella; CRL-Salmonella; NRL-Salmonella; interlaboratory comparison study; minced beef; Salmonella detection methods
Rapport in het kort
EU Ringonderzoek voedsel-II (2007)Bacteriologische detectie van Salmonella in rundergehakt
Van de 30 Europese Nationale Referentie Laboratoria (NRLs) waren er 29 in staat hoge en lage concentraties Salmonella in rundergehakt aan te tonen. Vijf laboratoria hadden hiervoor een herkansing nodig. Eén laboratorium kon ook tijdens deze herkansing niet voldoende presteren. Momenteel wordt onderzocht wat de oorzaak hiervan is. Dit blijkt uit het tweede ringonderzoek georganiseerd door het Communautair Referentie Laboratorium (CRL) voor levensmiddelen. Het onderzoek is in november 2007 gehouden, de herkansing in februari 2008. Europese lidstaten zijn verplicht om aan dit onderzoek deel te nemen. Het CRL-Salmonella is gevestigd op het Rijksinstituut voor Volksgezondheid en Milieu (RIVM).
Tijdens dit ringonderzoek is ook onderzocht welke van de drie gebruikte analysemethoden de beste was om de Salmonellabacterie in rundergehakt aan te tonen. Eén van de internationaal gestandardiseerde methoden voor Salmonella in levensmiddelen blijkt niet de optimale methode te zijn. Hiermee werd slechts in 69% van de monsters Salmonella aangetroffen. De internationaal voorgeschreven methode om Salmonella in dierlijke mest aan te tonen behaalde het beste resultaat (86%).
Om de uitvoering van de laboratoria beter te kunnen testen zijn lagere besmettingsniveaus gebruikt dan in eerdere studies. Voor dit ringonderzoek kreeg ieder laboratorium een pakket toegestuurd met rundergehakt en 35 gelatine capsules met melkpoeder van verschillende besmettingsniveaus Salmonella. De laboratoria moesten volgens voorschrift gehakt en capsules samenvoegen en onderzoeken op de aanwezigheid van Salmonella.
Trefwoorden: Salmonella; CRL-Salmonella; NRL-Salmonella; ringonderzoek; rundergehakt; Salmonella detectie methode
Contents
List of abbreviations 9
Summary 11
1 Introduction 13
2 Participation 15
3 Materials and methods 17
3.1 Reference materials 17
3.2 Minced beef samples 17
3.2.1 General 17
3.2.2 Total bacterial count in minced beef 18 3.2.3 Number of Enterobacteriaceae in minced beef 18 3.3 Design of the interlaboratory comparison study 18 3.3.1 Samples: capsules and minced beef 18 3.3.2 Sample packaging and temperature recording during shipment 19
3.4 Methods 19
3.5 Statistical analysis of the data 20
3.6 Good performance 20
4 Results 23
4.1 Reference materials 23
4.2 Minced beef samples 24
4.3 Technical data interlaboratory comparison study 25
4.3.1 General 25 4.3.2 Accreditation/certification 25 4.3.3 Transport of samples 25 4.3.4 Media 28 4.4 Control samples 34 4.4.1 General 34
4.4.2 Specificity, sensitivity and accuracy rates of the control samples 36 4.5 Results meat samples artificially contaminated with
Salmonella spp. 38
4.5.1 Results per type of capsule and per laboratory 38
4.5.2 Results per selective enrichment medium, capsule and
per laboratory 40
4.5.3 Specificity, sensitivity and accuracy rates of the artificially
contaminated samples 48
4.6 PCR 50
4.7 Performance of the NRLs 52
4.7.1 General 52
5 Discussion 57
6 Conclusion 59
References 61
Annex 1 History of CRL-Salmonella interlaboratory comparison studies on the detection of Salmonella 63
Annex 2 Calculation of T2 67
Annex 3 Information on the media used 69
Annex 4 Protocol 71
Annex 5 SOP 75
Annex 6 Number of positive results of the control samples (capsule without meat) per laboratory and per selective enrichment medium 82 Annex 7 Number of positive results of the artificially contaminated meat (with capsule) per laboratory and per selective enrichment medium 84
List of abbreviations
BGA (mod) Brilliant Green Agar (modified)
BPLSA Brilliant Green Phenol-Red Lactose Sucrose Agar BPW Buffered Peptone Water
Cfp colony forming particles CRL Community Reference Laboratory dPCA double concentrated Plate Count Agar
dVRBG double concentrated Violet Red Bile Glucose agar hcmp highly contaminated milk powder
ISO International Standardisation Organisation LDC Lysine Decarboxylase
MKTTn Mueller Kauffmann Tetrathionate novobiocin broth MLCB Mannitol Lysine Crystal violet Brilliant green agar MS Member States
MSRV Modified Semi-solid Rappaport Vassiliadis NRL National Reference Laboratory
PCA Plate Count Agar
PCR Polymerase Chain Reaction
RIVM Rijksinstituut voor Volksgezondheid en het Milieu (National Institute for Public Health and the Environment) RM Reference Material
RVS Rappaport Vassiliadis Soya broth SE Salmonella Enteritidis
SM ID2 = Chrom ID Salmonella Detection and Identification-2 SOP Standard Operating Procedure SPan Salmonella Panama
STM Salmonella Typhimurium TSI Triple Sugar Iron agar
UA Urea Agar
VRBG Violet Red Bile Glucose agar XLD Xylose Lysine Deoxycholate agar XLT4 Xylose Lysine Tergitol 4 agar
Summary
In November/December 2007 the Community Reference Laboratory for Salmonella (CRL-Salmonella) organised the second interlaboratory comparison study on bacteriological detection of Salmonella in a food matrix (minced beef). Participants were 30 National Reference Laboratories for Salmonella (NRLs-Salmonella) of the EU Member States and of Norway and candidate country Former Yugoslav Republic of Macedonia (FYROM).
The first and most important objective of the study, was to see whether the participating laboratories could detect Salmonella at different contamination levels in a food matrix. For a better testing of the performance of the laboratories the contamination levels in this study were lower than in earlier studies. As a result of this, a new proposal for good performance was made and the performance of the laboratories was compared to this new proposal. In addition to the performance testing of the laboratories, a comparison was made between the prescribed methods (ISO 6579, 2002) and the requested method (Annex D of ISO 6579, 2007). For the prescribed method, the selective enrichment media were Rappaport Vassiliadis Soya broth (RVS) and Mueller Kauffmann Tetrathionate novobiocin broth (MKTTn). For the requested method the selective enrichment was Modified Semi-solid Rappaport Vassiliadis (MSRV). Optionally a laboratory could also use other, own media or procedures for the detection of Salmonella.
Thirty five individually numbered capsules had to be tested by the participants for the presence or absence of Salmonella. Twenty five of the capsules had to be examined in combination with each 10 gram of Salmonella negative minced beef. These 25 capsules were divided over the following groups: 5 capsules with approximately 5 colony forming particles (cfp) of Salmonella Typhimurium (STM5), 5 capsules containing approximately 50 cfp of S. Typhimurium (STM50), 5 capsules with approximately 10 cfp of S. Enteritidis (SE10), 5 capsules containing approximately 100 cfp of S. Enteritidis (SE100) and 5 blank capsules. The other 10 capsules, to which no meat had to be added, were control samples, existing of 3 capsules STM5, 2 capsules SE10, 1 capsule SE100, 2 capsules containing approximately 5 cfp of S. Panama (SPan5) and 2 blank capsules.
On average the laboratories found Salmonella in only 69% of the (contaminated) samples using one of the food methods (MKTTn). The method for testing veterinary samples (MSRV) gave the best results with 86% of the positive samples, closely followed by the other food method (RVS) with in total 84% positive samples. The MKTTn food method seem to be less optimal for detection of Salmonella spp. in minced beef.
Twenty-four out of 30 laboratories achieved the level of good performance for at least one of the used methods, one of them performed the study 3 months later. Five NRLs reached this level of good performance in a follow-up study with extra material. One NRL did not yet achieve the level of good performance.
1 Introduction
An important task of the Community Reference Laboratory for Salmonella (CRL-Salmonella), as laid down in Regulation EC No 882/2004, is the organisation of interlaboratory comparison studies. The history of the interlaboratory comparison studies as organised by CRL-Salmonella since 1995 is summarised in Annex 1. Up to 2005 the interlaboratory comparison studies on the detection of Salmonella were focused on veterinary samples (e.g. chicken faeces). However, according the regulations also food matrices should be dealt with. In 2006, with success, the first (pilot) interlaboratory comparison study on the detection of Salmonella in minced beef was organised. For a better testing of the performance of the laboratories the contamination levels of the samples used in the studies organised since 2007 were lower than in earlier studies. The first and most important objective of the study, organized by the Community Reference Laboratory (CRL) for Salmonella in November 2007, was to see if the participating laboratories could detect Salmonella at different contamination levels in a food matrix. The second objective was to compare the different methods for the detection of Salmonella in minced beef. Furthermore it is important that the examination of samples in the EU Member States is carried out uniformly and comparable results should be obtained by all National Reference Laboratories for Salmonella (NRL-Salmonella).
The prescribed method for detection of Salmonella in a food matrix is ISO 6579 (Anonymous, 2002). However, as good experiences were gained with Modified Semi-solid Rappaport Vassiliadis (MSRV) as selective enrichment medium for the detection of Salmonella spp. in animal faeces (Annex D of ISO 6579 Anonymous, 2007), participating laboratories were requested also to use MSRV for testing the minced beef.
The set-up of this study was comparable to earlier interlaboratory comparison studies on the detection of Salmonella spp. in veterinary and food samples. The contamination level of the low level capsules was at the detection limit of the method; the level of the high level samples approximately 5-10 times above the detection limit. Ten control samples consisting of different reference materials, had to be tested without the addition of minced beef. These reference materials consisted of 3 capsules with approximately 5 cfp of Salmonella Typhimurium (STM5), 2 capsules with approximately 10 cfp of Salmonella Enteritidis (SE10), 1 capsule with approximately 100 cfp of Salmonella Enteritidis (SE100), 2 capsules with approximately 5 cfp of Salmonella Panama (SPan5) and 2 blank capsules. Twenty-five samples of Salmonella negative minced beef spiked with 5 different reference materials (including blank capsules) had to be examined. The different reference materials consisted of two levels of Salmonella Typhimurium (STM5 and STM50) and two levels of Salmonella Enteritidis (SE10 and SE100).
2 Participation
Country City Institute
Austria Graz Austrian Agency for Health and Food Safety (AGES) Institute for Medical Microbiology and Hygiene Belgium Brussels Scientific Institute of Public Health WIV (IPH)
Food microbiology / Institute scientific Louis Pasteur Bulgaria Sophia National Diagnostic and Research Veterinary Institute Cyprus Nicosia Ministry of Agriculture, Natural Resources and Environment
Veterinary Services Laboratory for the Control of Foods of Animal Origin (LCFAO)
Czech Republic Prague State Veterinary Institute
Denmark Copenhagen National Food Institute The Technical University of Denmark Department of Microbiology and Risk Assessment
Estonia Tartu Estonian Veterinary and Food Laboratory, Bacteriology-Pathology Department Finland Helsinki Finnish Food Safety Authority Evira
Research Department, Microbiology Unit
France Ploufragan Agence Francaise De Securtie Santiare Des Aliments (AFSSA) Germany Berlin Federal Institute for Risk Assessment (BFR)
National Veterinary Reference Laboratory for Salmonella Greece Halkis Veterinary Laboratory of Halkis Hellenic
Republic Ministry of rural development and food Hungary Budapest Central Agricultural Office, Food and Feed Directorate
Central Microbiological Laboratory
Ireland Kildare Veterinary Research Laboratory CVRL / DAF Department of Agriculture and Food
Italy Legnaro Istituto Zooprofilattico Sperimentale delle Venezie, OIE/National Reference Laboratory for Salmonella
Latvia Riga Nationaly Diagnostic Centre (NDC) of
Food and Veterinary Service Lithuania Vilnius National Veterinary Laboratory
Luxembourg Luxembourg Laboratoire de Médecine Vétérinaire de l’Etat, Animal Zoonosis
Macedonia Former Yugoslav Republic of Macedonia (FYROM)
Skopje Food institute Faculty of veterinary medicine
Malta Valletta PHL Evans Building Department of Public Health
Netherlands The Bilthoven Nationa Institute for Public Health and the Environment (RIVM) Norway Oslo National Veterinary Institute, Section of Bacteriology
Country City Institute
Portugal Lisbon Laboratório Nacional de Investigação Veterinária (LNIV) Romania Bucharest Hygiene and veterinary public health Institute HPVHI Slovak Republic Bratislava State Veterinary and Food Institute
Reference Laboratory for Salmonella
Slovenia Ljubljana National Veterinary Institute, Veterinary Faculty
Spain Madrid
Majahonda
Agencia Española de Seguridad Alimentaria y Nutrición (AESAN) Centro Nacional de Alimentación
Servicio de Microbiología Alimentaria Sweden Uppsala National Veterinary Institute (SVA),
Department of Bacteriology
United Kingdom Belfast Agri-Food and Bioscience Institute (AFBI) Veterinary Sciences Division Bacteriology United Kingdom London Health Protection Agency London, Food, Water &
3 Materials and methods
3.1 Reference materials
Five batches of Salmonella reference materials were prepared. For this purpose milk, artificially contaminated with a Salmonella strain was spray-dried (In `t Veld et al., 1996). The obtained highly contaminated milk powder (hcmp) was mixed with sterile (γ-irradiated) milk powder (Carnation, Nestlé, the Netherlands) to obtain the desired contamination level. The mixed powder was filled in gelatin capsules resulting in the final reference materials (RMs).
The target levels of the five batches of RMs were:
• 5 colony forming particles (cfp) per capsule for Salmonella Panama (SPan5);
• 5 and 50 colony forming particles (cfp) per capsule for Salmonella Typhimurium (STM5 and STM50);
• 10 and 100 colony forming particles (cfp) per capsule for Salmonella Enteritidis (SE10 and SE100).
Before filling all mixed powders into gelatin capsules, test batches of 60 capsules were prepared of each mixture to determine the mean number of cfp per capsule and the homogeneity of the mixture. The remaining mixed powders were stored at –20 oC. If the test batches fulfilled the pre-set criteria for contamination level and homogeneity, the relevant mixed powders were completely filled into gelatin capsules and stored at -20 oC.
The pre-set criteria were:
• mean contamination levels should lie between target level minus 30% and target level plus 50% (e.g. between 70 and 150 cfp if the target level is 100 cfp);
• for the homogeneity within one batch of capsules the maximum demand for the variation between capsules should be T2/(I-1) ≤ 2, where T2 is a measure for the variation between capsules of one batch (see formula in Annex 2) and I is the number of capsules.
The contamination levels of the capsules were determined following the procedure as described by Schulten et al. (2000). Shortly the procedure is as follows:
• reconstitution of each capsule in 5 ml peptone saline solution in a Petri dish at (38.5 ± 1) oC for (45 ± 5) min;
• repair of Salmonella by the addition of 5 ml molten double concentrated plate count agar (dPCA) to the reconstituted capsule solution, and after solidification incubation at (37 ± 1) oC for (4 ± ½) h; • after incubation, 10 ml of molten double concentrated Violet Red Bile Glucose agar (dVRBG) was
added as an overlayer and after solidification the plates were incubated at (37 ± 1) oC for (20 ± 2) h.
3.2 Minced beef samples
3.2.1 General
Ten kilogram of minced beef was bought at the butcher (in Bilthoven) on 25 October 2007. The meat was tested for the absence of Salmonella following the procedure as described in Annex D of ISO 6579 (Anonymous, 2007). For this purpose 10 portions of 10 g were each added to 90 ml Buffered Peptone
Xylose Lysine Deoxycholate agar (XLD) and Brilliant Green Agar (BGA) and confirmed biochemically. The minced beef was stored at - 20 ºC until further use.
3.2.2 Total bacterial count in minced beef
The total number of aerobic bacteria was investigated in the minced beef. The procedure of ISO 4833 (Anonymous, 2003) was followed for this purpose. Portions of 20 gram meat was homogenized into 180 ml peptone saline solution in a plastic bag. The content was mixed by using a pulsifier (60 sec). Next tenfold dilutions were prepared in peptone saline solution. Two times one ml of each dilution was brought into 2 empty Petri-dishes (diameter 9 cm). To each dish 15 ml of molten Plate Count Agar (PCA) was added. After the PCA was solidified an additional 5 ml PCA was added to the agar. The plates were incubated at (30 ± 1) oC for (72 ± 3) h and the total number of aerobic bacteria was counted after incubation.
3.2.3 Number of Enterobacteriaceae in minced beef
In addition to the total count of aerobic bacteria, the Enterobacteriaceae count was determined. The procedure of ISO 21528-2 (Anonymous, 2004) was used for this purpose. Portions of 20 gram meat was homogenized into 180 ml peptone saline solution in a plastic bag. The content was mixed by using a pulsifier (60 sec). Next tenfold dilutions were prepared in peptone saline solution. Two times one ml of each dilution was brought into 2 empty Petri-dishes (diameter 9 cm). To each dish, 10 ml of molten Violet Red Bile Glucose agar (VRBG) was added. After the VRBG was solidified an additional 15 ml VRBG was added to the agar. These plates were incubated at (37 ± 1) oC for (24 ± 2) h and the number of typical violet-red colonies was counted after incubation. Five typical colonies were tested for the fermentation of glucose and for a negative oxidase reaction. After this confirmation the number of Enterobacteriaceae was calculated.
3.3 Design of the interlaboratory comparison study
3.3.1 Samples: capsules and minced beef
On 12 November 2007 (one week before the study) the reference materials (35 individually numbered capsules) and 300 grams of Salmonella negative minced beef were packed with cooling devices as biological substance category B (UN 3373) and send by courier service to the participants. After arrival at the laboratory the capsules had to be stored at –20 oC and the minced beef had to be stored at +5 oC until the start of the study. Details about mailing and handling of the samples and reporting of test results can be found in the Protocol (Annex 4) and Standard Operation Procedure (Annex 5). The test report which was used during the study can be found at the CRL-Salmonella website:
http://www.rivm.nl/crlsalmonella/prof_testing/detection_stud/ or can be obtained through the corre-sponding author of this report.
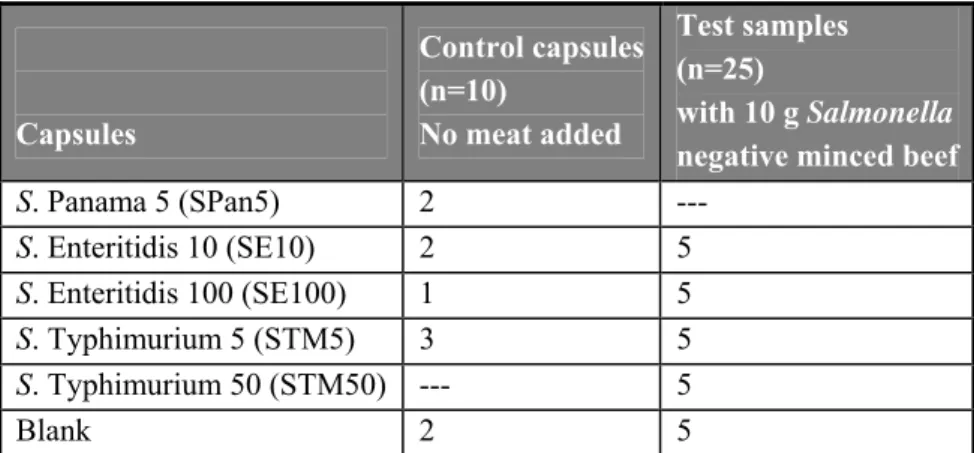
Ten control capsules had to be tested without meat (numbered C1-C10). Twenty-five capsules (numbered 1 – 25) were each tested in combination with 10 grams of minced beef (negative for Salmonella). The types and the number of capsules and meat samples to be tested are shown in Table 1.
Table 1 Overview of the types and the number of capsules tested per laboratory in the interlaboratory comparison study. Capsules Control capsules (n=10) No meat added Test samples (n=25) with 10 g Salmonella negative minced beef
S. Panama 5 (SPan5) 2 --- S. Enteritidis 10 (SE10) 2 5 S. Enteritidis 100 (SE100) 1 5 S. Typhimurium 5 (STM5) 3 5 S. Typhimurium 50 (STM50) --- 5 Blank 2 5
3.3.2 Sample packaging and temperature recording during shipment
The capsules and the minced beef were packed in 2 plastic containers firmly closed with screw caps (biopacks). Both biopacks were placed in one large shipping box, together with six frozen (-20 oC) cooling devices. Each shipping box was sent as biological substances category B (UN3373) by door-to-door courier services. For the control of exposure to abusive temperatures during shipment and storage, so called micro temperature loggers were used to record the temperature during transport. These loggers are tiny sealed units in a 16 mm diameter and 6 mm deep stainless steel case. Each shipping box contained one logger, packed in the biopack with capsules. The loggers were programmed by the CRL-Salmonella to measure the temperature every hour. Each NRL had to return the temperature recorder immediately after receipt of the parcel to the CRL. At the CRL-Salmonella the loggers were read by means of the computer and all data from the start of the shipment until the arrival at the National Reference Laboratories were transferred to an Excel graphic which shows all recorded temperatures.
3.4 Methods
The prescribed method of this interlaboratory comparison study was ISO 6579 (Anonymous, 2002) and the requested (additional) method was Annex D of ISO 6579 (Anonymous, 2007). Additional to the prescribed methods the NRLs were also allowed to use their own methods. This could be different medium combinations and/or investigation of the samples with alternative methods, like Polymerase Chain Reaction based methods.
In summary: Pre-enrichment in:
• Mueller Kaufmann Tetrathionate novobiocin broth (MKTTn) (prescribed) • Modified semi-solid Rappaport Vassiliadis medium (MSRV) (requested) • Own selective enrichment medium (optional)
Plating-out on:
• Xylose lysine desoxycholate agar (XLD) (prescribed) • Second plating-out medium for choice (obligatory) • Own plating-out medium (optional)
Biochemical confirmation:
• Biochemical confirmation as described in ISO 6579 Annex B.6-B.11 or by reliable, commercial available identification kits.
3.5 Statistical analysis of the data
The specificity, sensitivity and accuracy rates were calculated for the control samples, and the artificially contaminated samples with minced beef (negative for Salmonella spp.). The specificity, sensitivity and accuracy rates were calculated according to the following formulae:
Specificity rate: samples negative (expected) of number Total results negative of Number x 100% Sensitivity rate: samples positive (expected) of number Total results positive of Number x 100% Accuracy rate: negative) and (positive samples of number Total negative) and (positive results correct of Number x 100%
Results were analyzed using the statistical software R 2.6.2 (R Development Core Team, 2008). Mixed effect logistic regression (Venables and Ripley, 2002) using the lme4 package was used. The lme4 package provides functions for fitting and assessing of generalized linear mixed effects models in R (Bates, 2007).
Mixed effect logistic regression allows modelling of the binary outcomes as a function of a fixed effect part, consisting of the capsules, enrichment media and isolation media, and a random effect part, consisting of the different laboratories.
Differences among media and capsules are shown as odds ratios and were calculated by stratification by medium. In each stratum, laboratories were taken as a random effect. The overall performance of each laboratory is given as odds ratios compared to the mean of all laboratories, i.e. the outcomes as predicted based on the fixed effects only.
3.6 Good performance
New proposal for definition of “good performance”
During the tenth CRL-Salmonella workshop in April 2005 a proposal was made to define “good performance” in interlaboratory comparison studies on detection of Salmonella. For a better testing of the performance of the laboratories the contamination level of STM and SE capsules in this study are
lower than in earlier studies. The contamination level of the low level capsules is at the detection limit of the method; the high level samples approximately 5-10 times above the detection limit.
As a result of lowering the contamination levels, a new proposal for “good performance” is necessary: Control samples
(capsules, no matrix) Minimum result
Percentage positive No. of positive samples / total No. of samples
SE100 100% 1/1
STM5 60% 2/3
Span5 and SE10 50% 1/2 Blank control capsules 0% 0/2 Samples
(capsules with matrix) Minimum result
Percentage positive No. of positive samples / total No. of samples Blank1 20% at max1 1/5
STM50 80% 4/5 SE100 80% 4/5 STM5 50% 2-3/5
SE10 20% 1/5
1: All should be negative. However, as no 100% guarantees about the Salmonella negativity of the matrix can be given, 1 positive out of 5 blank samples (20% pos.) will still be considered as acceptable.
For determining good performance per laboratory all combinations of selective enrichment media and isolation media used by the laboratory were taken into account. For example if a laboratory found for the STM5 capsules with matrix 3/5 positive with MSRV/XLD, but no positives with any other selective enrichment medium or isolation medium this was still considered as good result. The opposite was performed for the blank capsules. Here also all combinations of media used per laboratory were taken into account. If for example a laboratory found 2/5 blank capsules positive with MKTTn/BGA but no positives with the other media, this was still considered as a “no-good” result.
When testing samples with a contamination level close to the detection limit it is expected that approximately 50% of the total number of tested samples will be found positive. For the Salmonella Enteritidis samples used in this study the detection limit was close to 10 cfp. As the mean contamination level of the low level SE reference materials was below 10 cfp/capsule (7 cfp), the demand for good performance of this type of RM added to a matrix was amended from 50% to 20% of the total number of samples to be positive.
4 Results
4.1 Reference materials
The level of contamination and the homogeneity of the final batches of capsules are presented in Table 2A and 2B. All batches met the pre-set criteria as stated in section 3.1. The enumerated minimum and maximum levels within each batch of capsules are also given in the table. The final batches were tested twice: firstly immediately after preparing the batch and secondly at the time of the interlaboratory comparison study.
Table 2A Level of contamination and homogeneity of SE, SPan and STM capsules.
SE10 SE100 SPan5 STM5 STM50 Final batch; Test 1
Date testing capsules 18-07-07 10-07-07 09-10-07 02-08-07 28-08-07 Number of capsules tested 50 50 50 50 50
Mean cfp per capsule 7 76 7 5 44
Min-max cfp per capsule 2-17 52-110 0-15 1-13 25-69
T2 / (I-1) 1.19 2.16 1.51 1.25 1.69
Final batch; Test 2
Date testing capsules 22-11-07 22-11-07 29-11-07 19-11-07 19-11-07 Number of capsules tested 25 25 25 25 25
Mean cfp per capsule 7 71 7 4 40
Min-max cfp per capsule 3-17 50-105 1-17 1-10 28-61
T2 / (I-1) 1.63 1.95 1.74 1.69 1.53
cfp = colony forming particles; min-max = enumerated minimum and maximum cfp; formula T2 see Annex 2; I is number of capsules; Demand for homogeneity T2 /(I-1) ≤ 2
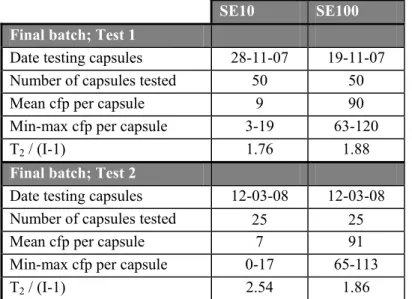
Table 2B Level of contamination and homogeneity of SE capsules used in the follow up study.
SE10 SE100 Final batch; Test 1
Date testing capsules 28-11-07 19-11-07 Number of capsules tested 50 50
Mean cfp per capsule 9 90 Min-max cfp per capsule 3-19 63-120
T2 / (I-1) 1.76 1.88
Final batch; Test 2
Date testing capsules 12-03-08 12-03-08
Number of capsules tested 25 25 Mean cfp per capsule 7 91 Min-max cfp per capsule 0-17 65-113
T2 / (I-1) 2.54 1.86
cfp = colony forming particles; min-max = enumerated minimum and maximum cfp; formula T2 see Annex 2; I is number of capsules; Demand for homogeneity T2 /(I-1) ≤ 2
4.2 Minced beef samples
The minced beef was tested negative for Salmonella and stored at -20 °C. On Monday 12 November 2007 the minced beef was mailed to the NRLs. After receipt the NRLs had to store the minced beef at 5 °C.
The number of aerobic bacteria and the number of Enterobacteriaceae were tested twice; firstly at the day the minced beef arrived at the CRL (25/10/2007) and secondly at the planned date (19/11/2007) of the interlaboratory comparison study. The results are shown in Table 3.
Most of the laboratories (twenty-seven) performed the study on the planned date (19/11/2007), one laboratory (labcode 23) performed the study one week earlier (12/11/2007) and one laboratory (labcode 16) one week later (26/11/2007). Laboratory 12 did not return the test report, after further inquiry we were informed they did not perform the study at the planned time finally they performed the study on 6 February 2008. The results from laboratory 12 were not calculated and compared with the other laboratories.
Table 3 Number of aerobic bacteria and the number of Enterobacteriaceae per gram of minced beef.
Date Aerobic bacteria cfp/g Enterobacteriaceae cfp/g
25 October 2007
Stored at -20 °C 7.7*107 6.8*103 19 November 2007
4.3 Technical data interlaboratory comparison study
4.3.1 General
Laboratory 12 performed the study 3 months later than the other laboratories (6 February 2008). The test report arrived at CRL Salmonella on 27 February 2008. Due to this delay it was not possible to report the results of this laboratory together with the results of the other laboratories.
4.3.2 Accreditation/certification
Twenty-four laboratories mentioned to be accredited for their quality system according to ISO/IEC 17025 (Anonymous, 2005) (labcodes 1, 2, 4, 5, 6, 7, 8, 11, 12, 13, 15, 17, 18, 19, 20, 21, 23, 24, 25, 26, 27, 28, 29 and 30). Five laboratories (labcodes 3, 9, 14, 16 and 22) are planning to become accredited or certified in the near future and for one laboratory (labcode 10) the accreditation is already in process.
4.3.3 Transport of samples
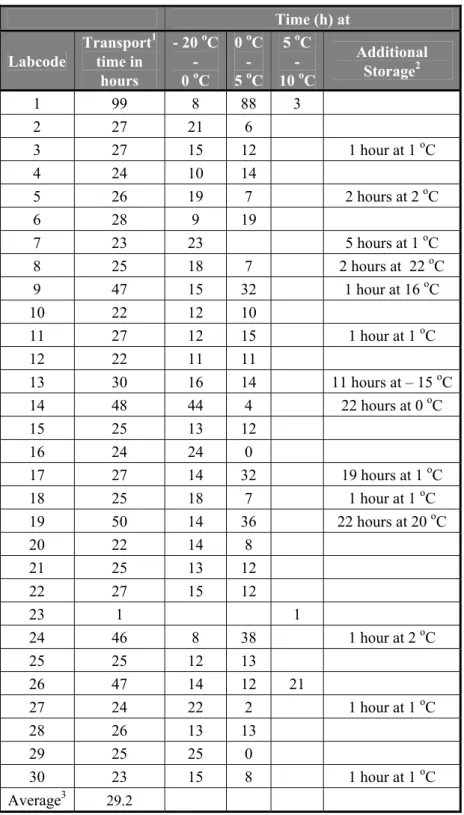
An overview of the transport times and the temperatures during transport of the parcels is given in Table 4. The temperature recorders were returned immediately after receipt to CRL-Salmonella by all NRLs with the exception of laboratory 12. The majority of the laboratories received the materials within 1 day. However, the parcel of laboratory 1 was brought to another country by the courier and was delayed for 3 days. The total transport time of this parcel was 99 hours. When this latter parcel is not taken into account, the average transport time was 29 hours. For the majority of the parcels the transport temperature did not exceed 5 oC. Although the parcel of laboratory 1 was delayed for 3 days, most of the time it was stored below 5 oC. For fourteen NRLs the time of transport recorded on the test report did not correspond with the time reported by the courier. Presumably the parcel arrived at the time reported by the courier at the Institute, but due to internal logistics at the Institute the parcel arrived later at the laboratory of the NRL. The delay varied between 1 to 22 hours. In three laboratories (labcodes 8, 9 and 19) the storage temperature during the delay was higher than 15 oC. For the other laboratories (labcodes 3, 5, 7, 11, 13, 14, 17, 18, 24, 27 and 30) the storage temperature during the delay was below 5 oC.
Table 4 Overview of the transport time and of the temperatures during shipment of the parcels to the NRLs. Time (h) at Labcode Transport1 time in hours - 20 oC - 0 oC 0 oC - 5 oC 5 oC - 10 oC Additional Storage2 1 99 8 88 3 2 27 21 6 3 27 15 12 1 hour at 1 oC 4 24 10 14 5 26 19 7 2 hours at 2 oC 6 28 9 19 7 23 23 5 hours at 1 oC 8 25 18 7 2 hours at 22 oC 9 47 15 32 1 hour at 16 oC 10 22 12 10 11 27 12 15 1 hour at 1 oC 12 22 11 11 13 30 16 14 11 hours at – 15 oC 14 48 44 4 22 hours at 0 oC 15 25 13 12 16 24 24 0 17 27 14 32 19 hours at 1 oC 18 25 18 7 1 hour at 1 oC 19 50 14 36 22 hours at 20 oC 20 22 14 8 21 25 13 12 22 27 15 12 23 1 1 24 46 8 38 1 hour at 2 oC 25 25 12 13 26 47 14 12 21 27 24 22 2 1 hour at 1 oC 28 26 13 13 29 25 25 0 30 23 15 8 1 hour at 1 oC Average3 29.2
1 transport time according the courier
2 storage time of the samples at the institute before arriving at the laboratory of the NRL 3 average time without lab no 1 and 23
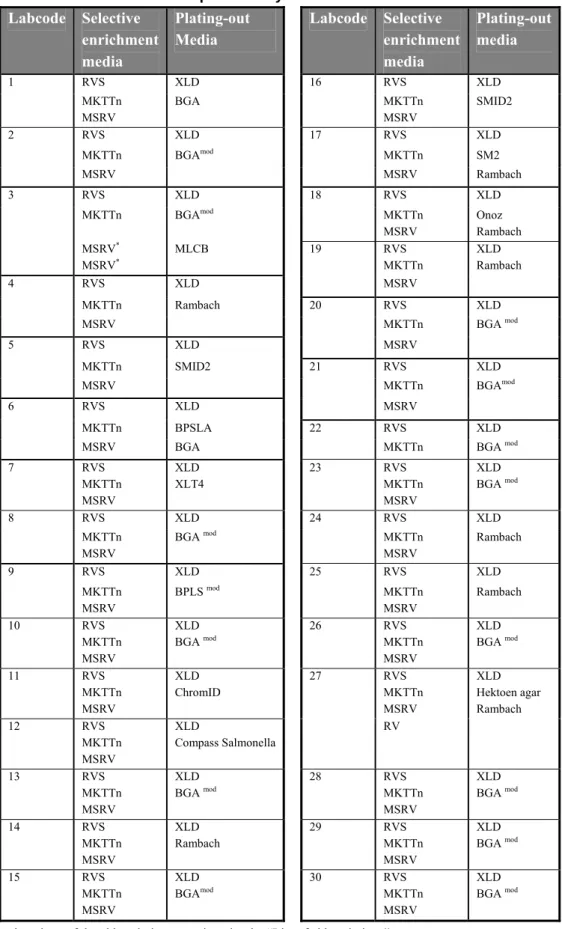
Table 5 Media combinations used per laboratory. Labcode Selective enrichment media Plating-out Media Labcode Selective enrichment media Plating-out media 1 RVS XLD 16 RVS XLD MKTTn MSRV BGA MKTTn MSRV SMID2 2 RVS XLD 17 RVS XLD MKTTn BGAmod MKTTn SM2 MSRV MSRV Rambach 3 RVS XLD 18 RVS XLD MKTTn BGAmod MKTTn MSRV Onoz Rambach MSRV* MSRV* MLCB 19 RVS MKTTn XLD Rambach 4 RVS XLD MSRV MKTTn Rambach 20 RVS XLD MSRV MKTTn BGA mod 5 RVS XLD MSRV MKTTn SMID2 21 RVS XLD MSRV MKTTn BGAmod 6 RVS XLD MSRV MKTTn BPSLA 22 RVS XLD
MSRV BGA MKTTn BGA mod
7 RVS MKTTn MSRV XLD XLT4 23 RVS MKTTn MSRV XLD BGA mod 8 RVS XLD 24 RVS XLD MKTTn MSRV BGA mod MKTTn MSRV Rambach 9 RVS XLD 25 RVS XLD MKTTn MSRV BPLS mod MKTTn MSRV Rambach 10 RVS MKTTn MSRV XLD BGA mod 26 RVS MKTTn MSRV XLD BGA mod 11 RVS MKTTn MSRV XLD ChromID 27 RVS MKTTn MSRV XLD Hektoen agar Rambach 12 RVS MKTTn MSRV XLD Compass Salmonella RV 13 RVS MKTTn MSRV XLD BGA mod 28 RVS MKTTn MSRV XLD BGA mod 14 RVS MKTTn MSRV XLD Rambach 29 RVS MKTTn MSRV XLD BGA mod 15 RVS MKTTn XLD BGAmod 30 RVS MKTTn XLD BGA mod
4.3.4 Media
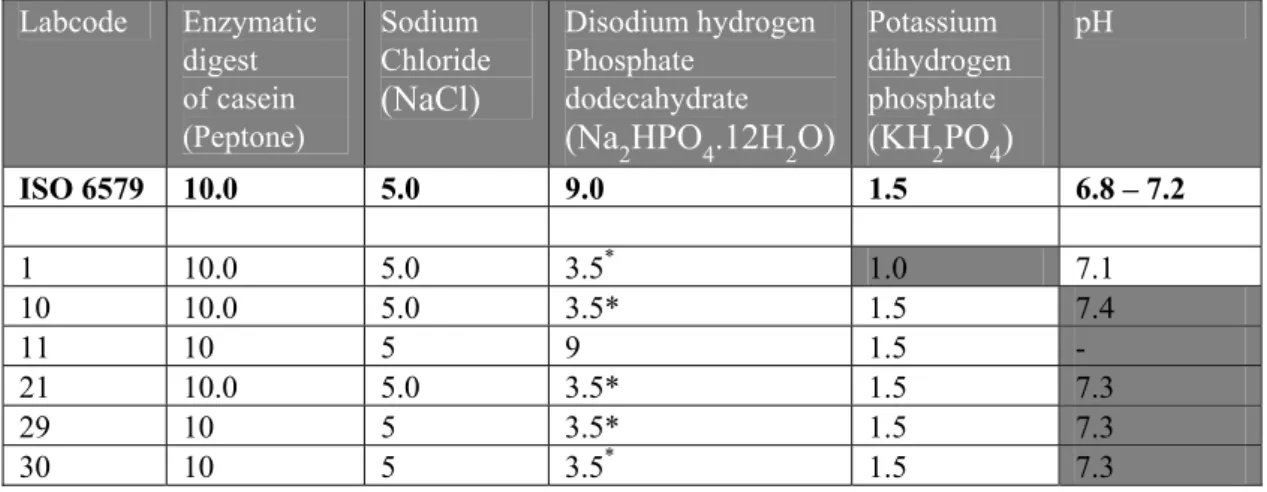
Each laboratory was asked to test the samples with the prescribed (ISO 6579) and the requested (AnnexD of ISO 6579) methods. All laboratories except one (labcode 22) used the selective enrichment media RVS, MKTTn and MSRV with the plating out medium XLD and a second plating out medium of own choice. Laboratory 22 used only RVS and MKTTn for selective enrichment. The media used per laboratory are shown in Table 5. Two NRLs (labcodes 3 and 27) used additional to the prescribed and “requested” selective enrichment media another selective enrichment medium. Five NRLs (labcodes 3, 6, 17, 18 and 27) used a third plating out medium. Details on the media which are not described in ISO 6579 are given in Annex 3. In Tables 6-12 information is given on the composition of the media which were prescribed and “requested” and on incubation temperatures and times. In these tables only the laboratories are indicated who reported deviations. Laboratory 11 did not mention the pH and quality control of the media and laboratory 27 did not mention de composition of the media used. Three laboratories incubated the selective enrichment media at deviating temperatures (labcodes 8, 25 and 27). Laboratory 17 incubated the MSRV only for 24 hours.
A second plating-out medium for choice was obligatory. Five-teen laboratories used BGA mod (ISO 6579, 1993) as a second plating-out medium and laboratory 6 used BPLSA (Merck) this is very close to BGA. Eight laboratories used Rambach and four laboratories used SM (ID) 2 agar. The following media were used only by one laboratory : XLT4, Onoz, MLCB, Hektoen and compass agar.
The use of an extra plating agar between the “isolation” and the “confirmation” steps was optional. A total of 18 laboratories performed this extra culture step on many different media (e.g. Nutrient agar (ISO 6579, 2002), Mc Conkey and Bromthymol blue lactose sucrose agar).
Table 6 Incubation time and temperature of BPW.
Prewarming BPW Dissolving capsules in BPW Pre-enrichment in BPW Labcode Time (h:min) Incubation temperature in oC (min-max) Time (min) Incubation temperature in oC (min-max) Time (h:min) Incubation temperature in oC (min-max) SOP & ISO 6579 Overnight 36-38 45 36-38 16 – 20 36-38 2 20:15 37 45 37 20:30 37 13 - - 45 37 21:30 37 18 5:30 37 50 36.6-37 18:10 36.6-36.8 26 22:40 37 45 37 22:30 37 29 27:20 36 50 36.7-37.1 18:50 36.6 30 24 37 45 37 21:00 37
Grey cell : deviating times and temperatures - = no info
Table 7 Composition (in g/L) and pH of BPW medium. Labcode Enzymatic digest of casein (Peptone) Sodium Chloride
(NaCl)
Disodium hydrogen Phosphate dodecahydrate(Na
2HPO
4.12H
2O)
Potassium dihydrogen phosphate(KH
2PO
4)
pH ISO 6579 10.0 5.0 9.0 1.5 6.8 – 7.2 1 10.0 5.0 3.5* 1.0 7.1 10 10.0 5.0 3.5* 1.5 7.4 11 10 5 9 1.5 - 21 10.0 5.0 3.5* 1.5 7.3 29 10 5 3.5* 1.5 7.3 30 10 5 3.5* 1.5 7.3Grey cell: deviating from ISO 6579 - = no info
* = 3.5 g Disodium hydrogen phosphate (anhydrous) is equivalent to 9 g disodium hydrogen phosphate dodecahydrate
Table 8 Incubation times and temperatures of selective enrichment medium RVS and MSRV.
RVS MKTTn MSRV Labcode Incubation temperature in oC (min-max) Incubation temperature in oC (min-max) Incubation time in h:min Incubation temperature in oC (min-max) ISO 6579 & Annex D 40.5 – 42.5 36-38 2 x (24 ± 3) h 40.5 – 42.5 8 37 37 47:40 42 17 41.5 37 24:30 41.5 25 41.5-42 41.5-42 48:00 41.5-42 27 36.8-37 36.8-37 47:15 36.7-37 Grey cell: deviating times and temperatures
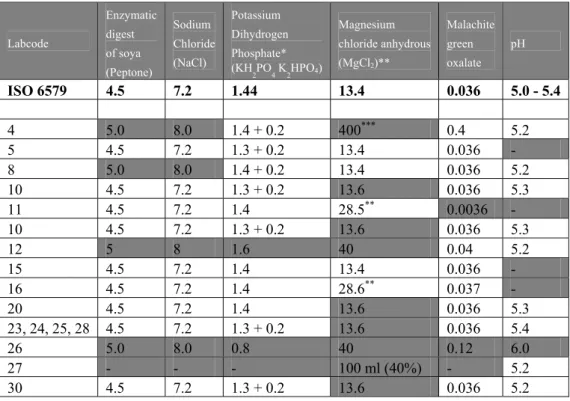
Table 9 Composition (in g/L) and pH of RVS. Labcode Enzymatic digest of soya (Peptone) Sodium Chloride (NaCl) Potassium Dihydrogen Phosphate* (KH 2PO4 K2HPO4) Magnesium chloride anhydrous (MgCl2)** Malachite green oxalate pH ISO 6579 4.5 7.2 1.44 13.4 0.036 5.0 - 5.4 4 5.0 8.0 1.4 + 0.2 400*** 0.4 5.2 5 4.5 7.2 1.3 + 0.2 13.4 0.036 - 8 5.0 8.0 1.4 + 0.2 13.4 0.036 5.2 10 4.5 7.2 1.3 + 0.2 13.6 0.036 5.3 11 4.5 7.2 1.4 28.5** 0.0036 - 10 4.5 7.2 1.3 + 0.2 13.6 0.036 5.3 12 5 8 1.6 40 0.04 5.2 15 4.5 7.2 1.4 13.4 0.036 - 16 4.5 7.2 1.4 28.6** 0.037 - 20 4.5 7.2 1.4 13.6 0.036 5.3 23, 24, 25, 28 4.5 7.2 1.3 + 0.2 13.6 0.036 5.4 26 5.0 8.0 0.8 40 0.12 6.0 27 - - - 100 ml (40%) - 5.2 30 4.5 7.2 1.3 + 0.2 13.6 0.036 5.2
Grey cell: deviating from ISO 6579 - = no info
*= 1.4 g/L Potassium dihydrogen phosphate (KH2PO4) + 0.2 g/L Di-potassium hydrogen phosphate (K2HPO4) gives a
final concentration of 1.44 g/L KH2PO4 K2HPO4
** = 13.4 g MgCl2 (anhydrous) is equivalent to 28.6 g MgCl2 hexahydrate.
Table 10 Composition (in g/L) and pH of MKTTn. Lab code Meat extract Enzymatic digest of casein (Peptone) Sodium chloride (NaCl) Calcium Carbonate (CaCO3) Sodium Thiosulfate Penta hydrate (Na2S2O3. 5H2O) Oxbile Brilliant green Iodine Potassium iodide (KI) Novo- biocin pH ISO 6579 4.3 8.6 2.6 38.7 47.8 4.78 9.6 mg 4 5.0 0.04 8.0 – 8.4 2 4.3 8.6 2.6 38.7 30.5* 4.78 9.6 0.8 2.0 0.8 7.7 4 4.3 8.6 2.6 38.7 47.8 4.78 9.6 g 20 25 0.04 8.2 5 4.2 8.5 2.5 38.0 30.3 4.75 9.5 4 5 0.05 - 6 4.3 8.6 2.6 38.7 30.5* 4.78 9.0 4 5.0 5 mg 8 7 4.3 8.6 2.6 38.7 47.8 4.78 9.6 20 ml - 0.04 8.0 8 4.3 8.6 2.6 38.7 47.8 4.78 9.6 20 25 0.04 8.0 9 4.3 8.6 2.6 38.7 30.3 4.75 9.5 20 25 0.04 7.8 10 4.3 8.6 2.6 38.7 30.5* 4.78 9.6 4.0 5.0 0.04 7.8 11 4.2 8.5 2.54 38.0 30.3* 4.75 9.5 4 5 0.05 - 13 7.0 2.3 2.3 25.0 40.7 4.75 0.1 g/ 100ml 20 g/ 100ml 25 g/ 100ml 0 7.8 14 4.3 8.6 2.6 38.7 30.5* 4.78 9.6 4 5 0.04 7.8 15 4.3 8.6 2.6 38.7 47.8 4.78 9.6 - - - - 16 4.2 8.5 2.5 38.0 30.3* 4.75 9.5 4 5 0.05 - 22 4.3 8.6 2.6 38.7 30.5* 4.78 9.6 20 25 0.04 8.2 26 7.0 2.3 2.3 25.0 40.7 4.75 9.5 ml 0.1% 20 25 0.04 7.8 27 - - - 5 ml 8.2 29 - - - 0.02 7.9 30 4.3 8.6 2.6 38.7 30.5* 4.7 9.6 20 ml 20 ml 0.04 8.0
Grey cell: deviating from ISO 6579 - = no info
Table 11 Composition (in g/L) and pH of MSRV. Labcode Enzymatic digest of casein (Tryptose) Casein hydro-lysate
S
odium chloride (NaCl) Potassium Dihydrogen Phosphate (KH2PO4 K2HPO4) Magnesium chloride anhydrous (MgCl2) Malachite green oxalate Agar Novo Biocin pH Annex D ISO 6579 4.6 4.6 7.3 1.5 10.9 0.04 2.7 0.01 (10mg/L) 5.1-5.4 2 4.6 4.6 7.3 1.5 10.9 0.04 2.7 0.03 5.6 - 4.6 7.3 1.5 10.9 0.04 2.5 0.02 5.3 3* 4.6 4.6 7.3 1.5 10.9 0.04 2.7 0.02 5.2 4 - - - - 5.2 5 4.6 4.6 7.3 1.5 10.9 0.04 2.7 0.02 - 7 4.6 4.6 7.3 1.5 10.9 0.04 2.7 0.02 5.2 8 4.6 4.6 7.3 1.5 10.9 0.04 2.7 0.05 5.2 10 4.6 4.6 7.3 1.5 10.9 0.04 2.7 0.02 5.0 11 4.6 4.6 7.3 1.5 10.9 0.04 2.7 2.7 g - 13 4.6 4.6 7.3 1.5 10.9 0.04 2.7 0 5.5 14 4.6 4.6 7.3 1.5 10.9 0.04 2.7 0.02 5.3 15 4.6 4.6 7.3 1.5 10.9 0.04 2.7 0.02 5.6 17 - - - 5.5 19 4.6 4.6 7.3 1.5 10.9 0.04 2.7 - 5.2 26 4.6 4.6 7.3 1.5 10.9 0.04 2.7 0.01 5.5 27 - - - - 2.7 2 ml 5.2 28 4.6 4.6 7.3 1.5 10.9 0.04 2.7 0.1 5.5 29 4.6 4.6 7.3 1.5 10.9 0.04 2.7 0.01 5.5 30 4.6 4.6 7.3 1.5 10.9 0.04 2.7 0.02 5.4Grey cell: deviating from Annex D of ISO 6579 - = no info
Table 12 Composition (in g/L) and pH of XLD. Lab Code Xylose L-lysine Lact ose Sucrose (Sac char ose) Sodium chloride (NaCl) Yeast Extract Phenol red Agar Sodium deoxy- cholate (C24H39 NaO4) Sodium thio- sulphate (Na2S2O3) Iron (III) Ammo nium Citrate (C6H8O7· nFe·nH3N) pH ISO 6579 3.75 5.0 7.5 7.5 5.0 3.0 0.08 9-18 1.0 6.8 0.8 7.2 – 7.6 2 3.75 5.0 7.5 7.5 5.0 3.0 0.008 15 2.5 6.8 0.8 7.3 4 - - - - 7.4 5 - - - - 11 3.5 5.0 7.5 7.5 5.0 3.0 0.08 13.5 2.5 6.8 0.8 - 19 3.5 5.0 7.5 7.5 5.0 3.0 0.08 13.5 2.5 6.8 0.8 7.4 26 3.5 5.0 7.5 7.5 5.0 3.0 0.08 15 2.5 6.8 0.8 7.4 27 - - - - 7.4
Grey cell: deviating from ISO 6579 - = no info
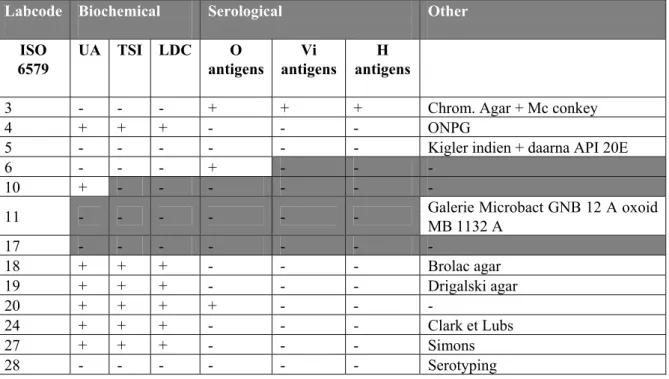
Fifteen laboratories used all three required biochemical media (UA, TSI and LDC) for confirmation of Salmonella. Laboratories who used additional or less confirmation media or tests are summarised in Table 13. Laboratory 17 did not mention any confirmation test. Two laboratories (labcodes 6 and 10) reported a rather limited confirmation. Laboratory 10 used only one biochemical test and laboratory 6 only an O antigen test. Two laboratories (labcodes 5 and 11) used a biochemical identification kit (which is also allowed). One laboratory (labcode 3) performed a complete serotyping. Laboratory 28 did not mention the details of serotyping and laboratory 20 performed the O antigen test additional to the biochemical confirmation.
Table 13 Biochemical and/ or serological confirmation of Salmonella.
Labcode Biochemical Serological Other
ISO 6579 UA TSI LDC O antigens Vi antigens H antigens
3 - - - + + + Chrom. Agar + Mc conkey
4 + + + - - - ONPG
5 - - - Kigler indien + daarna API 20E
6 - - - + - - -
10 + - - - -
11 - - - Galerie Microbact GNB 12 A oxoid MB 1132 A
17 - - - - 18 + + + - - - Brolac agar 19 + + + - - - Drigalski agar 20 + + + + - - - 24 + + + - - - Clark et Lubs 27 + + + - - - Simons 28 - - - - - - Serotyping
Grey cell : confirmation is deviating from ISO 6579 -= not done
4.4 Control samples
4.4.1 General
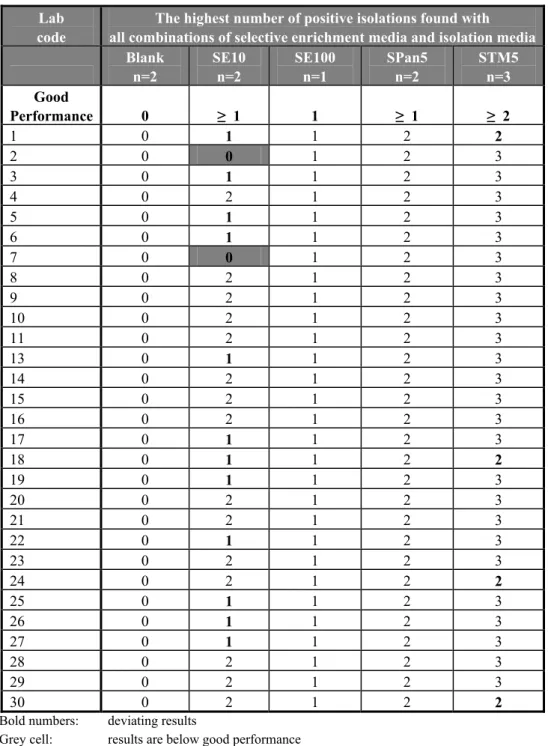
None of the laboratories isolated Salmonella from the procedure control (C11: no capsule/no meat) nor from the meat control (C12: no capsule/negative minced beef). Thirteen laboratories scored correct results for all the control capsules containing Salmonella. In Annex 6 the results are given of all control samples (capsules without meat) per laboratory and per selective enrichment medium in combination with the isolation medium that gives the highest number of positives. In Table 14 the highest number of positive isolations found with all combinations of selective enrichment media and isolation media are given per laboratory.
Blank capsules (n=2) without addition of meat
The blank capsules contained only sterile milk powder. For the analyses no meat was added. All participating laboratories correctly analysed the blank capsules negative.
Salmonella Panama 5 capsules (Span5) without addition of meat (n=2)
Twenty-seven laboratories isolated Salmonella from both capsules. Two Laboratories (labcodes 6 and 7) could not detect Salmonella Panama (SPan5) in one control capsule on one selective enrichment medium but they found both positive with the other two selective enrichment media inoculated from the same BPW.
Table 14 Total number of positive results of the control samples (capsule without meat) per laboratory.
Lab code
The highest number of positive isolations found with all combinations of selective enrichment media and isolation media
Blank n=2 SE10 n=2 SE100 n=1 SPan5 n=2 STM5 n=3 Good Performance 0 ≥ 1 1 ≥ 1 ≥ 2 1 0 1 1 2 2 2 0 0 1 2 3 3 0 1 1 2 3 4 0 2 1 2 3 5 0 1 1 2 3 6 0 1 1 2 3 7 0 0 1 2 3 8 0 2 1 2 3 9 0 2 1 2 3 10 0 2 1 2 3 11 0 2 1 2 3 13 0 1 1 2 3 14 0 2 1 2 3 15 0 2 1 2 3 16 0 2 1 2 3 17 0 1 1 2 3 18 0 1 1 2 2 19 0 1 1 2 3 20 0 2 1 2 3 21 0 2 1 2 3 22 0 1 1 2 3 23 0 2 1 2 3 24 0 2 1 2 2 25 0 1 1 2 3 26 0 1 1 2 3 27 0 1 1 2 3 28 0 2 1 2 3 29 0 2 1 2 3 30 0 2 1 2 2
Bold numbers: deviating results
Grey cell: results are below good performance Laboratory 12 see Annex 6
Salmonella Typhimurium 5 capsules (STM5) without addition of meat (n=3)
Twenty-five laboratories tested all the three capsules containing STM5 positive. Four laboratories (1, 18, 24 and 30) could not detect Salmonella (STM5) in one control capsule with all the three
selective enrichment media. These capsules contained STM at a low level (approximately 5 cfp/ capsule). Due to the variation between capsules one out of two capsules containing STM5 may
occasionally be negative.
Salmonella Enteritidis 10 capsules (SE10) without addition of meat (n=2)
Fifteen laboratories isolated Salmonella Enteritidis at a mean level of approximately 10 cfp/ capsule from both capsules. Two laboratories (labcodes 2 and 7) could not detect Salmonella Enteritidis in both SE10 control capsules on all the isolation media inoculated from the three enrichment media (RVS, MKTTn and MSRV). These capsules contained SE at a low level (approx 10 cfp/capsule). Due to change one out of two capsules containing SE10 may be negative. However, it is not very likely to find both SE10 capsules negative.
Twelve laboratories could not detect Salmonella in one control capsule with all the three selective enrichment media.
Salmonella Enteritidis 100 capsules (SE100) without addition of meat (n=1) All participating laboratories tested the capsule containing SE100 positive.
The results of all control samples were compared with the new definition of “good performance” (see section 3.6). The score for the control samples was below these criteria for two laboratories (labcodes 2 and 7).
4.4.2 Specificity, sensitivity and accuracy rates of the control samples
In Table 15 the specificity, sensitivity and accuracy rates for the control capsules without the addition of meat are shown. The rates are calculated for the different selective enrichment media (RVS, MKTTn and MSRV) and plating-out medium XLD. These rates were as expected. For the high level control sample (SE100) the rates were as expected 100%. For the low level materials (Span5, STM5 and SE10) the rates were expected to lie between 50% and 100%.
Table 15 Specificity, sensitivity and accuracy rates of the control samples (capsules without the addition of meat)1.
Control capsules RVS/XLD MKTTn/XLD MSRV/XLD2 Blank No. of samples 58 58 56
No. of negative samples 58 58 56
Specificity in% 100.0 100.0 100.0
Span5 No. of samples 58 58 56 No. of positive samples 57 58 55
Sensitivity in% 98.3 100.0 98.2
STM5 No. of samples 87 87 84 No. of positive samples 83 83 80
Sensitivity in% 95.4 95.4 95.2
SE10 No. of samples 58 58 56 No. of positive samples 42 42 41
Sensitivity in% 72.4 72.4 73.2
SE100 No. of samples 29 29 28 No. of positive samples 29 29 28
Sensitivity in% 100.0 100.0 100.0
All capsules with Salmonella No. of samples 232 232 224 No. of positive samples 211 212 204
Sensitivity in% 91.0 91.4 91.1
All capsules No. of samples 290 290 280 No. of correct samples 269 270 260
Accuracy in% 92.8 93.1 92.9
1 The results of laboratory 12 were not taken into account for the calculations 2 Laboratory 22 did not perform selective enrichment on MSRV.
4.5 Results meat samples artificially contaminated with Salmonella
spp.
4.5.1 Results per type of capsule and per laboratory
General
The results of the Salmonella negative minced beef samples artificially contaminated with capsules per selective enrichment medium in combination with the isolation medium that gives the highest number of positives are given in Annex 7. In Table 16 the highest number of positive isolations found with all combinations of selective enrichment media and isolation media are given per laboratory.
Laboratory 22 did not perform selective enrichment on MSRV. In general the number of positive
results of the samples containing S. Enteritidis were lower than the samples containing S. Typhimurium.
Blank capsules with negative minced beef (n=5)
Twenty-four laboratories correctly did not isolate Salmonella from these blank capsules with the addition of negative meat. Three laboratories (17, 27 and 30) found more than 1 positive blank with the addition of negative minced beef.
Laboratory 17 had found two blank capsules positive on SM(ID)2 isolated from MKTTn. With the other media they tested 1 blank positive, with the exception of Rambach inoculated from RVS from which they isolated no Salmonella.
Laboratory 27 found two blanks positive with all isolation media in combination with MKTTn and they also found one positive blank from RV and RVS isolated on Rambach and XLD.
Laboratory 30 had found two blank capsules positive on BGA isolated from RVS. All other blanks were tested negative.
All blanks should be tested negative. However, as no 100% guaranty about the Salmonella negativity of the matrix can be given, 1 positive out of 5 blank samples (80% negative) is still considered acceptable. Finding more than one blank sample positive is not very likely and may have been caused by cross-contamination or by misinterpretation of the results.
S. Typhimurium 5 capsules (STM5) with negative minced beef (n=5)
Twenty-one laboratories isolated Salmonella from all the five capsules containing Salmonella Typhimurium at a level of approximately 5 cfp/ capsule in combination with minced beef when using RVS, MKTTn or MSRV. Seven laboratories 3, 4, 7, 13, 18, 19, and 28 found one capsules negative and one laboratory (labcode 24) found two capsules negative with all three selective enrichment media. S. Typhimurium 50 capsules (STM50) with negative minced beef (n=5)
All laboratories isolated Salmonella from all five capsules containing Salmonella Typhimurium at a level of approximately 50 cfp/ capsule in combination with minced beef with the selective enrichment media RVS and MSRV. Seven laboratories 2, 7, 9, 17, 22, 23 and 28 found one or more capsules negative when using MKTTn.
S. Enteritidis 10 capsules (SE10) with negative minced beef (n=5)
Twenty-eight laboratories isolated Salmonella from at least one capsule containing Salmonella Enteritidis at a level of approximately 10 cfp/ capsule in combination with minced beef at least with one of the used selective enrichment media RVS, MKTTn or MSRV. Eight laboratories: 1, 8, 13, 14, 15 19, 24, and 30 isolated Salmonella from all the five SE10 capsules with at least one of three
selective enrichment media. Laboratory 9 found none of the capsules positive with either one of the selective enrichment media.
Table 16 Total number of positive results of the artificially contaminated minced beef samples per laboratory.
The highest number of positive isolations found with all combinations of selective enrichment media and isolation media Labcode Blank n=5 SE10 n=5 SE100 n=5 STM5 n=5 STM50 N=5 Good performance
≤
1 ≥ 1 ≥ 4 ≥ 2 ≥ 4 1 0 5 5 5 5 2 0 1 5 5 5 3 1 1 4 4 5 4 0 2 5 4 5 5 0 2 5 5 5 6 0 4 5 5 5 7 0 2 5 4 5 8 0 5 5 5 5 9 0 0 3 5 5 10 1 4 5 5 5 11 0 2 5 5 5 13 0 5 5 4 5 14 0 5 5 5 5 15 0 5 5 5 5 16 0 1 5 5 5 17 2 4 5 5 5 18 1 4 5 4 5 19 0 5 5 4 5 20 0 4 5 5 5 21 0 2 5 5 5 22 0 2 5 5 5 23 0 3 5 5 5 24 0 5 5 3 5 25 0 3 5 5 5 26 0 1 5 5 5 27 2 2 5 5 5 28 0 2 5 4 5 29 0 3 5 5 5 30 2 5 5 5 5Bold numbers: deviating results
Grey cell: results are below good performance Laboratory 12 See Annex 7
S. Enteritidis 100 capsules (SE100) with negative minced beef (n=5)
Twenty-seven laboratories isolated Salmonella from all the five capsules containing Salmonella Enteritidis at a level of approximately 100 cfp/ capsule in combination with minced beef with at least one of the selective enrichment media RVS, MKTTn or MSRV. Laboratory 3 found one capsule SE100 negative with all used selective enrichment media. Laboratory 9 found only three capsules positive with selective enrichment media RVS and MSRV; in MKTTn they missed all the five SE100 capsules.
The results of all artificially contaminated minced beef samples were compared with the new definition of “good performance” (see section 3.6). The score for the artificially contaminated samples was below the set criteria for four laboratories (labcodes 9, 17, 27 and 30).
4.5.2 Results per selective enrichment medium, capsule and per laboratory
In the Figures 1, 2, 3 and 4 the number of positive isolations per artificially contaminated meat sample is given per laboratory after pre-enrichment in BPW and selective enrichment in RVS, MKTTn and on MSRV, followed by isolation on selective plating agar XLD. For determining good performance per laboratory, all combinations of selective enrichment media and isolation media used by the laboratory were taken into account. In the figures the most optimal combination of selective enrichment medium and isolation medium is indicated as ”x”.
The results of all artificially contaminated minced beef samples were compared with the proposed definition of “good performance” (see section 3.6). In the Figures 1-4 the border of good performance is indicated with a black horizontal line. According to this definition the score for the artificially contaminated samples with Salmonella was below the set criteria for laboratory 9 and the score for the blank samples without Salmonella was above the set criteria for three laboratories (labcodes 17, 27 and 30).
The majority of the laboratories found the highest number of positive isolations when XLD was used as isolation medium. Six laboratories found differently when analysing the meat samples artificially contaminated with SE10 capsules. Laboratories 5, 6, 7 and 30 found a higher number of positive isolations on either BGA, SM2, BPLSA or XLT4 after selective enrichment in RVS. Laboratories 18 and 27 found higher number of positives with the combination MSRV/Rambach and RV/XLD respectively.
SE10 0 1 2 3 4 5 1 2 3 4 5 6 7 8 9 10 11 13 14 15 Labcode N umb er of p os it ive is ol at io ns RVS MKTTn MSRV x SE10 0 1 2 3 4 5 16 17 18 19 20 21 22 23 24 25 26 27 28 29 30 Labcode N um be r o f p os it ive is ol at io ns RVS M KTTn M SRV x Lab 22 did not use MSRV
─
= border of good performanceFigure 1 Results minced beef artificially contaminated with SE10 capsules (n=5) after selective enrichment in RVS, MKTTn and on MSRV followed by isolation on selective plating agar XLD. The highest number of positive isolations found with all combinations of selective enrichment media and isolation media
SE100 0 1 2 3 4 5 1 2 3 4 5 6 7 8 9 10 11 13 14 15 Labcode N umb er of p os it ive is ol at io ns RVS MKTTn MSRV x SE100 0 1 2 3 4 5 16 17 18 19 20 21 22 23 24 25 26 27 28 29 30 Labcode N umb er of p os it ive is ol at io ns RVS M KTTn MSRV x
Lab 22 did not use MSRV
─
= border of good performanceFigure 2 Results minced beef artificially contaminated with SE100 capsules (n=5) after selective enrichment in RVS, MKTTn and on MSRV followed by isolation on selective plating agar XLD. The highest number of positive isolations found with all combinations of selective enrichment media and isolation media used by a laboratory are given as x.
STM 5 0 1 2 3 4 5 1 2 3 4 5 6 7 8 9 10 11 13 14 15 Labcode N u m b er of p os it ive is ol at ion s RVS MKT T n MSRV x STM 5 0 1 2 3 4 5 16 17 18 19 20 21 22 23 24 25 26 27 28 29 30 Labcode N u m b er of p os it ive i sol at io n s RVS MKTTn MSRV x
Lab 22 did not use MSRV
─
= border of good performanceFigure 3 Results minced beef artificially contaminated with STM5 capsules (n=5) after selective enrichment in RVS, MKTTn and on MSRV followed by isolation on selective plating agar XLD. The highest number of positive isolations found with all combinations of selective enrichment media and isolation media used by a laboratory are given as x.
STM50 0 1 2 3 4 5 1 2 3 4 5 6 7 8 9 10 11 13 14 15 Labcode N umb er of p os it iv e i sol at io ns RVS MKTTn MSRV x STM50 0 1 2 3 4 5 16 17 18 19 20 21 22 23 24 25 26 27 28 29 30 Labcode N u m b er of pos it ive is ol at io ns RVS MKTTn MSRV x
Lab 22 did not use MSRV
─
= border of good performanceFigure 4 Results minced beef artificially contaminated with STM50 capsules (n=5) after selective enrichment in RVS, MKTTn and on MSRV followed by isolation on selective plating agar XLD. The highest number of positive isolations found with all combinations of selective enrichment media and isolation media used by a laboratory are given as x.
The differences in the number of positive isolations after 24 and 48 hours of incubation of the selective enrichment media are given in Table 17. XLD showed the highest number of positive isolations compared to other plating out media, independent on the selective enrichment medium used. The majority of the laboratories used BGA as the second plating out medium (see Table 5).
The choice of plating out medium does not seem to have a large effect on the number of positive isolations. Only when MKTTn is used for selective enrichment, XLD gave 9% more positive results than other plating-out media.
The difference in the number of positive isolations after 24 h and 48 h of incubation of the selective enrichment was the highest for MKTTn (Table 17). With MKTTn 12-13% more positive isolations were found after 48 h of incubation. For RVS the difference between the two incubation times was 9-10%. For MSRV this difference was 6-7%.
Table 17 Mean percentages of positive results of all participating laboratories after selective enrichment in RVS, MKTTn and on MSRV, incubated for 24 and 48 hours and followed by incubation on different plating out media, when analyzing the artificially contaminated minced beef samples.
Plating-out medium Selective enrichment medium
RVS MKTTn MSRV
24 / 48 h 24 / 48 h 24 / 48 h XLD 58 / 67% 42 / 55% 63 / 69% Other (most often BGA) 57 / 67% 34 / 46% 58 / 65%
In Tables 18 and 19 differences between selective enrichment media and isolation media per capsule are shown as odds ratios (OR). In addition the 95% confidence intervals and p-values are given.
The interpretation of Table 18 is as follows: given a selective enrichment medium the number of positive isolations found with the different plating out media are compared. For instance the odds of finding Salmonella using XLD as isolation medium is a factor OR higher than using an isolation medium other than XLD. If MKTTn is used as selective enrichment medium, XLD shows significantly more positive results. In general for MSRV and RVS the odds are also higher, but not significant. The interpretation of Table 19 is similar to that of Table 18, except that selective enrichment media are mutually compared given XLD as isolation medium. If MSRV or RVS are used as selective enrichment media, the odds of finding Salmonella are significantly higher than in case of MKTTn. RVS compared to MSRV results in lower odds, although this is not significant.
Figure 4 shows the performance of each laboratory as odds ratios compared to the mean of all laboratories for the artificially contaminated samples. The mean is defined as the odds of detecting Salmonella based on the fixed effects only (capsule, enrichment medium and isolation medium), hence OR = 1. Laboratories below the mean have a lower odds to detect Salmonella. Laboratories 2, 3, 7, 9, 22, 23, 28 and 30 found significant lower number of positive results compared to the mean of all laboratories.
Table 18 Number of positive isolations found with XLD compared to the number of positive isolations found with other isolations found with other isolation media, given a selective enrichment medium. Samples : minced beef, artificially contaminated with Salmonella positive capsules.
Selective enrichment medium
Compared
isolation media Capsule
Odds Ratios 95% lower 95% upper p-value SE10 2.16 1.16 4.02 0.015 SE100 3.09 1.62 5.90 0.001 STM5 2.69 1.46 4.96 0.002 STM50 5.55 2.22 13.93 0.000 all SE 2.10 1.42 3.11 0.000 all STM 3.24 1.97 5.32 0.000 MKTTn XLD compared to other than XLD all capsules 2.10 1.59 2.76 0.000 SE10 1.35 0.77 2.36 0.289 SE100 3.80 0.96 14.99 0.057 STM5 1.80 0.72 4.50 0.210 STM50 Inf 0.00 Inf 0.995 all SE 1.34 0.89 2.01 0.166 all STM 2.27 0.96 5.36 0.062 MSRV XLD compared to other than XLD all capsules 1.39 0.99 1.95 0.054 SE10 0.95 0.56 1.62 0.860 SE100 2.07 0.72 5.95 0.179 STM5 0.78 0.33 1.85 0.566 STM50 1.00 0.00 Inf 1.000 all SE 1.09 0.75 1.57 0.655 all STM 0.80 0.35 1.83 0.605 RVS XLD compared to other than XLD all capsules 1.03 0.76 1.40 0.854 SE10 1.32 0.96 1.81 0.090 SE100 1.87 1.27 2.74 0.001 STM5 1.58 1.07 2.34 0.021 STM50 3.12 1.60 6.07 0.001 all SE 1.37 1.11 1.69 0.004 all STM 1.85 1.34 2.56 0.000 MKTTn/MSRV/RVS XLD compared to other than XLD all capsules 1.42 1.20 1.67 0.000
Grey cells: significant difference p < 0.05 Inf. = infinity