RIVM report 711701041/2006
Validation of the VOLASOIL model using air measurements from Dutch contaminated sites
Concentrations of four chlorinated compounds
H.J. van Wijnen and J.P.A. Lijzen
Contact: HJ van Wijnen
Laboratory for Ecological Risk Assessment harm.van.wijnen@rivm.nl
This investigation has been performed by order and for the account of the Ministry of Housing Spatial Planning and the Environment, Directorate of Soil, Water and Rural areas, within the framework of project M/711701, ‘Risk in relation to soil quality’.
Het rapport in het kort
Validatie van het VOLASOIL model met luchtmetingen van verontreinigde locaties in Nederland
Concentraties van vier gechloreerde verbindingen
Uit deze studie bleek het VOLASOIL model goed bruikbaar om bij bodemverontreiniging met tetrachlooretheen en trichlooretheen de binnenluchtconcentratie in te schatten. Voor verontreiniging met de afbraakproducten cis-dichlooretheen en vinylchloride is het model waarschijnlijk ook bruikbaar, maar dit kon minder goed worden vastgesteld omdat veel concentraties beneden de detectielimiet lagen. VOLASOIL is een model dat op basis van metingen in verontreinigd grondwater (door vluchtige stoffen), de gerelateerde
binnenluchtconcentratie in gebouwen inschat. In dit onderzoek is gekeken naar de toepasbaarheid van VOLASOIL voor de risicobeoordeling voor vier gechloreerde
verbindingen. Er is een aantal aanpassingsvoorstellen gedaan om de voorspelling van het model te verbeteren. Zo is gebleken dat VOLASOIL voor deze vier stoffen vaak te hoge luchtconcentraties voorspelt, vooral op sterk verontreinigde locaties. Aangezien het model echter vooral wordt gebruikt om de risico’s voor de mens in te schatten en om te zien of meer metingen noodzakelijk zijn, is een beperkte overschatting door het model juist gewenst en zijn aanpassingen niet noodzakelijk. Mocht van het model worden verwacht dat het binnenluchtconcentraties zo nauwkeurig mogelijk inschat, dan zijn de voorgestelde aanpassingen wel gewenst.
Trefwoorden: VOLASOIL; validatie; binnenlucht; bodemlucht; grondwater;
Abstract
Validation of the VOLASOIL model using air measurements from Dutch contaminated sites
Concentrations of four chlorinated compounds
The study reported here has shown the VOLASOIL model to be very useful for estimating the indoor air concentrations of the pollutants, tetrachloroethene and trichloroethene. The model is probably also useful for the degradation products, cis-dichloroethene and
vinylchloride, but this was more difficult to determine with any certainty since many of the concentrations are lower than the detection limit. VOLASOIL is a model that estimates the contamination of indoor air in buildings in relation to measurements based on water
contaminated by volatile substances.This investigation was more concerned with the
applicability of VOLASOIL for four chlorinated compounds in the Netherlands, and resulted in several recommendations for model adjustment. For example, VOLASOIL was found, in the case of the four compounds, to often predict concentrations that were too high, especially in the seriously polluted areas. Considering, however, that the model is used to estimate risks to humans and to ascertain if more measurements are necessary, limited overestimation by the model is all right, making adjustments unnecessary. The proposed adjustments will be desirable if the model needs to be able to predict concentrations as accurately as possible.
Preface
The site specific human risk assessment on contaminated soil is carried out in order to determine the urgency for remediation. In order to improve the methods for this risk
assessment, the Directorate General for the Environment commissioned the National Institute for Public Health and the Environment (RIVM) to carry out a project on the improvement of the site specific human risk assessment. Amongst others, special attention was given to validation of the risk assessment of volatile compounds.
This report gives the results of a validation study on the modelling of (indoor) air
concentrations based on groundwater measurements. First, we would like to thank all the people who have selected suitable cases, which made it possible to perform this study. These cases were obtained from Tauw, Grontmij, Royal Haskoning, DHV, Consultancy of
‘Gemeentewerken Rotterdam’ , Tebodin, Witteveen & Bos and the municipality of Hilversum.
We are very gratefull for the information, advice and remarks provided by the ‘expert group on human-toxicological risk assessment’ (S. Boekhold, TCB; C.J.M. van de Bogaard, VROM-Inspectie; D.H.J. van de Weerdt, HGM Arnhem, T. Fast, Fastadvies; R. van Doorn, GGD Rotterdam; J.E. Groenenberg, Alterra; J. Wezenbeek, Grontmij; J. Tuinstra, Royal Haskoning; R.M.C. Theelen, Ministerie van LNV, S. Dogger (Gezondheidsraad), Th. Vermeire, RIVM-SEC; J. Lijzen, RIVM-LER).
Finally, we would like to thank the members of an expert group on volatile compounds who were asked to comment on the study and to give recommendation for the improvement of the risk assessment: Andi Mayer (Mayer Milieuadvies), Jaap Tuinstra (Royal Haskoning), Job Schreuder (DHV), Jeroen Provoost (VITO, B), Jeroen ter Meer (TNO), Michiel Waitz (Tauw), Joost Bakker, (RIVM). We also owe gratitude to two reviewers for their critical comments on the draft report: Job Spijker (RIVM) and Frank Swartjes (RIVM).
Contents
Samenvatting--- 11
1. Introduction--- 13
1.1 Background ... 13
1.2 Goal and Method ... 13
2. The VOLASOIL model --- 15
2.1 Main concept and distribution over the soil phases ... 15
2.1.1 Assumptions and fluxes ... 15
2.1.2 Flux from soil to crawl space... 16
2.1.3 Crawl space air concentration... 18
2.1.4 Flux from crawl space to indoor air... 18
2.1.5 Indoor air concentration... 18
3. Methods --- 19
3.1 Cases described ... 19
3.2 Generic approach ... 22
3.2.1 Sensitivity and uncertainty analyses ... 22
3.2.2 Monte Carlo Analyses ... 23
3.3 Case by case approach ... 24
3.3.1 Concentrations ... 24
3.3.2 Ratios ... 26
4. Results--- 27
4.1 Sensitivity and uncertainty analysis... 27
4.1.1 Sensitivity analysis ... 27
4.1.2 Uncertainty analysis... 27
4.2 Generic approach ... 30
4.3 Case by case approach ... 35
4.4 Case by case approach: conclusions ... 46
4.5 Case by case: ratios... 48
5. Discussion and conclusion --- 51
5.1 Discussion ... 51
5.2 Conclusions ... 55
5.3 Recommendations based on this study... 55
5.4 Recommendations based on discussions with experts ... 56
References --- 57
Appendix 1 Input parameter distributions and ranges--- 59
Appendix 2 Observed and predicted air concentrations (in g/m3) in indoor, crawl space and soil of tetrachloroethene---61
Samenvatting
Dit rapport bevat een vergelijking tussen wat het VOLASOIL model voorspelt aan binnenluchtconcentraties van vluchtige stoffen en wat er in een aantal praktijkgevallen is gemeten. Met deze vergelijking kan worden bekeken in hoeverre het model overeenkomt met de metingen en welke factoren de verschillen zouden kunnen verklaren. Verder zijn er
aanbevelingen gedaan om het model te verbeteren. De belangrijkste conclusie van het onderzoek is dat het model de luchtconcentratie van tetrachlooretheen en trichlooretheen in het algemeen redelijk goed voorspelt. Het model voorspelt echter minder goed bij hoge en zeer lage grondwaterconcentraties, dus in sterk verontreinigde gebieden en in gebieden waar de concentratie dicht bij de detectielimiet ligt. Op sterk verontreinigde locaties schat het model de luchtconcentratie te hoog in ten opzichte van de metingen, terwijl het op licht verontreinigde locaties de concentratie te laag inschat. Dit hoeft geen probleem te zijn als uitgegaan wordt van een ‘worst-case’ scenario, omdat de werkelijke concentraties in sterk verontreinigde locaties nooit hoger zullen zijn dan op basis van het model wordt voorspeld. Als echter een zo realistisch mogelijke luchtconcentratie moet worden berekend, dan zou een aanpassing van het model gewenst zijn. Er worden in dit rapport een aantal factoren
behandeld die van belang zijn bij het gebruik van dit model. Zo kan afbraak in de bodem een belangrijke rol spelen, is de heterogeniteit in de bodem en het grondwater van belang en is het type gebouw en het seizoen van invloed op de uitkomst. Met al deze factoren moet rekening worden gehouden om een goede risicobeoordeling te kunnen doen. Op basis van de conclusies en bespreking van de resultaten met deskundigen zijn aanbevelingen gedaan voor aanpassing en gebruik van het model.
1.
Introduction
1.1
Background
This study is carried out to support the improvement of the site specific human risk
assessment of groundwater contamination. The risk assessment should help to determine the need for remediation as a result of groundwater pollution.
For the risk assessment of volatile compounds in soil and groundwater, human exposure models are used to estimate the concentrations in indoor air. In the current remediation urgency method (in Dutch: ‘Saneringsurgentie systematiek’: SUS (Koolenbrander, 1995)), the CSOIL model is used. Also, the VOLASOIL model (Waitz et al., 1996) is developed and in use since 1996. The VOLASOIL model was specifically developed to carry out site specific risk assessment of volatile compounds in groundwater. The current (revised) CSOIL model (Otte et al., 2001) is similar to the VOLASOIL-model. The VOLASOIL model will be briefly described in chapter 2.
The intended new Dutch soil policy includes a (further) shift to fitness for use (VROM, 2003). This means that the site specific risk assessment will gain importance. In Lijzen et al. (2003) objectives were defined for further improvement of the site specific risk assessment. One part of the human risk assessment is the exposure to soil and groundwater contamination with volatile compounds. Lijzen et al. (2003) describes the limitations concerning the
methodology within the evaluation of the SUS, with a focus on the site specific risk
assessment for humans and for contaminant migration. Based on interviews with experts and earlier evaluations of the method, the main limitations were indicated as:
a) Uncertainty about the methodology of human risk assessment for inhalation of indoor air. b) A Lack of human risk assessment of volatile compounds in buildings with a
slab-on-grade floor (a concrete floor directly on the soil, with no crawl space or cellar). c) Comparison of results from model calculations versus measurements.
d) A lack of pragmatic guidelines for additional measurements (bioavailability, indoor air).
1.2
Goal and Method
In order to improve the quality of the assessment it is necessary to get more insight in the uncertainties of the risk assessment of volatile compounds. A study to identify the differences between modelled and measured air concentrations in buildings was carried out. Although the practical experience was that in general the model seems to overestimate the air
concentrations, no systematic validation or verification of the model was available. The goal of this study is to get an indication of the amount of uncertainty of the model predictions in relation to measurements. To achieve this, the model is verified with actual measured field data, which is described in this report. Besides knowledge about differences and similarities of predicted and measured concentrations, factors were identified that may cause these differences. The results of this study have lead to recommendations on the improvement of the model, the use of the model and/or the use of measurements.
The following topics will be dealt with:
1) What is the effect of uncertainty/variability in model-input parameters on the variability of predicted air concentrations, and how does this relate to the measured variability of air concentrations?
2) How do measurements of air concentrations relate to calculated concentrations for several cases in the Netherlands?
3) How do the measured and calculated ratios of concentrations in different air compartments relate to each other (e.g. the ratio of indoor air and crawl space air concentration)?
4) What can explain the observed differences between measured and calculated concentrations and ratios?
Two approaches are used. To obtain a first impression of systematic differences between measured and calculated concentrations, a general approach was used. Variability in predicted indoor-air concentrations is quantified by varying the most relevant model-input parameters based on literature and field data. The overall model-output distributions of air concentrations were compared to the measured air distributions of the selected cases. In the second approach, a more site specific analysis was done in order to quantify and
explain whether measurements at certain sites differ more from predictions than at other sites. In chapter 2 a short description of the VOLASOIL model is given.
Chapter 3 describes how the calculations and the interpretation of the measurements was carried out for the two approaches.
Chapter 4 gives the generic and the site-specific results.
The results are discussed in chapter 5 and the possible sources of the observed differences are described.
2.
The VOLASOIL model
The VOLASOIL model was developed in 1996 and is described in detail by Waitz et al. (1996). Based on the CSOIL model, the volatilisation in VOLASOIL from groundwater to indoor air was adapted to perform more site specific risk assessments.
The VOLASOIL model is developed to estimate the actual human risk for volatile
compounds. Calculation with this model is often combined with measurements in the indoor and crawl-space air, when the calculations indicate that the Tolerable Concentration in Air (TCA) is exceeded.
The following steps can be distinguished in the model:
• Calculation of the concentration in soil air (for different contamination scenario’s); • Calculation of the flux to the crawl space;
• Calculation of the crawl space air concentration;
• Calculation of the flux from the crawl space to the indoor air; • Calculation of the indoor air concentration.
In the following paragraph these steps are explained.
2.1
Main concept and distribution over the soil phases
2.1.1 Assumptions and fluxes
The VOLASOIL model is based on stationary transport and has, to some extend, the same assumptions and limitations as the CSOIL module:
• no biological degradation is included;
• the contaminant source in a soil is considered inexhaustible; • the soil is assumed to be homogeneous;
• equilibrium sorption at the depth of the contamination, but above this, no (non-equilibrium) sorption is assumed;
• no lateral transport or leaching is considered.
A distinction has been made between the groundwater, the full capillary zone and the open capillary zone, separated by the groundwater table and the capillary transition boundary, CTB, respectively (Figure 2.1). Two important transport processes are modelled in the open capillary zone:
• diffusion in soil air.
• pressure driven vapour flow.
Diffusion and dispersion in pore water, and the convective transport by water flow are the most important transport mechanisms below the CTB.
Total soil flux (to atmosphere) Boundary layer Soil surface Air Soil Diffusion flux (Air) Diffusion flux (Water)
Open capillary zone
Full capillary zone
Groundwater zone Convection flux (Air) Dispersion flux (Water) Convection flux (Water) Groundwater table Capillary transition boundary
Boundary layer flux
Figure 2.1 Zones and fluxes in the soil within VOLASOIL. The fluxes in bold are incorporated in VOLASOIL.
Eight options can be distinguished in VOLASOIL. Option A (groundwater contamination, well-mixed container) is the basic scenario and is closest to the assumptions within the CSOIL module. Within VOLASOIL the depth of the groundwater table can be changed, just like other site specific parameters. For the calculations of fluxes to the soil surface it is important to know the height of the CTB above the groundwater table. For the 18 soils of the Staring series (Wösten et al., 1994) the CTB lies between 12 and 84 cm. The arithmetic mean for all soils is 50 cm, just like for sandy soil. More details can be found in Waitz et al. (1996).
Soil air concentration
The concentration in the soil air at the capillary transition boundary is calculated by:
sw lw
sa K C
C = ⋅ (1)
Csa : soil-air concentration [g/m3]
Klw : air-water distribution coefficient or dimensionless Henry constant
[(mol/m3 air)/(mol/m3 water)] [-]
Csw : soil-moisture concentration [g/m3]
The soil air concentration at other depths can be calculated also. It is assumed that the measured groundwater concentration and the soil moisture concentration are equal. The dimensionless Henry constant (Klw=H/R·T) is normalised for the average soil temperature of
10ºC.
2.1.2 Flux from soil to crawl space
Two fluxes are calculated in the open capillary zone: • diffusion in soil air (diffusive transport).The diffusion flux is described as: Jd D C L ss sa sa s = (2)
Jdss : diffusion flux from soil to soil surface [g/m2 h]
Dsa : diffusion coefficient in the soil air [m2/h]
Csa : concentration in soil air at dp (depth of contaminant) [mol/dm3 or g/m3]
Ls : magnitude of soil column (= dp-dc; average depth of
contaminant - depth of crawl space below soil surface) [m]
The average depth of the contaminant (dp) is assumed to be equal with the CTB. The diffusion coefficient in soil air (Dsa) is derived from the diffusion coefficient in free air (Da,
based on the molecular weight), the volume fraction of soil air (Va) and volume fraction of
pore water (Vw). These are identical to the calculated parameters in CSOIL.
Second, the pressure-driven air flow in VOLASOIL is described as:
Fsc K p L s cs s = Δ (3)
Fsc : air flux from soil to crawl space [m3/m2.h]
Ks: air conductivity of soil [m2/Pa.h]
ΔPcs : air pressure difference between crawl space and soil [Pa]
Ls : magnitude of soil column (= dp-dc; average depth of
contaminant - depth of crawl space below soil surface) [m]
The factor Ks, the air conductivity, depends on the air permeability (κ) and the dynamic
viscosity of air (η):
Ks =
κ
η (4)
The air permeability of different soils is found in several references with a range of 10-10 - 10-16 m2, from coarse sand to clay (Waitz et al., 1996).
The total contaminant flux to the crawl space is a combination of the convective flux and the diffusive flux, which are closely related. Therefore one equation is derived from the
equations for diffusion and convection. With a negligibly low concentration (zero) at the surface (C0) as an upper boundary condition, the flux from soil to crawl space (J1) is
described by: 1 exp 1 − ⎟⎟ ⎠ ⎞ ⎜⎜ ⎝ ⎛ − ⋅ − = s sa sa L D Fsc C Fsc J (5)
J1 : total contaminant flux from soil to crawl space [g/m2.h]
Fsc : air flux from soil to crawl space [m3/m2.h]
Csa : concentration in soil air at dp [mol/dm3 or g/m3]
Ls : magnitude of soil column (= dp-dc; average depth of
contaminant - depth of crawl space below land surface) [m] Dsa : diffusion coefficient in soil air [m2/h]
2.1.3 Crawl space air concentration
The concentration in the crawl space can be calculated from the total contaminant flux from soil to crawl space, the air-exchange rate and the volume of the crawl space, (assuming that the surface area of the crawl space is equal to that of the floor):
c c f ca vv V A J C ⋅ = 1 (6)
Cca : concentration in crawl-space air [g/m3]
J1 : total contaminant flux from soil to crawl space [g/m2.h]
Af : surface area of floor [m2]
Vc : volume of crawl space [m3]
vvc : air-exchange rate of crawl space [h-1]
The air-exchange rate (vvc) used in VOLASOIL was measured by Fast et al. (1987) with a
geometric mean of 1.05 h-1.
2.1.4 Flux from crawl space to indoor air
Within VOLASOIL, an air flux is derived for the flux from the crawl space through the gaps, cracks and holes in the floor. This air flux (Fci) can be estimated by:
f ic of L p n f Fci Δ ⋅ = η π 8 2 (7)
Fci : air flux from crawl space through floor to indoor space [m3/m2.h]
fof : fraction openings in the floor [m2/m2]
η : dynamic viscosity of air [Pa.h] n: number of openings per floor area [m-2]
Δpic : air pressure difference between indoor space and crawl space [Pa]
Lf : floor thickness [m]
The contaminant flux to the indoor air can be estimated as follows:
ca
ci Fci C
Jc = ⋅ (8)
Jcci : convective flux from crawl space to indoor air space [g/m2.h]
Fci : air flux from crawl space to indoor space [m3/m2.h]
Cca: concentration in crawl-space air [g/m3]
2.1.5 Indoor air concentration
The indoor air concentration can be calculated from the total contaminant flux from soil to crawl space, the air-exchange rate and the volume of the crawl space, (assuming that the surface area of the crawl space is equal to that of the floor):
i i f ci ia vv V A Jc C ⋅ = (9)
Cia : indoor air concentration [g/m3]
Jcci : total contaminant flux crawl space to indoor space [g/m2.h]
Af : surface area of floor [m2]
Vi : volume of indoor space [m3]
vvi : air-exchange rate of indoor space [h-1]
The calculation of human exposure is not a part of VOLASOIL; the calculated air concentration is compared with the TCA (Tolerable Concentration in Air) (Waitz et al., 1996).
3.
Methods
3.1
Cases described
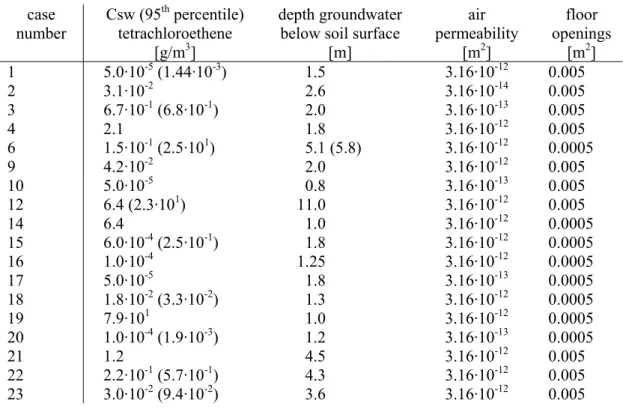
In total 18 cases were selected for the verification (Table 3.1). Four substances were used for this analysis: tetrachloroethene (PER), trichloroethene (TRI), cis-1,2-dichloroethene (CIS) and vinylchloride (VC). BTEX was not selected, since it was measured in a few cases only. The sites are located in several parts of the Netherlands. Not all substances and compartments (indoor, crawl space- and soil-air) were measured at all sites. Also, the number of samples per case differed and the date of sampling was not the same between and within cases. For
instance, in case 21, groundwater was sampled in 1998, whereas soil air was sampled in 1996 and indoor air was sampled in 2000. The main soil type was sand, but some sites were located on clay or peat. The groundwater table varied between 0.8 meter in case 10, and 11 meter in case 12. Some houses had a cellar, whereas others had a crawl space. The type of floor varied between wood and concrete.
The main concern for the data of each case was not only the differences in methodology between cases and the lack of information, but mainly the linking of groundwater measurements with air measurements. In order to be able to compare the measured and
calculated air concentrations, corresponding groundwater concentrations were needed as input for VOLASOIL. Therefore, the groundwater wells closest to the locations of the air
measurements were selected and used for the verification. At first we selected the wells within 5 meter distance. If there were no wells within this distance, a distance of 10 meter was used. If there were still no wells within 10 meter distance, wells within 25 meter distance were selected. This occurred only once. The data from the most shallow groundwater
Table 3.1 Description of the selected cases, where No. = the number of measurements.
Case nr VC Cis Tri Per Location
number of houses
measured basement type floor material No. date No. date No. date No. date depth (m)
organic matter
content soil type
01 x x x Zwanenburg 18 crawlspace wood - - 12 Jun 2000 9 Jun 2000 24 1998-2000 1.5 ? sandy soil; moderately coarse with peat and clay underneath
02 x x x x Terneuzen 2 crawlspace wood 2 Sep 2002 2 Sep 2002 2 Sep 2002 1 Jun 2002 2.58 0.2-2 % clay until 2-3 m deep
03 x x x x Uithuizen 1 ? wood - - 4 Feb/Aug 1995 4 Feb/Aug 1995 5 1996 1.6-2.7 0.50% sandy soil, very fine, locally sandy clay
04 x Zwolle 2 crawlspace wood - - 2 Feb 1996 2 Feb 1996 1 1992 1.8 ? sandy soil
06 x x x x Deventer - - - 20 Feb 2003 - - - - 8 2003 3.15-5.78 ? sandy soil: fine to moderately coarse
09 x Den Haag 1 cellar concrete - - 1 Aug 2003 1 Aug 2003 2 Jan 2002 2 2% sandy soil, fine to moderately coarse until 10 m deep
10 x x x x Leiden 2 cellar concrete - - 2 Jun 2003 2 Jun 2003 4 Dec 2002 0.8 3% silt to fine sand 0-1 m, clay 1-2 m
12 x x x Hilversum 15 cellar wood 37 Aug 1997 and
Oct 2002
40 1998-2004 31 1998-2004 18 1997, 1998, 2002 11 0.20% sandy soil
14 x x x x Rotterdam 3 crawlspace ? 1 Jul 1996 Nov 1996 Nov 1996 2 Apr 1996 1 0.44% - 1 % upper 3 meter sandy soil (also with lumps of clay/peat); clay/peat (from 3 m until 17 m deep).
15 x x x x Rotterdam 1; 5 sites crawlspace concrete 1 Sep 1998 Sep 1998 Sep 1998 7 1998-1999 1.8 1.5% in sandy soil;
13% in clay; 70% in peat
sandy soil until 2 m deep; clay/peat underneath
16 x x x x Rotterdam 1 crawlspace ? - - 1 July 2002 - - 1 ? 1-1.5 1.1 % in sandy soil,
30-80% in clay and peat
upper 3 meter sandy soil (also with clay/peat); clay/peat (from 3 m until 17 m deep).
17 x x x Rotterdam 1 crawlspace concrete - - 1 Aug 2002 1 Aug 2002 1 Oct 2001 1.8 1-3 % in upper layer.
6 % underneath
sandy soil until 2 m deep; clayey soil underneath
18 x x x x Rotterdam - - - 2 Mar 2002 - - - - 3 7-1-2000 and
19-2-2002
1.3 3% upper 2 meter sandy soil (also with lumps of clay/peat); clay/peat (from 3 m until 17 m deep).
19 x x x Oldenzaal 1; 2 sites crawlspace concrete - - 2 Apr 2002 2 Apr 2002 1 Dec 2001 1 2% sandy soil until 2 m, silt and clay underneath
20 x x x x Rotterdam 2 - concrete on sand - - - - 2 Mar 2001 11 Dec 1999 1.2 1.50% moderately coarse silty sand until 3 m deep; peat underneath
21 x x Venray 1 cellar (2 m deep) concrete 50 cm
thick
1 Nov 1996 1 May 2000 1 May 2000 1 Mar 1998 4.5 1.70% silt - fine sand
22 x x x Hilversum 4 cellar probably concrete 4 Oct 1994 16 Dec 1993 14 Dec 1993 13 1998 and 2002 4.3 < 1 % moderately fine sand until 3 m deep; moderately to very coarse sand with gravel underneath
23 x Hilversum 7 crawlspace wood; concrete at
one house
7 Sep 2001 6 Aug-Oct 2002 3 Aug-Oct 2002 10 Jan 2001 3.6 ? moderately fine sand until 3 m deep; moderately to very coarse sand
General info Houses Air measurements Groundwater
soil air crawlspace air indoor air measurements
Table 3.1 Description of the selected cases (continued).
Case nr VC Cis Tri Per Location
distance house to groundwater measurements pollution also in unsaturated zone? measurement
method indoor air other remarks
01 x x x Zwanenburg 5-10 meter yes, also in
groundwater
diffusion badges Area with upward seepage. When it rains, drainage may occur Horizontal flow of groundwater is approximately 2
m per year in a South to Southwest direction
02 x x x x Terneuzen 10-15 meter ? active carbon
03 x x x x Uithuizen 5-10 meter yes, also in
groundwater
active carbon Degradation from tetrachloroethene towards vinylchloride took place widely spread pollution
04 x Zwolle 5-10 meter ? active carbon Degradation from tetrachloroethene towards vinylchloride took place Concentration Per in groundwater in 1996 has
dropped to approximately a third of the concentration in 1992
06 x x x x Deventer ? ? mobile GC
09 x Den Haag 5 meter no, from
groundwater
active carbon Dune area with infiltration. Aerobic conditions, few degradation products found. In
deeper layers, more degradation takes place, but not beyond Cis.
10 x x x x Leiden 5-10 meter ? active carbon Potentially, a high degree of degradation
12 x x x Hilversum 1-10 meter yes, also in
groundwater
active carbon, mobile GC, badges
Soil air permeability is high, no degradation observed
14 x x x x Rotterdam 5-10 meter yes, also in
groundwater
active carbon Degradation from tetrachloroethene towards vinylchloride has taken place Soil air was measured at 0.7 meter deep
15 x x x x Rotterdam 5 meter yes, also in
groundwater
mobile GC Probably anaerobic circumstances, which makes degradation likely. Pollution has
entered the soil as Per and Tri. Cis and VC are degradation products.
Pollution source underneath the house
16 x x x x Rotterdam 5-10 meter ? ? Very little information available Very little information available
17 x x x Rotterdam 5 meter ? active carbon Very little information available Crawl space is very small
18 x x x x Rotterdam 5-10 meter yes, also in
groundwater
tenax for soil air Probably anaerobic circumstances Soil polluted between 3 and 5 m
19 x x x Oldenzaal 2.5 - 5 meter yes, also in
groundwater
active carbon Degradation from tetrachloroethene towards vinylchloride took place Polluted area underneath private and business
property
20 x x x x Rotterdam 5 meter no, from
groundwater
active carbon Biological degradation is taking place due to high groundwater level (anaerobic) and
high microbiological activity.
Pollution source at 20 m distance; pollution probably adsorbed on the peat.
21 x x Venray < 15 meter no, from
groundwater
active carbon Situated at +26 m NAP (Dutch Ordnance Level); Few degradation products found. No holes in the floor
22 x x x Hilversum 10 meter no, from
groundwater
? No degradation products found; aerobic conditions in the environment. Business area
23 x Hilversum 10 meter no, from
groundwater
active carbon No degradation products found; aerobic conditions in the environment. Low concentration in groundwater
3.2
Generic approach
3.2.1 Sensitivity and uncertainty analyses
Both sensitivity and uncertainty analyses were performed in order to get insight in the model behaviour and in the importance of input parameters. A sensitivity analysis shows the effect of changes of input variables on model predictions, whereas uncertainty analysis shows the importance of the input uncertainties in term of their relative contributions to uncertainty in the outputs (Morgan and Henrion, 1990). For the sensitivity analysis, all parameters that are described in Tables 3.2 and 3.3 are varied one at a time by ± 2 % around the mean (tetrachloroethene was the substance). A uniform distribution is used for all parameters. A Monte Carlo sampling method is used with 200 runs, using the Crystal Ball add-in of Excel. The output air
concentrations are correlated to each parameter and a Normalized Regression Coefficient (NRC) is calculated: i i x x y y NRC = Δ /Δ
Where y is the mean output air concentration and x is the mean input parameter i i
that is varied with Δ , resulting in yxi Δ . The advantage of the NRC is that it is
independent of the scale or dimension of the input parameters (Janssen et al., 1992). It shows the relative change of the model output due to a relative change of a model input.
The uncertainty analysis was performed with a Monte Carlo sampling method, using input uncertainties and distributions that are described in Tables 3.2 and 3.3 for all substances. The ‘sensitivity analysis’ option in Crystal Ball was used. It shows the relative contribution of each input variable to the output variance. The output
uncertainty depends on the sensitivity of the input parameter (see sensitivity analysis) and on the amount of variability of the input parameter.
Table 3.2 Compound specific uncertainty and the type of distribution that was used for the Monte Carlo analysis with all cases together. L=Log-Normal, VP= Vapour pressure (Otte et al., 2001), SOL = Solubility (Otte et al. 2001), Csw = Groundwater concentration (derived from case-data), dg = Depth of groundwater table (derived from case-data).
tetrachloroethene trichloroethene cis-dichloroethene vinylchloride
VP Distribution L L L L
Mean 2500 Pa 9900 Pa 27000 Pa 352196 Pa 95th percentile 2666 Pa 10029 Pa 33000 Pa 381339 Pa
SOL Distribution L L L L
Mean 0.9 mol/m3 8.4 mol/m3 36.1 mol/m3 30.5 mol/m3
95th percentile 2.9 mol/m3 11.2 mol/m3 79.4 mol/m3 44.2 mol/m3
Csw Distribution L L L L Mean 0.7 g/m3 3.9·10-3 g/m3 0.02 g/m3 1.7·10-3 g/m3 95th percentile 33.7 g/m3 0.3 g/m3 6.25 g/m3 2.8·10-2 g/m3 dg Distribution L L L L Mean 5.1 m 3.2 m 2.6 m 2.5 m 95th percentile 11.0 m 11.0 m 11.0 m 5.7 m
Table 3.3 Soil and house specific uncertainty used in VOLASOIL, taken from literature. The type of distribution that was used is given as T for a Triangular distribution and as L for a Lognormal distribution. Ranges are given as minimum and maximum. For more details, see Appendix 1.
Parameter Type Mean Range Remarks
Soil specific
kappa (air permeability of soil) T 3.16·10-12 m2 1.10-12 - 1.10-11
Va (volume fraction air in soil) L 0.2 0.1 – 0.3 correlated with Vs Vs (volume fraction solids in soil) L 0.6 0.4 – 0.8 correlated with Va House specific
vri (ventilation rate indoor space) T 75 m3 h-1 25 – 150
vrcb (basic ventilation rate crawl space) T 24 m3 h-1 8 – 48
Δ Pcs (air pressure difference crawlsp. – soil) T 2 Pa 0 – 6 Δ Pic (air pressure difference indoor – crawlsp.) T 2 Pa 0 – 6
Aof (total area of floor openings) T 0.0005 m2 0.00005 – 0.005
Lf (floor thickness) T 0.1 m 0.05 – 0.2 Af (floor surface area) T 50 m2 30 - 100
3.2.2 Monte Carlo Analyses
A Crystal Ball simulation was done in the VOLASOIL model (version 1.9), where uncertainty/variability in the available input-parameters was introduced for
tetrachloroethene (per), trichloroethene (tri), cis-dichloroethene (cis) and
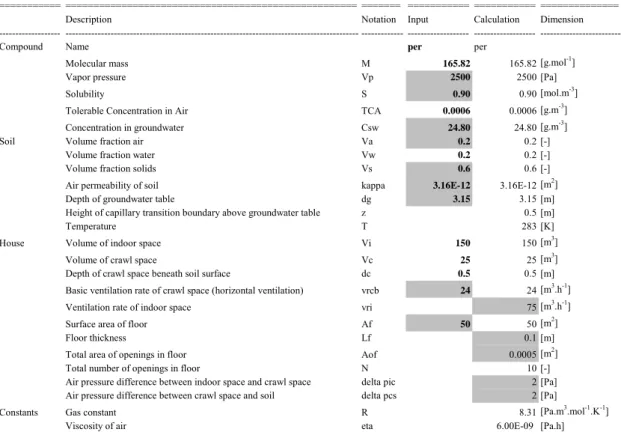
vinylchloride (Tables 3.2 and 3.3). Figure 3.1 gives an idea of how the VOLASOIL spreadsheet version 1.9 is set up. The grey cells are the parameter values that were made variable. The Monte Carlo sampling method was used with 1000 runs. A cumulative distribution of the calculated soil air, crawl space air and indoor air concentration was generated. These distributions were compared with the cumulative distributions of the measured air concentrations. This approach may give a first indication of the systematic differences between measured and calculated air
concentrations for all substances. For a detailed description of the variability in each input-parameter value, see Appendix 2.
A log-normal distribution was used when data were abundant, or when this
distribution was previously used for the same parameter in the literature. Otherwise, a triangle distribution was used. For the input-parameter distributions, only the
groundwater concentration (Csw in Table 3.2) and the depth of the groundwater table (dg) were not taken from literature, but were derived from the case data. Model output distributions were the concentration in soil air at 0.5 meter below soil surface (sa), crawl space air (csa) and indoor air (ia). These parameters are used for the comparison of the model predictions with measured field data.
VOLATILIZATION OF SOIL CONTAMINANTS (VOLASOIL, version 1.9)
Formulas in: M.F.W. Waitz, J.I. Freijer, P. Kreule, F.A. Swartjes (1996): The VOLASOIL risk assessment model based on CSOIL for soils contaminated with volatile compounds. RIVM report no. 715810014. Bilthoven, the Netherlands INPUT
=========== ==================================================== ======= =========== =========== ==============
Description Notation Input Calculation Dimension
--- --- --- --- ---
---Compound Name per per
Molecular mass M 165.82 165.82 [g.mol-1]
Vapor pressure Vp 2500 2500 [Pa]
Solubility S 0.90 0.90 [mol.m-3]
Tolerable Concentration in Air TCA 0.0006 0.0006 [g.m-3]
Concentration in groundwater Csw 24.80 24.80 [g.m-3]
Soil Volume fraction air Va 0.2 0.2 [-]
Volume fraction water Vw 0.2 0.2 [-]
Volume fraction solids Vs 0.6 0.6 [-]
Air permeability of soil kappa 3.16E-12 3.16E-12 [m2]
Depth of groundwater table dg 3.15 3.15 [m]
Height of capillary transition boundary above groundwater table z 0.5 [m]
Temperature T 283 [K]
House Volume of indoor space Vi 150 150 [m3]
Volume of crawl space Vc 25 25 [m3]
Depth of crawl space beneath soil surface dc 0.5 0.5 [m]
Basic ventilation rate of crawl space (horizontal ventilation) vrcb 24 24 [m3.h-1]
Ventilation rate of indoor space vri 75 [m3.h-1]
Surface area of floor Af 50 50 [m2]
Floor thickness Lf 0.1 [m]
Total area of openings in floor Aof 0.0005 [m2]
Total number of openings in floor N 10 [-]
Air pressure difference between indoor space and crawl space delta pic 2 [Pa]
Air pressure difference between crawl space and soil delta pcs 2 [Pa]
Constants Gas constant R 8.31 [Pa.m3.mol-1.K-1]
Viscosity of air eta 6.00E-09 [Pa.h]
Figure 3.1 Illustration of input parameter values in VOLASOIL for Tetrachloroethene (spreadsheet version). Bold values were entered specifically for Per and grey cells were varied with the Crystal Ball add-in of Excel.
3.3
Case by case approach
3.3.1 Concentrations
In a second approach the cases were analysed individually, using VOLASOIL with site specific data. In this way the predicted and measured concentrations are analysed in more detail. The calculated air concentrations were compared with the measured air concentrations in soil, crawl space and indoor air. The most relevant input parameter values were adjusted for each case separately, in order to obtain a site specific result (Table 3.4). Mean groundwater concentration (Csw) and the mean depth of the groundwater table were derived from the case-data, including the standard deviation around the mean.
Table 3.4 Input parameter values in VOLASOIL for each case (Groundwater concentration including 95th percentile between brackets).
case number Csw (95th percentile) tetrachloroethene [g/m3] depth groundwater below soil surface
[m] air permeability [m2] floor openings [m2] 1 5.0·10-5 (1.44·10-3) 1.5 3.16·10-12 0.005 2 3.1·10-2 2.6 3.16·10-14 0.005 3 6.7·10-1 (6.8·10-1) 2.0 3.16·10-13 0.005 4 2.1 1.8 3.16·10-12 0.005 6 1.5·10-1 (2.5·101) 5.1 (5.8) 3.16·10-12 0.0005 9 4.2·10-2 2.0 3.16·10-12 0.005 10 5.0·10-5 0.8 3.16·10-13 0.005 12 6.4 (2.3·101) 11.0 3.16·10-12 0.005 14 6.4 1.0 3.16·10-12 0.0005 15 6.0·10-4 (2.5·10-1) 1.8 3.16·10-12 0.0005 16 1.0·10-4 1.25 3.16·10-12 0.0005 17 5.0·10-5 1.8 3.16·10-13 0.0005 18 1.8·10-2 (3.3·10-2) 1.3 3.16·10-12 0.0005 19 7.9·101 1.0 3.16·10-12 0.0005 20 1.0·10-4 (1.9·10-3) 1.2 3.16·10-13 0.0005 21 1.2 4.5 3.16·10-12 0.005 22 2.2·10-1 (5.7·10-1) 4.3 3.16·10-12 0.005 23 3.0·10-2 (9.4·10-2) 3.6 3.16·10-12 0.005
Mean air permeability was estimated from the case-data also, by using the description of the soil type and data from Waitz et al. (1996; Table 3.5). Total area of floor openings was estimated by qualifying a wooden floor or a cellar as bad floor quality and a concrete floor as normal floor quality. According to Waitz et al. (1996), a bad floor quality contains a total of 0.005 m2 of openings, whereas a normal floor contains 0.0005 m2 of openings. The depth of the groundwater table, the air permeability and the total area of floor openings were not varied, because information on variability within the location of a case was not available for these parameters. Only for case 6 information on the spatial variability of the groundwater level was available. For the other input parameter distributions (compound and house specific data) the same distributions were used as in the generic approach (Tables 3.2 and 3.3). Cases 16 and 17 were not analysed further in Chapter 4.3 due to insufficient background
information which makes interpretation difficult.
Table 3.5 Permeability of soils at field capacity moisture content (Waitz et al., 1996)
Soil Permeability kappa (m2) Coarse sand 10-10 Medium sand 10-10.5 Fine sand 10-11.5 Silty sand 10-12.5 Silt 10-13.5 Clay 10-16
3.3.2 Ratios
Ratios were calculated in order to compare the cases independently from the specific level of concentrations in the groundwater and the air compartments. They give information on the most critical part of the transport from groundwater to indoor air (Figure 3.2). Comparisons between predicted and observed ratios may reveal differences in transport which can lead to suggestions for model improvement. The following ratios were calculated:
R1 = Csam/Csag = Concentration in soil air at 0.5 m below soil surface /
Concentration in soil air near groundwater level
R2 = Ccsam/Csam = Concentration in crawl space air / Concentration in soil air
R3 = Ciam/Ccsam = Concentration in indoor air / Concentration in crawl space air
R4 = Ccsam/Csag = Concentration in crawl space air / Concentration in soil air
near groundwater level
R5 = Ciam/Csam = Concentration in indoor air / Concentration in soil air
R6 = Ciam/Csag = Concentration in indoor air / Concentration in soil air near
groundwater level
Figure 3.2 Scheme, showing the ratio approach. Concentrations of substances measured in indoor-air (Ciam), measured in crawl space-air (Ccsam), measured in soil-air at 0.5 m below soil surface (Csam) and (calculated) soil air at groundwater level (Csag) are used to calculate ratios (R1-6).
groundwater soil crawl space indoor outside air R3
full capillary zone Ciam Ccsam Csam Csag R4 R5 R2 R6 R1 Wall
House
4.
Results
4.1
Sensitivity and uncertainty analysis
4.1.1 Sensitivity analysis
A sensitivity analysis was performed to show the sensitivity of the model parameters in relation to the calculated indoor air, crawl space air and soil air concentration, independent of the actual uncertainty or variability. The sensitivity analysis of the VOLASOIL model showed that depth of the groundwater table (dg) was the most sensitive parameter for all compartments (Table 4.1). An increase of 1% in the depth of the groundwater table, resulted in a decrease of more than 3% in the air
concentration (a negative NRC value means a negative regression coefficient). For the indoor air compartment, the total area of floor openings (Aof) is also a sensitive parameter. Other parameters show a NRC that is less than or equal to one, which means that a change of 1% in the parameter value results in a change of 1% or less in the air concentration.
4.1.2 Uncertainty analysis
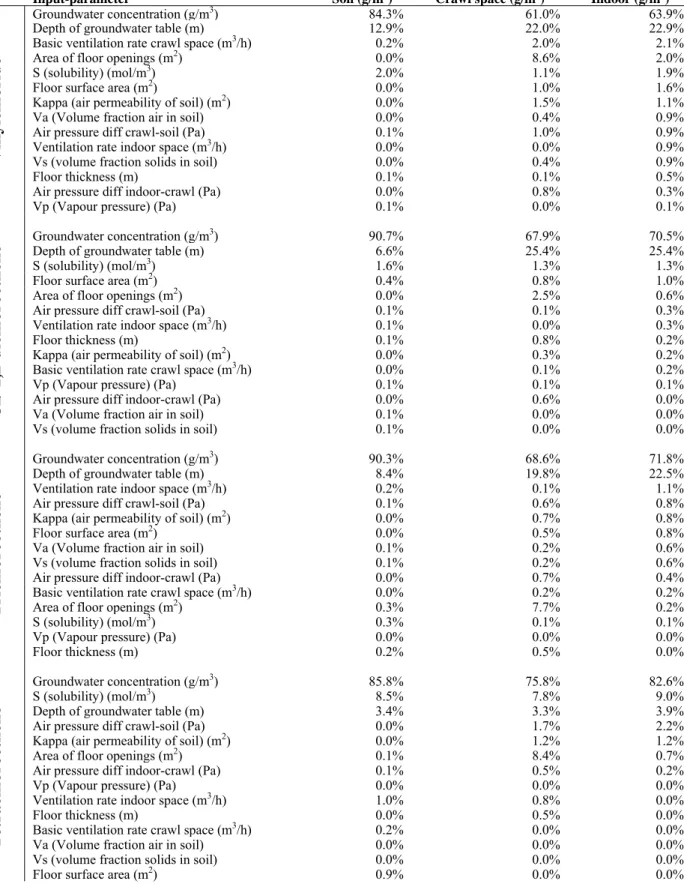
The uncertainty analysis shows the contribution of input uncertainty to uncertainty (variability) in the output air concentrations. The larger the uncertainty in a (sensitive) input parameter, the larger the uncertainty in the output and therefore the larger the contribution of this input parameter to the total output uncertainty. In this case, not only the sensitivity of the parameters is important, but also the amount of input-uncertainty. Most of the variation in predicted air concentration could be attributed to the variation in the groundwater concentration, and to a lesser extent to the depth of the groundwater table (Table 4.2). Other input parameters did not contribute much to the output-variation, although the solubility was relatively important for the air concentration of tetrachloroethene. The data show that uncertainty in the groundwater concentration is high due to high spatial variation, both horizontally and vertically.
Table 4.1 Ranked results of VOLASOIL sensitivity analysis for Tetrachloroethene in indoor air, crawl space air and soil air, using the Normalized Regression Coefficient (NRC)
Input-parameter Code Units NRC indoor
Depth of groundwater table dg m -3.0141 Total area of openings in floor Aof m2 1.6731
Depth of crawl space beneath soil surface dc m 1.0004 Concentration in groundwater Csw g/m3 1.0000
Surface area of floor Af m2 1.0000
Vapor pressure Vp Pa 1.0000
Height of capillary transition boundary above groundwater table z m 0.9999
Solubility S mol/m3 -0.9986
Ventilation rate of indoor space vri m3/h -0.9570
Basic ventilation rate of crawl space (horizontal ventilation) vrcb m3/h -0.8758
Total number of openings in floor N - -0.8377 Air pressure difference between indoor space and crawl space Δ pic Pa 0.8362
Floor thickness Lf m -0.8356
Air pressure difference between crawl space and soil Δ pcs Pa 0.5639 Air permeability of soil kappa m2 0.5633
Molecular mass M g/mol -0.2182
Volume of crawl space Vc m3 0.0000
Volume of indoor space Vi m3 0.0000
Parameter Code NRC crawlsp.
Depth of groundwater table dg m -3.0141 Depth of crawl space beneath soil surface dc m 1.0004 Concentration in groundwater Csw g/m3 1.0000
Surface area of floor Af m2 1.0000
Vapor pressure Vp Pa 1.0000
Height of capillary transition boundary above groundwater table z m 0.9999
Solubility S mol/m3 -0.9982
Basic ventilation rate of crawl space (horizontal ventilation) vrcb m3/h -0.8758
Air pressure difference between crawl space and soil Δ pcs Pa 0.5639 Air permeability of soil kappa m2 0.5633
Total area of openings in floor Aof m2 -0.2425
Molecular mass M g/mol -0.2182
Total number of openings in floor N - 0.1215
Floor thickness Lf m 0.1213
Air pressure difference between indoor space and crawl space Δ pic Pa -0.1213 Ventilation rate of indoor space vri m3/h 0.0000
Volume of crawl space Vc m3 0.0000
Volume of indoor space Vi m3 0.0000
Parameter Code NRC soil
Depth of groundwater table dg m -1.5029
Vapor pressure Vp Pa 1.0000
Concentration in groundwater Csw g/m3 0.9999
Solubility S mol/m3 -0.9982
Height of capillary transition boundary above groundwater table z m 0.5001 Air permeability of soil kappa m2 0.0000
Air pressure difference between crawl space and soil Δ pcs Pa 0.0000 Air pressure difference between indoor space and crawl space Δ pic Pa 0.0000 Basic ventilation rate of crawl space (horizontal ventilation) vrcb m3/h 0.0000
Depth of crawl space beneath soil surface dc m 0.0000
Floor thickness Lf m 0.0000
Molecular mass M g/mol 0.0000
Surface area of floor Af m2 0.0000
Total area of openings in floor Aof m2 0.0000
Total number of openings in floor N - 0.0000 Ventilation rate of indoor space vri m3/h 0.0000
Volume of crawl space Vc m3 0.0000
Table 4.2 Crystal Ball uncertainty analysis. Percentage of variation in the output-parameter that was caused by the variation in each input-parameter.
Input-parameter Soil (g/m3) Crawl space (g/m3) Indoor (g/m3)
Groundwater concentration (g/m3) 84.3% 61.0% 63.9%
Depth of groundwater table (m) 12.9% 22.0% 22.9%
Basic ventilation rate crawl space (m3/h) 0.2% 2.0% 2.1%
Area of floor openings (m2) 0.0% 8.6% 2.0%
S (solubility) (mol/m3) 2.0% 1.1% 1.9%
Floor surface area (m2) 0.0% 1.0% 1.6%
Kappa (air permeability of soil) (m2) 0.0% 1.5% 1.1%
Va (Volume fraction air in soil) 0.0% 0.4% 0.9%
Air pressure diff crawl-soil (Pa) 0.1% 1.0% 0.9%
Ventilation rate indoor space (m3/h) 0.0% 0.0% 0.9%
Vs (volume fraction solids in soil) 0.0% 0.4% 0.9%
Floor thickness (m) 0.1% 0.1% 0.5%
Air pressure diff indoor-crawl (Pa) 0.0% 0.8% 0.3%
Vinylchloride
Vp (Vapour pressure) (Pa) 0.1% 0.0% 0.1%
Groundwater concentration (g/m3) 90.7% 67.9% 70.5%
Depth of groundwater table (m) 6.6% 25.4% 25.4%
S (solubility) (mol/m3) 1.6% 1.3% 1.3%
Floor surface area (m2) 0.4% 0.8% 1.0%
Area of floor openings (m2) 0.0% 2.5% 0.6%
Air pressure diff crawl-soil (Pa) 0.1% 0.1% 0.3%
Ventilation rate indoor space (m3/h) 0.1% 0.0% 0.3%
Floor thickness (m) 0.1% 0.8% 0.2%
Kappa (air permeability of soil) (m2) 0.0% 0.3% 0.2%
Basic ventilation rate crawl space (m3/h) 0.0% 0.1% 0.2%
Vp (Vapour pressure) (Pa) 0.1% 0.1% 0.1%
Air pressure diff indoor-crawl (Pa) 0.0% 0.6% 0.0%
Va (Volume fraction air in soil) 0.1% 0.0% 0.0%
Cis-1,2-dichloroethene
Vs (volume fraction solids in soil) 0.1% 0.0% 0.0%
Groundwater concentration (g/m3) 90.3% 68.6% 71.8%
Depth of groundwater table (m) 8.4% 19.8% 22.5%
Ventilation rate indoor space (m3/h) 0.2% 0.1% 1.1%
Air pressure diff crawl-soil (Pa) 0.1% 0.6% 0.8%
Kappa (air permeability of soil) (m2) 0.0% 0.7% 0.8%
Floor surface area (m2) 0.0% 0.5% 0.8%
Va (Volume fraction air in soil) 0.1% 0.2% 0.6%
Vs (volume fraction solids in soil) 0.1% 0.2% 0.6%
Air pressure diff indoor-crawl (Pa) 0.0% 0.7% 0.4%
Basic ventilation rate crawl space (m3/h) 0.0% 0.2% 0.2%
Area of floor openings (m2) 0.3% 7.7% 0.2%
S (solubility) (mol/m3) 0.3% 0.1% 0.1%
Vp (Vapour pressure) (Pa) 0.0% 0.0% 0.0%
Trichloroethene
Floor thickness (m) 0.2% 0.5% 0.0%
Groundwater concentration (g/m3) 85.8% 75.8% 82.6%
S (solubility) (mol/m3) 8.5% 7.8% 9.0%
Depth of groundwater table (m) 3.4% 3.3% 3.9%
Air pressure diff crawl-soil (Pa) 0.0% 1.7% 2.2%
Kappa (air permeability of soil) (m2) 0.0% 1.2% 1.2%
Area of floor openings (m2) 0.1% 8.4% 0.7%
Air pressure diff indoor-crawl (Pa) 0.1% 0.5% 0.2%
Vp (Vapour pressure) (Pa) 0.0% 0.0% 0.0%
Ventilation rate indoor space (m3/h) 1.0% 0.8% 0.0%
Floor thickness (m) 0.0% 0.5% 0.0%
Basic ventilation rate crawl space (m3/h) 0.2% 0.0% 0.0%
Va (Volume fraction air in soil) 0.0% 0.0% 0.0%
Vs (volume fraction solids in soil) 0.0% 0.0% 0.0%
Tetrachloroethene
4.2
Generic approach
All measured air concentrations together were compared to predictions (Figures 4.1a and 4.1b). The mean measured air concentration was approximately one order of magnitude lower than the predicted distribution for tetrachloroethene, with equal variation around the mean (Figure 4.1a). For trichloroethene, differences for indoor air and crawl space air were smaller and measured concentrations were lower than predicted, when detection-limits were not taken into account (open symbols). Soil air concentrations were higher than predicted for trichloroethene. Patterns were easier to interpret for tetrachloroethene than for the other substances, where many
concentrations were below the detection limit.
0 20 40 60 80 100
1.0E-07 1.0E-06 1.0E-05 1.0E-04 1.0E-03 1.0E-02 1.0E-01 1.0E+00 1.0E+01 1.0E+02 Tetrachloroethene in air (g/m3) C u m u la ti ve o c cu rr e n ce ( % )
soil air model crawlspace air model indoor air model soil air < detection limit crawlspace air < detection limit indoor air < detection limit soil air crawlspace air indoor air TCA 0 20 40 60 80 100
1.0E-11 1.0E-09 1.0E-07 1.0E-05 1.0E-03 1.0E-01 1.0E+01
Trichloroethene in air (g/m3) C u mu la ti ve o c cu rr en ce ( % ) TCA
TCA = Tolerable Concentration in Air
Figure 4.1a Cumulative distributions of indoor-air concentrations, derived from measurements (symbols) and predictions by the VOLASOIL model (lines), for Per and Tri. Detection limits are indicated with open symbols.
The results for cis 1,2-dichloroethene (cis) and vinylchloride are difficult to interpret due to the large amount of measurements that fall below the detection limit (Figure 4.1b). Measured soil air concentrations are in general well predicted, while indoor and crawl space air concentrations are overestimated by the model. Indoor air and crawl space air differences were larger for these substances than for per and tri. So, the aboveground model prediction for the air concentration of cis and vinylchloride is less accurate than for per and tri.
0 20 40 60 80 100
1.0E-10 1.0E-08 1.0E-06 1.0E-04 1.0E-02 1.0E+00 1.0E+02
cis-1,2-dichloroethene in air (g/m3) C u mu la ti ve o ccu rr e n ce ( %
) soil air model
crawlspace air model indoor air model soil air < detection limit crawlspace air < detection limit indoor air < detection limit soil air crawlspace air indoor air TCA 0 20 40 60 80 100
1.0E-09 1.0E-08 1.0E-07 1.0E-06 1.0E-05 1.0E-04 1.0E-03 1.0E-02 1.0E-01 1.0E+00
Vinylchloride in air (g/m3) C u m u la tive o c cu rr en ce (% ) CRinhal
CRinhal = 1:10-4 lifetime excess cancer risk inhalation
TCA = Tolerable Concentration in Air
Figure 4.1b Cumulative distributions of indoor-air concentrations, derived from measurements in the selected cases (symbols) and predictions by the VOLASOIL model (lines), for cis 1,2-dichloroethene and vinylchloride. Detection limits are indicated with open symbols.
Considering median values with confidence intervals for predicted and measured indoor air concentrations, the overlap between observed and predicted concentrations was large for all substances (Figure 4.2). When predictions fall below the detection limit (dashed line in the figure), observed concentrations are generally higher than predicted. If not, the median observed values are systematically lower than predicted, except for the soil compartment. Overall, this indicates that the VOLASOIL model overestimates air concentrations for indoor air and crawl space air. This pattern becomes less clear when concentrations are low.
Figure 4.2 Median values and confidence limits of air concentrations for all cases (dispersion factor k was used; 95 % of the values is within a factor k from the median, see Slob 1994). Dashed line indicates mean detection limit. ia_o =observed indoor air concentration from measurements; ia_p = predicted indoor air concentration; csa_o = observed crawl space air concentration; csa_p =
predicted crawl space air concentration; sa_o = observed soil air concentration; sa_p = predicted soil air concentration. Per 1.0E-07 1.0E-06 1.0E-05 1.0E-04 1.0E-03 1.0E-02 1.0E-01 1.0E+00 1.0E+01 1.0E+02
ia_o ia_p csa_o csa_p sa_o sa_p
ai r c onc en tr at ion ( g /m 3) Tri 1.0E-10 1.0E-09 1.0E-08 1.0E-07 1.0E-06 1.0E-05 1.0E-04 1.0E-03 1.0E-02 1.0E-01 1.0E+00
ia_o ia_p csa_o csa_p sa_o sa_p
ai r co n cen tr at io n ( g /m 3) Cis 1.0E-10 1.0E-09 1.0E-08 1.0E-07 1.0E-06 1.0E-05 1.0E-04 1.0E-03 1.0E-02 1.0E-01 1.0E+00 1.0E+01
ia_o ia_p csa_o csa_p sa_o sa_p
ai r co n cen tr at io n ( g /m 3) Vc 1.0E-09 1.0E-08 1.0E-07 1.0E-06 1.0E-05 1.0E-04 1.0E-03 1.0E-02 1.0E-01 1.0E+00
ia_o ia_p csa_o csa_p sa_o sa_p
ai r co n ce n tr at io n ( g /m 3)
Groundwater concentration effects
The tetrachloroethene concentration in air is positively related to the groundwater concentration of tetrachloroethene for all compartments (Figure 4.3, thick black line). These relationships are significant at the 95% confidence level.
soil air r2 = 0.3924, n=78 1.0E-06 1.0E-05 1.0E-04 1.0E-03 1.0E-02 1.0E-01 1.0E+00 1.0E+01 1.0E+02
1.0E-02 1.0E+00 1.0E+02 1.0E+04 1.0E+06
Per in groundwater (μg/l) P e r in s o il a ir (g /m 3) measured < dl model geomean Regression measured data
crawlspace air r2 = 0.2647, n=87 1.0E-08 1.0E-07 1.0E-06 1.0E-05 1.0E-04 1.0E-03 1.0E-02 1.0E-01 1.0E+00
1.0E-02 1.0E+00 1.0E+02 1.0E+04 1.0E+06
Per in groundwater (μg/l) P er in cr aw ls p ace ai r (g /m 3) indoor air r2 = 0.2219, n=73 1.0E-09 1.0E-08 1.0E-07 1.0E-06 1.0E-05 1.0E-04 1.0E-03 1.0E-02
1.0E-02 1.0E+00 1.0E+02 1.0E+04 1.0E+06
Per in groundwater (μg/l) Pe r i n indoo r a ir ( g /m 3)
Figure 4.3 Air concentrations of tetrachloroethene in relation to groundwater concentration for measured field data (symbols) and the VOLASOIL model (thin line). Detection limits were
incorporated in the linear regression analysis (thick line). Model variation (min and max- dotted lines) was caused by variation in the depth of the groundwater table.
The model predicted a steeper slope for all compartments than the actual field data showed, especially for the aboveground compartments. This indicates that the model might
underestimate air concentrations of tetrachloroethene at low groundwater concentration, and overestimates air concentrations at high groundwater concentration. This may be due to an artefact in the model. It may also be that other sources influence the indoor air concentration at low groundwater concentrations. At high groundwater concentrations there may be an unknown barrier to prevent high indoor air concentrations. These trends also become apparent in section 4.3, where cases were investigated in more detail. The regression coefficients of the other substances (trichloroethene, cis-1,2-dichloroethene and
vinylchloride) were not significantly different from zero. The correlation coefficient of the soil air compartment for these substances was higher (a steeper slope) than for the other compartments, similar to tetrachloroethene.
Indoor air – crawl space air
When analysing differences between indoor air and crawl space air concentrations for all substances, it was striking that differences were larger when crawl space air concentrations were higher (Figure 4.4). At low concentrations, crawl space values were equal to indoor values. At high crawl space air concentrations, the indoor air concentration approached the predicted value. This, again, shows that the model underestimates at low concentrations (see also Figure 4.3). The model assumes a concentration gradient from crawl space air towards indoor air. These results suggests that this gradient is only present at higher concentrations. Trends were similar for all house categories (cellar, crawl space with concrete floor and crawl space with wooden floor).
Figure 4.4 Concentration in crawl space and indoor air for measured data (symbols) and model predictions (dashed line). The dotted line shows when crawl space air concentration equals indoor air concentration. The solid line is the result of linear regression analysis. The gray areas represent the area with detection limits.
Cis-1,2-dichloroethene r2 = 0.6381, n=21 1.0E-07 1.0E-06 1.0E-05 1.0E-04 1.0E-03
1.0E-07 1.0E-06 1.0E-05 1.0E-04 1.0E-03
crawlspace air (g/m3) indoor ai r ( g /m 3) model Y = X Tetrachloroethene r2 = 0.641, n=64 1.00E-07 1.00E-06 1.00E-05 1.00E-04 1.00E-03 1.00E-02 1.00E-01 1.00E+00
1.0E-07 1.0E-06 1.0E-05 1.0E-04 1.0E-03 1.0E-02 1.0E-01 1.0E+00
crawlspace air (g/m3) in d o o r a ir ( g /m 3 ) model Y = X T richloroethene r2 = 0.5625, n=44 1.0E-07 1.0E-06 1.0E-05 1.0E-04 1.0E-03
1.0E-07 1.0E-06 1.0E-05 1.0E-04 1.0E-03
crawlspace air (g/m3) in d o o r a ir (g /m 3 ) model Y = X Vinylchloride r2 = 0.6895, n=16 1.0E-07 1.0E-06 1.0E-05 1.0E-04 1.0E-03
1.0E-07 1.0E-06 1.0E-05 1.0E-04 1.0E-03
crawlspace air (g/m3) indoo r a ir ( g /m 3 ) m odel Y = X
4.3
Case by case approach
Here we present in more detail the results of case-by-case comparisons between observed and predicted concentrations. The results focus on tetrachloroethene only, since most of the data are available for this substance and the amount of detection limits is low. Information in Table 3.1 was used to draw preliminary conclusions on the possible cause for the observed differences. The predicted uncertainty in the following graphs of section 4.3 is the 95 % confidence limits around the mean. The dotted line in the graphs is the mean detection limit. Also, ia_o = observed indoor air concentration from measurements; ia_p = predicted indoor air concentration; csa_o = observed crawl space air concentration; csa_p = predicted crawl space air concentration; sa_o = observed soil air concentration; sa_p = predicted soil air concentration.
Case 01
Type of contamination: The groundwater is contaminated with chlorinated compounds over an area of roughly 100 by 100 meter, with a heterogenic horizontal and vertical distribution. Some sources of contamination are identified and it is likely that more companies contributed to the contamination. Both tetrachloroethene and trichloroethene were present as
contaminant.
Soil type: The groundwater level is about 1.5 meter below soil surface. The top soil consists of moderately coarse sand or humus clayey sand.
Type of building: Most of the houses have crawl spaces.
Measurements: both in indoor air and/or crawl space air. Soil air was not analysed. Passive as well as active measurements were carried out.
Results: The comparison of the predicted and measured concentrations of tetrachloroethene show that both in indoor air and crawl space air the measured concentrations are higher than the calculated concentrations. A large heterogeneity of the groundwater concentrations is observed. Concentrations in the deeper groundwater were much higher than in the top meter of the groundwater. A reason for the observed differences could be that the groundwater concentrations near the houses (< 10 meter) were relatively low, compared to other area’s on the site, or that other unknown sources were present. Further analysis is necessary to explain the results. Per - case 1 1.0E-10 1.0E-09 1.0E-08 1.0E-07 1.0E-06 1.0E-05 1.0E-04 1.0E-03 1.0E-02 ai r co n cen tr at io n ( g /m 3) ia_o ia_p csa_o csa_p sa_o sa_p
Case 02
Type of contamination: The groundwater is contaminated with chlorinated compounds with in principle one hotspot due to leakage of the sewage pipe of a dry cleaner business. The contaminated soil was already excavated, and the groundwater was under remediation. Tetrachloroethene was probably used.
Soil type: The groundwater level is about 2.5 meter below soil surface. The top soil consists of a clayey soil.
Type of building: the air concentrations in 2 houses with crawl spaces have been measured. Measurements: indoor air, crawl space air and soil air was measured. Only active
measurements were carried out. All measurements were taken in the same period of time. Results: The comparison of the predicted and measured concentrations of tetrachloroethene (per) shows that in soil air the predicted concentrations are higher than the measured concentrations (1 order of magnitude). In the indoor air and crawl space air the measured concentrations are in the same order of magnitude as the calculated range of concentrations. So although the soil air concentration is lower than expected, the indoor air concentrations are within the predicted range. This may indicate that the air permeability of the soil is higher than expected. Per - case 2 1.0E-07 1.0E-06 1.0E-05 1.0E-04 1.0E-03 1.0E-02 1.0E-01 ai r c o n cen tr at io n ( g /m 3) ia_p ia_o csa_p csa_o sa_p sa_o Case 03
Type of contamination: The groundwater is contaminated with chlorinated compounds with in principle one hotspot caused by a former dry cleaner business. Only tetrachloroethene was used.
Soil type: The groundwater level is between 1.6 and 2.7 meter below the soil surface. The top soil consists of very fine sand, moderately silty and locally sandy clay.
Type of building: The air concentrations in 1 house with a crawl space were measured. Measurements: Indoor air and crawl space air were measured two times at different locations. Only active measurements were carried out.
Results: The comparison of the predicted and measured concentrations of tetrachloroethene show that in the indoor air the measured concentrations are in the same order of magnitude but slightly lower as the predicted concentration range. The crawl space air concentrations tend to be the same and higher. So the measurements show a difference between the indoor air and the crawl space, whereas the predicted concentrations are only slightly different.