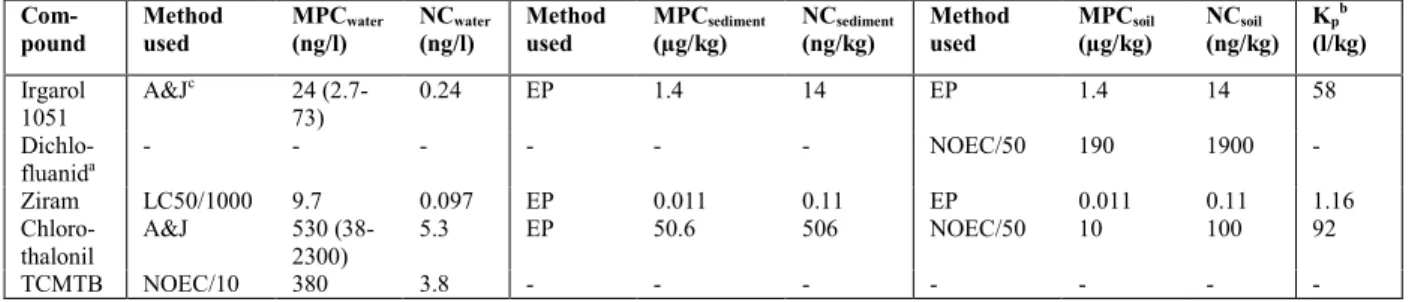
Maximum permissible concentrations and negligible concentrations for antifouling substances. Irgarol 1051, dichlofluanid, ziram, chlorothalonil and TCMTB | RIVM
59
0
0
Hele tekst
(2) pag. 2 of 59. RIVM report 601501008. Abstract In this report maximum permissible concentrations and negligible concentrations are derived for various antifouling substances, which are used as substitute for TBT such as Irgarol 1051, dichlofluanid, ziram, chlorothalonil and TCMTB..
(3) RIVM report 601501 008. pag. 3 of 59. Preface Thanks are due to dr. M. van der Weiden, who was contact person at the ministry of housing, spatial planning and the environment (VROM-DGM/SAS). We want to acknowledge dr. D. Sijm, and drs. T. Traas who are involved in the RIVM-project 601501 in which the work was performed. The results as presented in this report are discussed by the members of the ‘Setting Integrated Environmental Quality Standards Advisory Group’, who are acknowledged for their contribution. The members are: dr. T. Brock (Alterra), drs. S. Dogger (Health Council of the Netherlands), dr. J. Faber (Alterra), dr. K. den Haan (Shell International Chemical BV), drs. J. Peijnenburg (National Institute for Coastal and Marine Management), drs. M. Koene (Foundation for Nature and Environment), dr. D. Sijm (National Institute of Public Health and the Environment), dr. E. Sneller (National Institute of Inland Water Management), dr. J. Appelman (Board for the Authorisation of Pesticides), dr. W. van Tilborg (VTBC), dr. J. van Wensem (Technical Soil Protection Committee), dr. T. Traas (National Institute of Public Health and the Environment). The work described in this report relies partly upon recently published CSR-advisory reports: nr. 06456a00 on TCMTB, nr. 06105a00 on chlorothalonil and nr. 8241a01 on chlorothalonil. Therefore we want to acknowledge J. van der Pol, A. van der Linde, M.H.M.M. Montforts, R. Posthumus and C.E. Smit (all RIVM-CSR) who contributed to these reports..
(4) pag. 4 of 59. RIVM report 601501008. Contents SAMENVATTING ................................................................................................................................................ 6 SUMMARY............................................................................................................................................................ 8 1. INTRODUCTION...................................................................................................................................... 11 1.1 THE PROJECT ‘SETTING INTEGRATED ENVIRONMENTAL QUALITY STANDARDS’..................................... 11 1.2 ANTIFOULING SUBSTANCES ..................................................................................................................... 12 1.2.1 Background.................................................................................................................................... 12 1.2.2 Authorisation in the Netherlands................................................................................................... 13 1.2.3 Antifouling substances evaluated in the present report ................................................................. 13. 2. METHODS ................................................................................................................................................. 17 2.1 GENERAL SCHEME ................................................................................................................................... 17 2.2 DATA COLLECTION .................................................................................................................................. 17 2.3 DATA SELECTION ..................................................................................................................................... 17 2.4 EXTRAPOLATION TOWARDS MPCS AND NCS.......................................................................................... 18 2.4.1 Preliminary effect assessment........................................................................................................ 18 2.4.2 Refined effect assessment............................................................................................................... 18 2.4.3 Derivation of negligible concentrations (NCs).............................................................................. 18 2.5 EQUILIBRIUM PARTITIONING AND HARMONISATION BETWEEN THE COMPARTMENTS ............................... 19. 3. TOXICITY DATA AND DERIVATION OF MPCS AND NCS FOR WATER .................................. 21 3.1 3.2 3.3 3.4 3.5. 4. IRGAROL 1051 ......................................................................................................................................... 21 DICHLOFLUANID ...................................................................................................................................... 22 ZIRAM ...................................................................................................................................................... 23 CHLOROTHALONIL ................................................................................................................................... 23 TCMTB................................................................................................................................................... 24. TOXICITY DATA AND DERIVATION OF MPCS AND NCS FOR SOIL AND SEDIMENT........ 25 4.1 MPCS FOR SEDIMENT............................................................................................................................... 25 4.1.1 Partition coefficients used for the antifoulings.............................................................................. 25 4.2 MPCS FOR SOIL........................................................................................................................................ 26 4.2.1 Irgarol 1051................................................................................................................................... 26 4.2.2 Dichlofluanid................................................................................................................................. 26 4.2.3 Ziram ............................................................................................................................................. 26 4.2.4 Chlorothalonil ............................................................................................................................... 26 4.2.5 TCMTB .......................................................................................................................................... 26. 5. DISCUSSION ............................................................................................................................................. 29 5.1 OCCURRENCE........................................................................................................................................... 29 5.2 EFFECTS OBSERVED IN THE FIELD ............................................................................................................ 30 5.3 STABILITY OF THE ANTIFOULING SUBSTANCES ........................................................................................ 30 5.3.1 Irgarol 1051................................................................................................................................... 30 5.3.2 Dichlofluanid................................................................................................................................. 31 5.3.3 Chlorothalonil ............................................................................................................................... 32 5.3.4 Ziram ............................................................................................................................................. 32 5.3.5 TCMTB .......................................................................................................................................... 32 5.4 MIXTURE TOXICITY.................................................................................................................................. 32. REFERENCES .................................................................................................................................................... 34 APPENDIX 1: MAILING LIST......................................................................................................................... 38 APPENDIX 2. INFORMATION ON THE AQUATIC TOXICITY OF THE ANTIFOULINGS ............... 40.
(5) RIVM report 601501 008. pag. 5 of 59. APPENDIX 3. INFORMATION ON THE SOIL OR SEDIMENT TOXICITY OF THE ANTIFOULINGS ............................................................................................................................................................................... 52 REFERENCES TO APPENDIX 2 AND 3 ........................................................................................................ 58.
(6) pag. 6 of 59. RIVM report 601501008. Samenvatting In dit rapport zijn maximaal toelaatbare risiconiveaus (MTRs) en verwaarloosbare risiconiveaus (VRs) afgeleid voor vijf verbindingen die gebruikt worden als aangroeiwerend middel op onder andere schepen. MTRs worden afgeleid met gebruik van ecotoxicologische en milieuchemische data, en representeren het potentiële risico van stoffen voor een ecosysteem. MTRs vormen de wetenschappelijke basis voor milieukwaliteitsnormen die worden vastgesteld door het ministerie van VROM. In het verleden werd tributyltin (TBT) als belangrijk aangroeiwerend middel toegepast. Echter vanwege de aantoonbare ecotoxicologische effecten, en de wijdverbreide verspreiding die samenhangen met het gebruik van TBT, zijn politieke maatregelen genomen welke leiden tot een wereldwijd verbod op TBT in 2003. Als vervanger voor TBT komen nieuwe aangroeiwerende middelen op de verfmarkt. In dit rapport worden MTRs afgeleid voor deze TBT-vervangers. Voor de stoffen Irgarol 1051, dichlofluanid, ziram, chlorothalonil en TCMTB is een MTR afgeleid, voor de verbindingen SeaNine 211 en TCMS pyridine was te weinig informatie voorhanden om een MTR af te leiden. Naast de openbare literatuur is gebruik gemaakt van zogenaamde adviesrapporten om de toelating van bestrijdingsmiddelen te beoordelen. Deze adviesrapporten zijn opgesteld door het RIVM, Centrum voor Stoffen en Risico’s, in opdracht van het College Toelating Bestrijdingsmiddelen (CTB). Alleen toxiciteitstudies met eindpunten die gerelateerd zijn aan overleving, groei of reproductie zijn in beschouwing genomen. Ten opzichte van de tot nog toe gebruikte methodieken in het project ‘Integrale normstelling stoffen’ is een verandering aangebracht overeenkomstig Aldenberg and Jaworska (2000). Voor Irgarol 1051 blijken vooral de planten gevoelig te zijn; het mechanisme van toxiciteit is inhibitie van het fotosynthetisch elektronen transport. Een log-normale fit aan de toxiciteitgegevens van alle soorten, maar ook aan alleen de plantgegevens was statistisch acceptabel. Ondanks de hogere gevoeligheid van de planten is het berekende MTRwater die gebaseerd werd op alleen de plant gegevens hoger dan het MTRwater die is berekend over alle gegevens, dit is te verklaren uit de lagere spreiding in de plantendataset. Er wordt voorgesteld het MTRwater te baseren op de plantgegevens. Dichlofluanide is erg instabiel in water, de stof is niet meer te detecteren aan het eind van toxiciteittesten. Er wordt aanbevolen om het MTRwater te baseren op de gevormde metabolieten in plaats van op de moederverbinding. Voor de toxiciteit in sediment van de onderzochte verbindingen zijn geen specifieke gegevens gevonden, de MTRsediment is voor alle stoffen afgeleid met behulp van de evenwichts-partitie theorie. Voor TCMTB kan geen Koc gemeten worden, en dus ook geen evenwichts-partitie toegepast worden, vanwege de hydrolyse en methylatie van TCMTB in 2(methylthio)benzothiazol. Voor bodem waren voor dichlofluanide, ziram en chlorothalonil bruikbare gegevens voorhanden over de toxiciteit naar terrestrische organismen of processen. Voor dichlofluanid en chlorothalonil is de MTRbodem afgeleid op basis van deze terrestrische gegevens, en voor.
(7) RIVM report 601501 008. pag. 7 of 59. Irgarol 1051 en ziram is de MTRbodem afgeleid met gebruik van de evenwichts-partitie theorie. Voor een overzicht van de afgeleide MTRs zie tabel I. Tabel I. MTRs en VRs voor aangroeiwerende middelen, respectievelijk voor water (opgelost), standaard sediment en standaard bodem Stof. Methode. Irgarol 1051 Dichlofluanidea Ziram Chlorothalonil TCMTB. A&Jc. a. LC50/1000 A&J NOEC/10. MTRwater (ng/l) 24 (2.773) -. VRwater (ng/l) 0.24. Methode. 9.7 530 (382300) 380. EP. MTRbodem (µg/kg) 1.4. VRbodem (ng/kg) 14. Kpb (l/kg) 58. -. NOEC/50. 190. 1900. -. 0.011 50.6. 0.11 506. EP NOEC/50. 0.011 10. 0.11 100. 1.16 92. -. -. -. -. -. -. VRsediment (ng/kg) 14. Methode. EP. MTRsediment (µg/kg) 1.4. -. -. -. 0.097 5.3. EP EP. 3.8. -. Onstabiele verbinding b Berekend uit Koc c Volgens Aldenberg and Jaworska, 2000. Behalve voor Irgarol 1051, is geen informatie aangetroffen in de open literatuur over het voorkomen in het milieu in Nederland van de hier behandelde verbindingen. Irgarol 1051 komt wijdverbreid voor in Europese estuariene en kust- wateren en sedimenten. Concentraties zijn gevonden tot 0,19 µg/l in water en tot 1,7 µg/l in havens. Er is een seizoensgebonden patroon in de concentraties, welke pieken in de vroege zomer. Langs een saliniteitsgradiënt in de Westerschelde werden concentraties gevonden tussen de 1 en 10 ng/l. Concentraties in havens zullen vermoedelijk hierboven liggen. De gemeten concentraties liggen dicht bij het MTR. Milieuconcentraties van TBT-vervangers anders dan Irgarol kunnen geschat worden met behulp van modellen. Het ‘MAM-PEC’ model (Van Hattum et al., 1999) is speciaal voor dit doeleinde ontwikkeld. Wanneer de geschatte concentraties gecombineerd worden met de informatie uit het huidige rapport, kunnen de milieurisico’s van de diverse TBT-vervangers met elkaar vergeleken worden..
(8) pag. 8 of 59. RIVM report 601501008. Summary In this report maximum permissible concentrations (MPCs) and negligible concentrations (NCs) are derived for five compounds used as antifouling substances on e.g. ships. MPCs are derived using data on (eco)toxicology and environmental chemistry, and represent the potential risk of the substances to the ecosystem. They are the scientific basis for Environmental Quality Standards (EQSs) set by the Ministry of VROM. Tributyl-tin (TBT) was used as major antifouling substance on ships in the past. Many adverse ecotoxicological effects caused by TBT are reported, and butyltin contamination is widespread. In 1989 the EU restricted the use of TBT on boats under 25 m and the International Maritime Organisation decided for a world-wide ban on TBT in 2003. As a replacement for TBT, new antifouling agents are coming up to the paint market. In this report MPCs are derived for substances that are used as TBT-substitutes. MPCs are derived for the compounds Irgarol 1051, dichlofluanid, ziram, chlorothalonil and TCMTB. For SeaNine 211 and TCMS pyridine, there appeared to be insufficient information to derive an MPC. In addition to the open literature, advisory reports that are prepared for the authorisation of pesticides were a source of information. These advisory reports are prepared by RIVM, for the account of the Dutch Board for the Authorisation of Pesticides (CTB). Only toxicity studies with endpoints related to survival, growth or reproduction are taken into account. A modification to the generally used procedures in the project ‘Setting Integrated Environmental Quality Standards’ is made according to Aldenberg and Jaworska (2000). For Irgarol 1051 especially plants appear to be sensitive; the mode of action is inhibition of photosynthetic electron transport. The log-normal fit to toxicity data of all species as well as to only the plant data was statistically acceptable. In spite of the higher sensitivity of the plants, the calculated MPCwater based on the ‘plants only’ dataset is higher than the MPCwater calculated over all data, due to the lower variability in the plant only dataset. It is proposed to base the MPCwater on the plants only dataset. Dichlofluanid is highly unstable in the water phase, the parent compound was below detection limit at the end of the toxicity tests. Therefore, it is recommended to base the MPC on the metabolites formed and not on the parent compound. No data for toxicity of the studied compounds to organisms living in sediments were found. For all compounds the MPCsediment is derived with help of the equilibrium partitioning theory. For TCMTB the Koc could not be measured due to hydrolysis and methylation of TCMTB into 2-(methylthio)benzothiazole (MTBT). Therefore, the equilibrium partitioning theory is not applicable for TCMTB. Data on the toxicity to soil organisms or soil processes are available for dichlofluanid, ziram and chlorothalonil. For dichlofluanid and chlorothalonil MPCsoil is directly based on these terrestrial data, for Irgarol 1051 and ziram the MPCsoil is derived using equilibrium partitioning. For an overview of the MPCs derived in this report see Table I..
(9) RIVM report 601501 008. pag. 9 of 59. Table I. MPCs and NCs for antifouling substances, respectively for water (dissolved), standard sediment and standard soil Compound. Method used. MPCwater (ng/l). NCwater (ng/l). Method used. MPCsediment (µg/kg). NCsediment (ng/kg). Method used. MPCsoil (µg/kg). NCsoil (ng/kg). Kpb (l/kg). Irgarol 1051 Dichlofluanida Ziram Chlorothalonil TCMTB. A&Jc. 24 (2.773) -. 0.24. EP. 1.4. 14. EP. 1.4. 14. 58. -. -. -. -. NOEC/50. 190. 1900. -. 0.097 5.3. EP EP. 0.011 50.6. 0.11 506. EP NOEC/50. 0.011 10. 0.11 100. 1.16 92. 3.8. -. -. -. -. -. -. -. a. LC50/1000 A&J NOEC/10. 9.7 530 (382300) 380. Highly unstable compound b Calculated from Koc c According to Aldenberg and Jaworska, 2000. Except for Irgarol 1051, no information was encountered in the open literature on the environmental occurrence in the Netherlands of the chemicals studied here. Irgarol 1051 is widely distributed in European estuarine and coastal waters and sediments. Concentrations found are up to 0.19 µg/l in water and up to 1.7 µg/l in ports. A clear seasonally bound pattern is observed, with a maximal concentration in early summer. Along a salinity gradient in the Scheldt, the Netherlands, concentrations between 1 and 10 ng/l are found. Concentrations encountered in harbours are expected to exceed these values. The measured concentrations are close to the derived MPC. It is concluded that the species composition and thereby ecosystem functioning cannot be considered as protected. To estimate the environmental concentration of the TBT-substitutes other than Irgarol and to compare the environmental risks between the various TBT-substitutes and TBT, the information from the present report should be combined with information on predicted concentrations. For this purpose the ‘MAM-PEC model’ (Van Hattum et al. 1999) could be used..
(10) pag. 10 of 59. RIVM report 601501008.
(11) RIVM report 601501 008. pag. 11 of 59. 1 Introduction 1.1 The project ‘Setting Integrated Environmental Quality Standards’ This report is produced in the framework of the project ‘Setting Integrated Environmental Quality Standards’. The aim of the project is to derive environmental risk limits for substances in the environment for the compartments air, water, sediment and soil. The environmental risk limits are referred to as Environmental Quality Standards (EQSs) in Dutch Environmental Policy and are set by the Ministry of VROM. The EQSs are based on maximum permissible concentrations (MPCs) and negligible concentrations (NCs). MPCs are derived using data on (eco)toxicology and environmental chemistry, and represent the potential risk of the substances to the ecosystem. Applying a factor of 100 towards the MPC yields the NCs. The process of deriving integrated EQSs is shown schematically in Figure 1.1. In this report MPCs are derived for five compounds that are used as antifouling substances. The results obtained until now in the project ‘Setting Integrated Environmental Quality Standards’ are laid down in several reports. The MPCs and NCs derived until 1997 are summarised by De Bruijn et al. (1999). Reuther et al. (1998) derived MPCs and NCs for aniline derivatives. Risk limits for boron, silver, titanium, tellurium, uranium and an organosilicon compound are derived in Van de Plassche et al. (1999), and MPCs have been proposed for PCBs and phthalates (Van Wezel et al., 1999ab). literature search and evaluation. data selection. parameters criteria. calculation of MPCs. harmonization of MPCs Deriving risk limits (RIVM) Setting EQSs by VROM in cooperation with other ministries. Setting of environmental quality standards. Figure 1.1. The process of deriving Integrated Environmental Quality Standards.
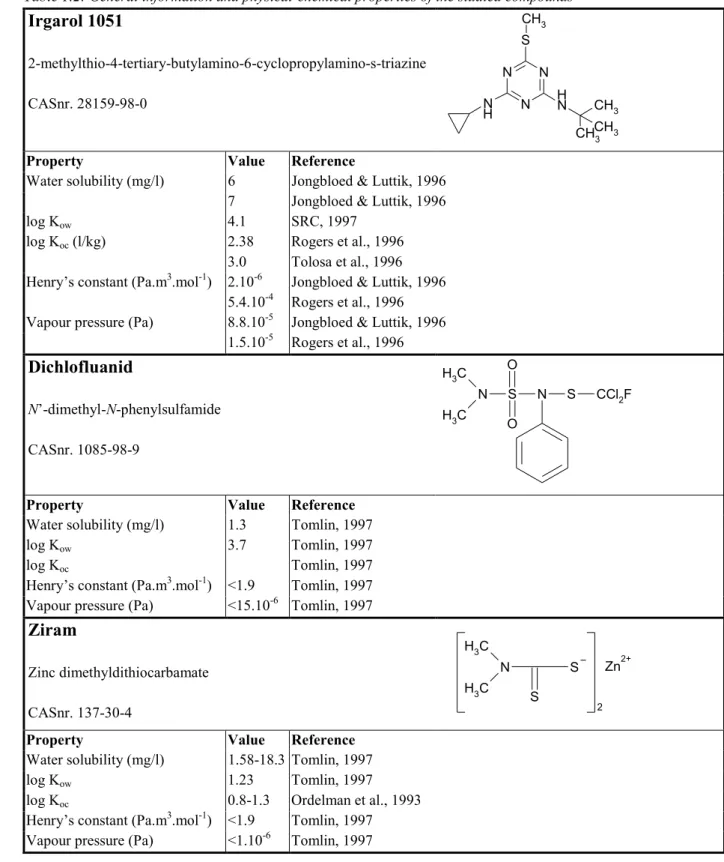
(12) pag. 12 of 59. RIVM report 601501008. 1.2 Antifouling substances 1.2.1 Background Biofouling is the settlement and growth of micro- and macro-organisms on surfaces. Biofouling on ships increases the fuel consumption (by 6% for every 100 µm increase in hull roughness, cited in Voulvoulis et al., 1999a). Biofouling can be prevented by the use of antifouling substances. Other ways of preventing biofouling is by cleaning or nutrient limitation (Flemming et al., 1996). On ships tributyl-tin (TBT) was used as major antifouling substance in the past. Many adverse ecotoxicological effects caused by TBT are reported in laboratory studies (see for example Crommentuijn et al. 1997a for an overview) and field studies in marina’s and the open sea (Ten Hallers-Tjabbes et al., 1994). Butyltin contamination is not only found in harbours, but is more widespread (Tanabe et al., 1998). The ecotoxicological problems associated with the use of TBT have been recognised, and have led to policy action. In 1989 the European Community introduced a directive to restrict the use of TBT-based antifouling paints on boats under 25 m. The International Maritime Organisation (IMO) has decided for a complete world-wide ban on TBT for all boats in 2003. As a replacement for TBT, new antifouling agents are coming up to the paint market (e.g. Voulvoulis et al., 1999ab). Examples of these substances can be found in Table 1. These substances are partly well known chemicals for which environmental risk limits have been derived. However, also relatively unknown chemicals that have not been the subject of many ecotoxicological studies are used to replace TBT. The different TBT-substitutes are commonly used in combination with copper or zinc compounds. Additional to copper and zinc, organic biocides are needed, because of the relative tolerance of (micro-) algae species to these metals (Voulvoulis et al., 1999a). Several of the TBT-substitutes have in addition to application as an antifouling agent other agricultural uses (Voulvoulis et al., 1999a). Table 1.1: Substances used to replace TBT in antifouling paints Chemical name 2,3,5,6-tetrachloro-4-(methyl sulphonyl) pyridine 2-methylthio-4-tertiarybutylamino-6cyclopropylamino-s-triazine Cuprous thiocyanate 2,4,5,6-tetrachloro iso phthalo nitrile 4,5-dichloro-2-n-octyl-4isothiazolin-3-one Dichlorophenyl dimethylurea Folpet Zinc pyrithione 4-chloro-meta-cresol Arsenic trioxide Maneb. MPCs derived N N. Y (Cu) N N Y N N N N Y. Common name TCMS Pyridine Irgarol 1051. Chlorothalon il SeaNine 211 Kathon 5287 Diuron. Chemical name zineb. MPCs derived Y. cis 1-(3-chloroallyl)-3,5,7triaza-1-azonia adamantane chloride dichlofluanid 2-(thiocyanomethyl thio)benzthiazole deltamethrin. N. farnesol thiram oxy tetracycline hydrochloride ziram bitumen. N Y N N N. N N Y. Common name. TCMTB.
(13) RIVM report 601501 008. pag. 13 of 59. Research on natural product antifouling is still in its infancy. Clare (1996) reviewed natural products against biofouling produced by cnidaria, porifera (sponges), chordata, thallophyta, angiospermae and micro-organisms. However, very few of these products have really been tested for their antifouling action when applied on boats, and on their toxicity.. 1.2.2 Authorisation in the Netherlands Antifouling substances that are presently authorised in the Netherlands are (information from the Board for the Authorisation of Pesticides, CTB): § Irgarol 1051 (0.6-5%) in combination with § Copper (I) oxide (28-43%) § or Copperthiocyanate (14-17%) § or copperthiocyanate (5-6.6%) and zinc oxide (3.2-4.3%) § or copper (I) oxide (40%) and zinc oxide (9%) § bitumen (5.9%) in combination with copper (I) oxide (21%) § dichlofluanid (9%) § diuron (3.5-4.3%) in combination with § copper (I) oxide (40-43%) § or copper thiocyanate (24%) § or copper thiocyanate (20%) and zinc oxide (13%) § or copper (I) oxide (29-46%) and zinc oxide (9.5-12%) § copper (17-25%) § copper (I) oxide (10-50%) § a combination of zineb (4.4%) and copper oxide (40%) § a combination of zinc oxide (11-18%) and copper (I) oxide (41-45%) § a combination of ziram (4.6%) and copper (I) oxide (39.3%) § antifouling substances with tributyltinoxides and tributyltinmethacrylates (also in combination with copper (I) oxides(5-40%). 1.2.3 Antifouling substances evaluated in the present report The purpose of the present report is to derive MPCs for water, sediment and soil for substances that are used as TBT-substitutes. MPCs are derived for Irgarol 1051, dichlofluanid, ziram, chlorothalonil and TCMTB. For SeaNine 211 and TCMS pyridine, there appeared to be insufficient information to derive an MPC. The compounds are selected as they are authorised in the Netherlands (Irgarol 1051, dichlofluanid, and ziram) as an antifouling substance, or often mentioned in the literature as an alternative to TBT (chlorothalonil, SeaNine). Mixture toxicity of the different TBTsubstitutes with among themselves or with copper or zinc, was not taken into account in the MPC-derivation. If compounds are accumulated in the food chain, this poses an extra risk for species at the top of the food chain and MPCs are derived that take into account this extra risk (Van de Plassche, 1994; Van Wezel et al., 1999a). The compounds studied in the present report do not appear to be very hydrophobic (see Kow or Koc in Table 1.2.). Therefore they are.
(14) pag. 14 of 59. RIVM report 601501008. not expected to biomagnify in the food chain, and it is considered not necessary to derive MPCs that take into account biomagnification. General information on the evaluated antifouling substances can be found in Table 1.2. Table 1.2: General information and physical-chemical properties of the studied compounds. Irgarol 1051. CH3 S. 2-methylthio-4-tertiary-butylamino-6-cyclopropylamino-s-triazine. N. CASnr. 28159-98-0. Property Water solubility (mg/l) log Kow log Koc (l/kg) Henry’s constant (Pa.m3.mol-1) Vapour pressure (Pa). N H. Value 6 7 4.1 2.38 3.0 2.10-6 5.4.10-4 8.8.10-5 1.5.10-5. N H N. N. CH3 3 CHCH 3. Reference Jongbloed & Luttik, 1996 Jongbloed & Luttik, 1996 SRC, 1997 Rogers et al., 1996 Tolosa et al., 1996 Jongbloed & Luttik, 1996 Rogers et al., 1996 Jongbloed & Luttik, 1996 Rogers et al., 1996. Dichlofluanid. O. H3 C N. N’-dimethyl-N-phenylsulfamide. H3 C. S. N. S. CCl2F. S. Zn. O. CASnr. 1085-98-9. Property Water solubility (mg/l) log Kow log Koc Henry’s constant (Pa.m3.mol-1) Vapour pressure (Pa). Value 1.3 3.7 <1.9 <15.10-6. Reference Tomlin, 1997 Tomlin, 1997 Tomlin, 1997 Tomlin, 1997 Tomlin, 1997. Ziram. H3 C N. Zinc dimethyldithiocarbamate H3 C. CASnr. 137-30-4 Property Water solubility (mg/l) log Kow log Koc Henry’s constant (Pa.m3.mol-1) Vapour pressure (Pa). Value 1.58-18.3 1.23 0.8-1.3 <1.9 <1.10-6. Reference Tomlin, 1997 Tomlin, 1997 Ordelman et al., 1993 Tomlin, 1997 Tomlin, 1997. S. 2. 2+.
(15) RIVM report 601501 008. pag. 15 of 59. Table 1.2., continued. Chlorothalonil. CN. 2,4,5,6-tetrachloro-isophtalonitrile CASnr. 1897-45-6. Cl. Cl. Cl. CN Cl. Property Water solubility (mg/l) log Kow log Koc (l/kg) Henry’s constant (Pa.m3.mol-1) Vapour pressure (Pa, 25ºC). Value 0.9 2.6-4.4 2.9-3.8 1.7·10-2 4.3·10-12. Reference Caux et al., 1996 Caux et al., 1996 Caux et al., 1996 Caux et al., 1996 Caux et al., 1996. TCMTB. N. (2-thiocyanomethylthio)benzothiazole. S. CASnr. 21564-17-0 Property Water solubility (mg/l). log Kow log Koc (l/kg). Henry’s constant (Pa.m3.mol-1) Vapour pressure (Pa). Value 20 45 40 3.1 2.74. 1.2 607 193. S C S CN H2. Reference Van der Pol and Van der Linde, 1999 Van der Pol and Van der Linde, 1999 Brownlee et al., 1992 Brownlee et al., 1992 predicted acc. to Karickhof, 1981; in an experimental set-up TCMTB was hydrolysed and methylated so an Koc could not be measured (Brownlee et al., 1992) Van der Pol and Van der Linde, 1999 Van der Pol and Van der Linde, 1999 Van der Pol and Van der Linde, 1999.
(16) pag. 16 of 59. RIVM report 601501008.
(17) RIVM report 601501 008. pag. 17 of 59. 2 Methods 2.1 General scheme The maximum permissible concentrations and negligible concentrations are derived as described in Kalf et al. (1999), and according to the methods generally applied within the project ‘Setting Integrated Environmental Quality Standards’. A modification to the generally used procedures is made according to Aldenberg and Jaworska (2000). In short, data on chronic and acute toxicity for aquatic and terrestrial species and terrestrial processes of a compound are searched for. They are evaluated, and selected or rejected. For compounds with a log Kow higher than 5.0, or for compounds for which there is an expectation for secondary poisoning, also toxicity data for mammals and birds are searched for. The maximum permissible concentration (MPC) is derived using either the refined assessment method as described by Aldenberg and Jaworska (2000), or assessment factors as laid down in the Technical Guidance Document (ECB, 1996, developed for EU council regulation 793/93). The MPCs are harmonised according to the equilibrium partition theory. In this way it is prevented that a concentration on an MPC-level in one compartment leads to an exceeding of the MPC in another compartment.. 2.2 Data collection An on-line literature search was performed for the period 1983-summer 1999. The TOXLINE and BIOSYS databases were used. In addition to the open literature, advisory reports that are prepared for the authorisation of pesticides were a source of information. The National Institute of Public Health and the Environment (RIVM) prepares the advisory reports, for the account of the Dutch Board for the Authorisation of Pesticides (CTB). Relevant references are Jongbloed and Luttik (1996) which reviewed data for Irgarol 1051, Jansma and Linders (1992) which served as a basis for the information on dichlofluanid. Tibosch et al. (1993) summarised data on ziram. Van der Pol and Van der Linde (1999) served as a basis for information on TCMTB, and Montforts (1999) and Posthumus (1999) summarised data for chlorothalonil.. 2.3 Data selection A toxicity study is considered reliable if the design of the experiment is in agreement with international accepted guidelines, e.g. OECD guidelines. To judge studies that have not been performed according to these guidelines, criteria are developed within the framework of the project ‘Setting Integrated Environmental Quality Standards’. Effects on growth, reproduction or survival are used in the derivation of MPCs, as they are directly related to population dynamics. Toxicity data from sediment studies are normalised to 10% organic matter. When the method of derivation of a NOEC, LC50 or EC50 was not clearly stated in the original work, a recalculation was performed. A logistic equation was fitted through effect.
(18) pag. 18 of 59. RIVM report 601501008. data versus the logarithms of concentrations (preferably measured values) using nonlinear regression (Graphpad Prism, 1996). Either the EC50 (LC50) or the EC10 was calculated. When data of a chronic experiment were fitted, an EC10 was calculated, which was interpreted as NOEC. Recalculation of data is mentioned in the footnotes of the tables in Appendix 2 and 3 by ‘Effect concentration recalculated’. For each species and each compound, the most sensitive toxicity test is selected. If for a single species several toxicity values are found for the same effect parameter, the geometric mean is calculated.. 2.4 Extrapolation towards MPCs and NCs 2.4.1 Preliminary effect assessment If chronic or acute toxicity data are available for less than four taxonomic groups, assessment factors are used. The assessment factors used are laid down in the Technical Guidance Document (ECB, 1996; Kalf et al., 1999), which is developed in the framework of EU council regulation 793/93. In the case that there is no complete base-set (acute toxicity to algae, daphnia and fish), the modified EPA method is used.. 2.4.2 Refined effect assessment The aim of environmental quality standards as derived in the project ‘Setting Integrated Environmental Quality Standards’ is to protect all species in the ecosystem. For statistical considerations the MPC is set equal to the concentration at which 95% of the species is protected, i.e. HC5, assuming thereby to protect the whole ecosystem (VROM, 1989; Van Leeuwen et al., 1992). A detailed description of the statistical background of the refined effect assessment method is given in the literature (Kooijman, 1987; Van Straalen and Denneman, 1989; Aldenberg and Slob, 1993; Aldenberg and Jaworska, 2000). It is assumed that sensitivities of species in an ecosystem can be described by a log-normal frequency distribution. Using the computer package GraphPad Prism it is tested, with the Kolmogorov-Smirnov D*sqrt(n) test, if a normal distribution to the log-transformed data adequately describes the underlying data. The average, the standard deviation, and the number of the underlying data define this distribution. Extrapolation factors as derived by Aldenberg and Jaworska (2000) are used to estimate the HC5, and its upper (95%) and lower (5%) estimate, constituting a 90% two-sided confidence interval.. 2.4.3 Derivation of negligible concentrations (NCs) Multiplying the MPCs with a factor 0.01 derives NCs. This factor is supposed to be needed as protection against mixture toxicity, since species are always exposed in the environment to mixtures of chemicals and chemicals act often as concentration-additive (Van Leeuwen et al., 1996; Deneer, 1988)..
(19) RIVM report 601501 008. pag. 19 of 59. 2.5 Equilibrium partitioning and harmonisation between the compartments The partition coefficient between organic carbon in the soil/sediment and water (Koc) is used to derive an MPC for soil/sediment when no data on terrestrial or sediment-dwelling organisms are available. In addition, it is used to harmonise the MPCs between the different compartments. By applying this equilibrium-partitioning concept (DiToro et al., 1991), it is assumed that there is equilibrium between the concentration in organic carbon and (pore) water. The Koc describes this equilibrium. It is furthermore assumed that toxicity is related to the pore water concentrations, and that aquatic organisms are comparable in their sensitivity to the compound to the organisms living in soil or sediment..
(20) pag. 20 of 59. RIVM report 601501008.
(21) RIVM report 601501 008. pag. 21 of 59. 3 Toxicity data and derivation of MPCs and NCs for water The aquatic toxicity data that are found for Irgarol 1051, dichlofluanid, ziram, chlorothalonil and TCMTB are presented in Appendix 2. The toxicity data that are found for terrestrial or benthic organisms are presented in Appendix 3 for the same compounds. Only toxicity studies with endpoints related to survival, growth or reproduction are taken into account. Several toxicity studies are found with endpoints related to biochemistry or animal behaviour (MacKinnon and Farrell, 1992; Kruzynski et al., 1994ab; Davies et al., 1994). These endpoints are not taken into account for the derivation of MPCs, as they do not have a clear relationship with population dynamics. For the derivation of MPCs salt and freshwater data are combined if there are no (statistical) reasons to keep the data separated. This means that the MPC is derived using the combined dataset. For an overview of the derived MPCs see Table 3.1.. 3.1 Irgarol 1051 Aquatic toxicity data on Irgarol 1051 can be found in Tables 1.1. to 1.4. in Appendix 2. Acute and chronic toxicity data are given for freshwater and saltwater organisms. Acute toxicity was tested for algae, macrophytes, crustaceans, and fish (Tables 1.1. and 1.2.). Especially algae and macrophytes appear to be sensitive taxonomic groups. This is explained as the mode of action of Irgarol 1051 is inhibition of photosynthetic electron transport (Holt, 1993). The sensitivity of freshwater and marine organisms to acute exposure can be compared for the crustaceans and fish. The marine crustacean is 100 times more sensitive than the freshwater crustacean. The sensitivity of the two marine fish falls well within the range of sensitivities encountered for the freshwater species. Chronic toxicity was tested for algae, macrophytes, crustaceans, and fish (Tables 1.3. and 1.4.). Again, algae and macrophytes are more sensitive than crustaceans and fish. For algae both saltwater species (n=2) and freshwater species (n=4) are tested; the sensitivities of saltwater and freshwater species are not statistically different (Two-tailed T-test with Welch correction, GraphPad Prism). Chronic toxicity tests are available for species of four different taxonomic groups, so the refined assessment (Aldenberg and Jaworska, 2000) can be applied. The log-normal fit to the most sensitive data per species from Tables 1.3. and 1.4. was statistically accepted according to the Kolgomorov-Smirnov test. The MPCwater is 9.0 ng/l (0.26-61 ng/l), which is a factor of two below the lowest chronic toxicity value of 17 ng/l for the algae Navicula pelliculosa. According to the mechanism of action of Irgarol, i.e. inhibition of photosynthetic electron transport, plants can be considered the most sensitive species. This is confirmed by the available data (Figure 3.1.). A one-tailed T-test (with GraphPad Prism) shows that the data for plants differed significantly (P=0.0007) from the remaining toxicity data. A log-normal fit to only the plant data (algae and macrophytes) was also statistically accepted. The variability in.
(22) pag. 22 of 59. RIVM report 601501008. the plant only dataset is smaller than in the dataset for all species. In spite of the higher sensitivity of the plants, the calculated MPCwater based on the plants only dataset is higher than the MPCwater calculated over all data: 24 ng/l (2.5-73 ng/l). This is due to the lower variability and lower resulting standard deviation in the plants only dataset (Figure 3.1.). As there is a basis to state that plants are the most sensitive species, it is proposed to base the MPCwater on the plants only dataset. Hall et al. (1999) also fitted species sensitivity distributions to -mainly unpublished- data. They used the statistical methods as described by Solomon et al. (1996). The data used were slightly different from the ones as used in the current study. The 5th percentile of the most sensitive group, i.e. aquatic plants, was 80 ng/l, which is a factor 3-4 above the MPC derived in the current study. 0.5. all species plants plants only all species. 0.4. 0.3. 0.2. 0.1. 0 -4. -3. -2. -1. 0 log NOEC (µg/l). 1. 2. 3. 4. Figure 3.1. Frequency distributions of the toxicity data for Irgarol 1051 for all species or for plants only. 3.2 Dichlofluanid Aquatic toxicity tests with dichlofluanid can be found in Tables 2.1. to 2.2., and rejected tests in Table 2.3. and 2.4. in Appendix 2. Only freshwater species are tested, acute and chronic data are available for two taxonomic groups: crustaceans and fish. Since the base set is incomplete (there are no data for three taxonomic groups) and according to Kalf et al. (1999), the modified EPA method is used. The lowest chronic (21 d) test is an LC50 value of 0.016 mg/l for Oncorhynchus mykiss, an assessment factor of 10 is applied, which yields an MPCwater of 1.6 µg/l. As chronic data are only available for two taxonomic groups, this is compared with the extrapolated value based on acute toxicity values. The lowest acute toxicity value is 0.011 mg/l again for Oncorhynchus mykiss. An assessment factor of 1000 yields an MPCwater of 11 ng/l. The lowest of both extrapolation methods is chosen, yielding an MPCwater of 11 ng/l. However, the substance is highly unstable in the water phase. The parent compound was below detection limit at the end of the toxicity test. Therefore, it is recommended to base the.
(23) RIVM report 601501 008. pag. 23 of 59. MPC on the metabolites formed and not on the parent compound (see discussion for further details).. 3.3 Ziram Aquatic toxicity data on ziram can be found in Tables 3.1. to 3.3. in Appendix 2. Acute data are found for freshwater and marine species. A comparison of sensitivities cannot be made, as for salt water the only species tested is a bacterium. In this taxonomic group no freshwater species is tested. Acute aquatic toxicity data are available for six taxonomic groups (bacteria, algae, crustacea, insects, mollusca and pisces, Tables 3.1. and 3.2.). No clear differences in sensitivity between the different taxonomic groups are observed. Chronic toxicity data are found for fresh water species of two taxonomic groups (crustacea and pisces). The lowest acute L(E)C50 is 9.7 µg/l for the fish Lepomis macrochirus. According to the EU/TGD (ECB, 1996) and Kalf (1999) an assessment factor of 1000 is applied which gives an MPCwater of 9.7 ng/l. The lowest chronic toxicity value encountered is 0.6 µg/l for an early life stage test Oncorhynchus mykiss (Table 3.3.). Since the taxonomic group showing the lowest acute effect (i.c. pisces), is represented in the chronic toxicity data set by a NOEC value, an assessment factor of 50 is applied to the lowest NOEC value. This results in an MPCwater of 0.6/50 = 0.012 µg/l or 12 ng/l. The MPC based on extrapolation of acute data is (only slightly) lower than the MPC based on extrapolation of chronic data, therefore the former is selected (Kalf, 1999; ECB, 1996). Hence, the MPCwater for ziram is 9.7 ng/l.. 3.4 Chlorothalonil Chlorothalonil possesses multiple electrophilic centres, and is therefore reactive towards GSH and can be detoxified thereby (Gallagher and Di Giulio, 1992). If channel catfish were depleted in their GSH, the acute toxicity of chlorothalonil was elevated (Gallagher et al., 1992). Acute aquatic toxicity data of chlorothalonil are presented in Tables 4.1. and 4.2. for freshwater species and marine species respectively. Acute toxicity tests are performed with crustaceans, molluscs and fish. For crustaceans and fish both freshwater and marine species are tested, for both species the data for fresh- and salt water do not differ statistically (unpaired T-test with Welch’s correction, GraphPad Prism). Chronic aquatic toxicity data are available for freshwater species only, and can be found in Table 4.3. Toxicity data are available for four different taxonomic groups (algae, plants, crustaceans, insects and fish), so a MPCwater can be derived with help of the refined assessment method. The data were found to be log-normal distributed (Kolgomorov-Smirnov test). The MPCwater which was derived is 0.53 µg/l (0.038-2.3 µg/l)..
(24) pag. 24 of 59. RIVM report 601501008. 0,25. frequency. 0,2. 0,15. 0,1. 0,05. 0 -4. -3. -2. -1. 0 1 log NOEC (µg/l). 2. 3. 4. Figure 3.2. Frequency distributions of the toxicity data for chlorothalonil. 3.5 TCMTB Information on the aquatic toxicity of TCMTB can be found in Table 5.1. and 5.2. of Appendix 2. The amount of data is limited, and only data for freshwater organisms are available. Acute data are available for a crustacean and a fish, only for daphnia magna a chronic toxicity value is available. There is no complete base set, according to Kalf et al. (1999) an assessment factor of 10 is applied to the NOEC, this yields an MPCwater of 0.38 µg/l. Table 3.1. MPCwater (dissolved) for antifouling substances NCwater Compound MPCwater Method (ng/l) (ng/l) used Irgarol 1051 A&Jc 24 (2.7-73) 0.24 a Dichlofluanid Ziram LC50/1000 9.7 0.097 Chlorothalonil A&J 530 (38-2300) 5.3 TCMTB NOEC/10 380 3.8 a Highly unstable compound, no MPC derived b Calculated from Koc, assuming standard sediment with 10% organic matter c According to Aldenberg and Jaworska, 2000.
(25) RIVM report 601501 008. pag. 25 of 59. 4 Toxicity data and derivation of MPCs and NCs for soil and sediment 4.1 MPCs for sediment No specific data are found for sediment toxicity of the studied compounds, only for ziram a test was found that was rejected (Table 2.3.). As no sediment toxicity data are available, the MPCs are derived with help of the equilibrium partitioning theory as described earlier (2.5.). In conclusion, for Irgarol 1051, ziram and chlorothalonil Kp’s are found, and using equilibrium partitioning an MPCsediment is derived of respectively 0.5, 0.011 and 27.6 µg/kg (Table 3.1.).. 4.1.1 Partition coefficients used for the antifoulings For Irgarol 1051 a log Koc of 3.0 was used (Tolosa et al., 1996), so a Kp to standard sediment with 10% organic matter (conversion factor from organic carbon to organic matter is assumed 1.724) is 58. According to Tomlin (1997) dichlofluanid is unstable in soil. It is first metabolised into dimethylsulfanilide and then further degraded. Therefore, the equilibrium partitioning theory cannot be applied to derive a MPCsediment for dichlofluanid. For ziram a log Koc was used of 1.3 was used, the higher in the range 0.8-1.3 reported by Ordelman et al. (1993), which corresponds with a Kp of 1.16 l/kg. Experimental log Koc values for chlorothalonil vary between 2.5 and 3.8, the mean of 11 experimental data is 3.2 (Posthumus, 1999). Normalised to standard sediment with 10% organic matter, the Kp is 92 l/kg. For TCMTB no information in the industrial dossiers is available on sorption to organic carbon (Van der Pol and Van der Linde, 1999), and a study of Brownlee et al. (1992) showed that in an experimental set-up the Koc could not be measured due to hydrolysis and methylation of TCMTB into 2-(methylthio)benzothiazole (MTBT). Therefore, the equilibrium partitioning theory is not applicable for TCMTB. Table 4.1. MPCwater (dissolved) and MPCsediment for antifouling substances Compound MPCwater Method MPCsediment NCsediment (ng/l) used (µg/kg) (ng/kg) Irgarol 1051 24 (2.7-73) EP 1.4 14 Dichlofluanida Ziram 9.7 EP 0.011 0.11 Chlorothalonil 530 (38EP 50.6 506 2300) TCMTB 380 a Highly unstable compound, no MPC derived b Calculated from Koc, assuming standard sediment with 10% organic matter. Kpb (l/kg) 58 1.16 92 -.
(26) pag. 26 of 59. RIVM report 601501008. 4.2 MPCs for soil 4.2.1 Irgarol 1051 For Irgarol, no specific toxicity tests related to soil are available. As for sediment, equilibrium partitioning is used to derive an MPCsoil of 1.4 µg/kg standard soil with 10% organic matter.. 4.2.2 Dichlofluanid For dichlofluanid, Tables 1.1. and 1.2 from Appendix 3 show that the chronic data on microbial processes (only data on nitrification are available) are more critical than the chronic toxicity data on Eisenia fetida. Therefore these data are used to derive an MPCsoil for dichlofluanid. The lowest value of 9.3 mg/kg d.w. is used. This value is considered a NOEC (9% effect). Three NOECs are available, so normally the lowest will be divided by a factor 0f 10. However, according to Kalf et al. (1999) here the NOEC is divided by a factor of 50 as no acute data are available for the same parameter and process. This yields an MPCsoil of 0.19 mg/kg. For comparison; a risk limit based on the earthworm data would yield >0.913 mg/kg, this is based on the LC50/1000 which is more critical than the NOEC/100 (2.88 mg/kg).. 4.2.3 Ziram For ziram one use-full chronic test was found, a NOEC on the process sulfur oxidation of 292 mg/kg standard soil. This value is divided by 100 to yield an MPCsoil of 2.92 mg/kg. The MPCsoil based on equilibrium partitioning is 0.011 µg/kg (Table 4.1.) and therefore is more stringent than the MPC based on sulfur oxidation. Therefore, for ziram an MPCsoil is proposed of 0.011 µg/kg.. 4.2.4 Chlorothalonil For terrestrial processes 6 chronic data are available for three processes (nitrification, sulfur oxidation and respiration), and 14 acute data are available for processes. In addition, 5 data on enzyme activity are found (Tables 3.1. and 3.2.). No refined assessment was used for the chronic data as only three different processes are covered. The lowest chronic value is 15 mg/kg standard soil for nitrification, the lowest acute value is 0.5 mg/kg standard soil for aerobic nitrogen fixation. As three NOECs are available the risk limit is 0.3 mg/kg (NOEC/50) which is also protective for the acute effects on terrestrial processes and enzyme activity. For terrestrial species, chronic data for three species (Table 3.3.), i.e. fungi, bacteriophyta and earthworm. The lowest observed toxicity value is a LOEC (52% effect) of 5 mg/kg standard soil. This value is converted into a NOEC of 0.5 mg/kg, according to methods generally applied within the project ‘Setting Integrated Environmental Quality Standards’. Using preliminary extrapolation, a risk limit is derived of 0.01 mg/kg standard soil. A factor of 50 is used as no acute data of the same species are available for comparison. So the lowest risk limit derived on direct terrestrial data is 0.01 mg/kg for species, and this value is also lower than the value derived using equilibrium partitioning (Table 4.1.). Therefore, and MPCsoil is proposed for chlorothalonil of 0.01 mg/kg standard soil, which is based on chronic toxicity data for terrestrial species.. 4.2.5 TCMTB For TCMTB no usable direct terrestrial data are found to base an MPCsoil upon (Table 4.1.). As no partition coefficient is available for TCMTB no MPCsoil can be derived..
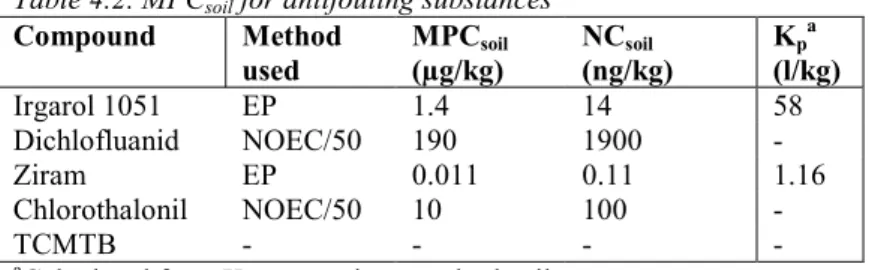
(27) RIVM report 601501 008 Table 4.2. MPCsoil for antifouling substances Compound Method MPCsoil NCsoil used (µg/kg) (ng/kg) Irgarol 1051 EP 1.4 14 Dichlofluanid NOEC/50 190 1900 Ziram EP 0.011 0.11 Chlorothalonil NOEC/50 10 100 TCMTB a Calculated from Koc, assuming standard soil. pag. 27 of 59. Kpa (l/kg) 58 1.16 -.
(28) pag. 28 of 59. RIVM report 601501008.
(29) RIVM report 601501 008. pag. 29 of 59. 5 Discussion 5.1 Occurrence Many of the TBT-substitutes have other agricultural uses (see Voulvoulis et al., 1999a), therefore the concentrations as encountered in the environment cannot solely be attributed to their use as antifoulant. Except for Irgarol 1051, no information was encountered in the open literature on the environmental occurrence in the Netherlands of the chemicals studied here. Recent studies show that Irgarol 1051 is widely distributed in European estuarine and coastal waters and sediments. Concentrations found are up to 0.19 µg/l in water and up to 1.7 µg/l in ports (Readman et al., 1993; Gough et al., 1994; Dahl and Blanck, 1996; Zhou et al., 1996; Tolosa et al., 1996; Scarlett et al., 1997, 1999; Peñalver et al., 1999). Hall et al. (1999) derived 90th percentiles of the concentrations as measured in several European monitoring studies and concluded that these were 316 ng/l, 41 ng/l and 19 ng/l in marinas, estuaries and coastal waters respectively. A clear seasonally bound pattern is observed, with a maximal concentration in early summer (R. Steen, VU, personal communication; Hall et al., 1999). In the Netherlands, along a salinity gradient in the Scheldt, concentrations between 1 and 10 ng/l were found (Steen et al., 1997). Although the Scheldt is a dense shipping lane, concentrations encountered in harbors are expected to exceed these values, in conformity with the aforementioned international studies. The measured concentrations are at a same level as the derived MPC. It is concluded that the species composition and thereby ecosystem functioning is not considered protected. To estimate the environmental concentration of the TBT-substitutes other than Irgarol and to compare the environmental risks between the various TBT-substitutes and TBT, the information from the present report should be combined with information on predicted concentrations. Van Hattum et al. (1999) developed the ‘MAM-PEC model’, which can be used to predict environmental concentrations of antifouling substances in a number of ‘typical’ environments (harbour, estuary, marina, open sea, open sea, shipping lane). The model takes into account emission factors (e.g. leaching rates, shipping intensities), environmental parameters, and compound-related physico-chemical properties. A prediction of future environmental concentrations of the various antifouling chemicals is hampered by the lack of knowledge on their future market-share. Therefore an application factor was introduced, the percentage of ships within a length category to which a product is applied. The model was used to calculate expected concentrations for TBT, Irgarol and Cu. The predicted concentrations appeared to be comparable to concentrations measured in monitoring studies (Van Hattum et al., 1999)..
(30) pag. 30 of 59. RIVM report 601501008. 5.2 Effects observed in the field Field or mesocosm studies were searched for in the open literature for Irgarol 1051, dichlofluanid, ziram and TCMTB. The databases BIOSIS (1985-1996) and CCsearch (19962000) were used for literature search. Ernst et al. (1991) published a field study on the use of chlorothalonil in a pond ecosystem. Effects as observed in the field study were lower than expected based upon laboratory data. Water samples were taken on the water surface for analysis directly after spray. Processes such as sorption to sediment, degradation, dilution, volatilisation and so forth diminished the exposure to chlorothalonil. The diminished exposure explains the differences observed in laboratory and field data.. 5.3 Stability of the antifouling substances Some of the antifouling substances seem to be relatively unstable. This can have consequences for the fate of the substances during the toxicity tests; nominal concentrations can differ substantially from actual concentrations, which leads to an underestimation of the toxicity. However, if the test design is geared to the instability of the test compound (e.g. by using a flow through system) also chronic data can be considered as reliable. Otherwise, acute test results with a test design that is not designated to the instability of the test compound may not be reliable. It can be considered to use acute toxicity data as a basis to derive MPCs. The mostly used end-point in an acute test is lethality, while other endpoints such as growth and reproduction are used in chronic tests. Acute data can also be extrapolated with species sensitivity distributions. However the results should be extrapolated to other type of endpoints and to a chronic situation. For both types of extrapolation, information is needed on extrapolation factors related to the specific mode of action of the chemical considered. These extrapolation factors are not generally available in the open literature. Therefore, we prefer to base the MPC on chronic data if available. An extrapolation based on acute data can be used when compounds are instable. The compounds studied here, certainly if applied as antifouling agent, have a continuous input in the environment and thus can be monitored. A literature inventory is made on the stability of the antifouling substances evaluated in this report.. 5.3.1 Irgarol 1051 Klisenko and Vekhstein (1971) found that Irgarol 1051 was hydrolysed relatively fast, especially at low pH (DT50=0.01 d at pH 3.8, DT50=0.38 d at pH 5.7, DT50=5 d at pH 7.0 and DT50=18 d at pH 8.0). More recent studies, however, show Irgarol 1051 to be relatively stable. Liu et al. (1999) showed that Irgarol 1051 is stable in distilled water in the pH-range 5.0-9.0. At low concentrations of HgCl2 (20 mg/l), Irgarol 1051 concentrations quickly decreased which points to catalysed chemical hydrolysis. Catalysed hydrolysis of Irgarol 1051.
(31) RIVM report 601501 008. pag. 31 of 59. did not occur with other tested heavy metal salts, i.e. AgNO3, CdCl2, CuSO4, PbCl2 and ZnCl2 (Liu et al., 1999). It is concluded that in the pH-range that is relevant for field circumstances and for toxicity tests, hydrolysis does not hamper the interpretation of the literature data. In sea- and freshwater sediment, degradation of Irgarol 1051 is slow and the compound is not readily biodegraded (cited in Scarlett et al., 1999 and Voulvoulis et al. 1999a). Irgarol 1051 was not transformed by a mixture of natural bacteria from Lake Ontario even after an incubation of 5 months (Liu et al., 1997). Irgarol is stable in the marine environment (Callow and Willingham, 1996; Readman, 1996). However, a fungus (Phanerochaete chrysosporium) was able to transform Irgarol 1051 by n-de-alkylation. The metabolite was stable under the test conditions (Liu et al., 1997). Ciba-Geigy (1995) reported a half-life of Irgarol 1051 in sediments of 100-200d. Taken together, the interpretation of data on ecotoxicology and environmental fate of Irgarol 1051 used to derive an MPC is not hampered by a lack of stability.. 5.3.2 Dichlofluanid Dichlofluanid is unstable in an alkaline aqueous environment, it undergoes hydrolysis to the principal metabolite dimethylaminosulphanilide (DMSA, MW = 200.26 g/mol, Figure 4.1.) At pH 7.7 –7.9 and 21°C a DT50 was found of approximately 2 h (Jansma and Linders, 1992). A second hydrolysis study performed in buffered solutions, yielded DT50 values of 15.3 d at pH 4, 19 h at pH 7 and <10 minutes at pH 9 (Jansma and Linders, 1992). No parent compound could be detected at pH 9 even if analysis was performed immediately. The halflife of the parent compound is clearly depending on the pH. As can be found in Table 2.1. of Appendix 2, in the static toxicity tests concentrations dropped fast from a nominal concentration 0.05 to 0.12 mg/l at the beginning of the exposure to a concentration below the detection limit (0.02 mg/l) within a time frame of 48 h. As the pH during the toxicity tests is between 7 and 8 (Table 2.1. in appendix 2), DT50 will in between 19 h and <10 minutes, according to the aforementioned information. Toxicity was observed however, and can presumably be attributed to the products formed (DMSA). The most critical toxicity study (based on nominal concentrations) to base an MPC upon, was a 96h acute toxicity test with fish performed at a pH 7.2-8.0. Although the toxicity was expressed as nominal concentration, also analyses were performed. DMSA was not analysed in the toxicity studies. It is recommended to base an MPC for dichlofluanid on the important metabolites. Because of its instability no MPC is derived for the parent compound. Whenever dichlofluanid is measured in the field, this point to a severe situation that probably results in toxicity. O N. S O. CH3 N CH3. Figure 4.1. Structural formula of DMSA.
(32) pag. 32 of 59. RIVM report 601501008. 5.3.3 Chlorothalonil Laboratory investigations of the photodegradation by direct photolysis (lambda > 290 nm) show that the photolysis of chlorothalonil in water is low (Millet et al., 1998; Peñuela and Barceló, 1998). Extrapolating the laboratory data to half-lives in the environment yielded values of 30 to 200d (Millet et al., 1998). In soil, chlorothalonil is degraded by microbial action. Motonaga et al. (1998) and others before them, showed that after first application the DT50 in soil is relatively short (approximately 2 weeks), but after repeated application the dissipation rate decreases which was explained by the toxicity of the metabolite 4-hydroxy-2,5,6-trichloroisophtalonitrile (TPN-OH) to the microbes. TPN-OH was proved to be stable in soil (Van der Pas et al., 1999). In situ (Dutch flower bulb plants) the amounts of TPN-OH found in soil correspond to up to 16% of the cumulative dose of chlorothalonil that was used (Van der Pas et al., 1999). As the MPC is derived based on aquatic toxicity studies, for sediment multiplied with a fieldderived partition coefficient (in which biodegradation is taken into account), it is not believed that instability of chlorothalonil troubles the interpretation of toxicity data nor the derivation of MPCs.. 5.3.4 Ziram Ziram is not persistent. A study of Brisou and Denis (1969) reports hydrolysis DT50 values at 18-20 °C of 0.2 h (pH 3.8), 9.1 h (pH 5.7), 5 d (pH 7) and 18 d (pH 8). Again, hydrolysis is dependent on pH. A major product after hydrolysis is CS2. In the pH range in which the toxicity studies are performed (pH>7.5), DT50 is higher than the test duration of at least acute toxicity tests, so the parent compound will mainly be responsible for the toxicity and the interpretation of the toxicity tests will not be hampered.. 5.3.5 TCMTB TCMTB appears to be metabolised in soil under aerobic conditions (Fathulla, 1994). DT50 reported at 20°C is 3.4 d. 2-Mercaptobenzothiazole (MBT) appears the most important metabolite, the DT50 of the metabolite under the same circumstances is 1 d. In a water and sediment system, DT50 is 3 d. (Van der Pol and van der Linde, 1999). Hydrolysis rates appear to depend on pH; at pH 5 and 7 DT50s are longer than 35 d, at pH 9 DT50 is 2-3 d (Van der Pol and van der Linde, 1999). TCMTB is rapidly photolysed in water, reported DT50s are 1.5 and 3.9 h, and main metabolite is again 2-mercaptobenzothiazole. However, photolysis rate in a laboratory or a field situation may differ significantly. It is very plausible that especially photolysis plays an important role in the toxicity studies, and that 2mercaptobenzothiazole is at least partly responsible for the observed toxic effects. The MPC derived is based on a study where the actual concentration is measured.. 5.4 Mixture toxicity As for antifouling various chemicals are used, and their main emittance will be in identical areas (i.e. shipping lanes, harbors etc.), mixture toxicity will certainly play a role in the field. We did not consider mixture toxicity in this report, however a so-called ‘toxic unit’ approach can be used (Könemann, 1981) for assessing site-specific situations..
(33) RIVM report 601501 008. pag. 33 of 59. An MPC for the toxicity of copper and zinc was covered by Crommentuijn et al. (1997b). For ziram zinc is used as a counterion, and the complex will partly dissociate in the water phase. The degree of dissociation will depend on environmental conditions such as pH and the presence of zinc ions and other counterions. For reason of the uncertainty in the speciation, we did not integrate the toxicity of zinc in the MPC for ziram. As zinc is very commonly monitored, an exceeding of the MPC for zinc will be observed separately..
(34) pag. 34 of 59. RIVM report 601501008. References Aldenberg, T. (1993) A program to calculate confidence limits for hazardous concentrations based on small samples of toxicity data. RIVM Rreport no. 719102015 Aldenberg, T.; Slob, W. (1993) Confidence limits for hazardous concentrations based on logistically distributed NOEC toxicity data. Ecotox. Environ. Saf. 25:48-63. Aldenberg, T.; Jaworska, J.S. (2000) Uncertainty of the hazardous concentration and fraction affected for normal species sensitivity distributions. Ecotoxicol. Environ. Saf. 46:1-18. Brisou, J.; Denis, F. (1969) Utilisation des bacteries pour la detection de certains pesticides. Comp. Rend. Soc. Biol. 6:1426-1427. Brownlee, B.G.; Carey, J.H.; MacInnis, G.A.; Pellizzari, I.T. (1992) Aquatic environmental chemistry of 2(thiocyanomethylthio)bezothiazole and related benzothiazoles. Environ. Toxicol. Chem. 11:1153-1168 Callow, M.E.; Willingham, G.L. (1996) Degradation of antifouling biocides. Biofouling 10: 239-249 Caux, P-Y.; Kent, R.A.; Fan, G.T.; Stephenson, G.L. (1996) Environmental fate and effects of chlorothalonil: a Canadian perspective. Crit. Rev. Toxicol. 26:45-93. Ciba-Geigy (1995) Irgarol 1051 in antifouling paints. Technical information bulletin. Ciba-Geigy, Basel, Switzerland Clare, A.S. (1996) Marine natural product antifoulants: Status and potential. Biofouling 9:211-229 Crommentuijn, T., Kalf, D.F.; Polder, M.D.; Posthumus, R.; Van de Plassche, E.J. (1997a) Maximum Permissible concentrations and negligible concentrations for pesticides. RIVM report no. 601501 002. Crommentuijn, T., M.D. Polder and E.J. van de Plassche (1997b). Maximum Permissible Concentrations and Negligible Concentrations for metals: taking background concentrations into account. RIVM report no. 601501 001. Dahl, B.; Blanck, H. (1996) Toxic effects of the antifouling agent Irgarol 1051 on periphyton communities in coastal water microcosms. Mar. Pollut. Bull. 32:342-350 Davies, P.E.; Cook, L.S.J.; Goenarso, D. (1994) Sublethal responses to pesticides of several species of australian freshwater fish and crustaceans and rainbow trout. Environ. Toxicol. Chem. 13:1341-1354 De Bruijn, J.; Crommentuijn, T.; Van Leeuwen, K.; Van der Plassche, E.; Sijm, D.; Van der Weiden, M. (1999) Environmental Risk Limits in the Netherlands. RIVM report no. 601640001. Deneer, J.W., Sinnige, T.L., Seinen, W. and Hermens, J.L.M. (1988). The joint acute toxicity to Daphnia magna of industrial organic chemicals at low concentrations. Aquatic Toxicology, 12: 33-38. DiToro, D.M.; Zarba. C.S.; Hanssen, D.J.; Berry, W.J.; Swartz, R.C.; Cowan, C.E.; Pavlou, S.P.; Allen, H.E.; Thomas, N.A.; Paquin, P.R. (1991) Technical basis for establishing sediment quality criteria for nonionic organic chemicals using equilibrium partitioning. Environ. Toxicol. Chem. 10:1541-1583 ECB (1996) Technical Guidance Documents in support of the Commission Directive 93/67/EEC on Risk Assessment for New Notified Substances and the Commission Regulation (ec) 1488/94 on Risk Assessment for Existing Substances. Ispra, Italy. Ernst, W.; Doe, K.; Jonah, P.; Young, J.; Julien, G.; Hennigar, P. (1991) The toxicity of chlorothalonil to aquatic fauna and the impact of its operational use on a pond ecosystem. Arch. Environ. Contam. Toxicol. 21:1-9. Fathulla, R.N. (1994) Aerobic soil meatbolism of 14C-TCMTB. Hazleton. Report no. HWI 6176-169. 100 pp. USA Flemming, H-C.; Griebe, T.; Schaule, G. (1996) Antifouling strategies in technical systems - a short review. Wat. Sci. Tech. 34:517-524 Gallagher, E. P.; Di Giulio, R.T. (1992a) Glutathione-mediated chlorothalonil detoxification in channel catfish gills. Mar. Environ. Res. 34: 221-226 Gallagher, E.P.; Canada, A.T.; Di Giulio, R.T. (1992b) The protective role of glutathione in chlorothalonilinduced toxicity to channel catfish. Gough, M.A.; Fothergill, J.; Hendrie, J.D. (1994) A survey of Southern England coastal waters for the s-triazine.
(35) RIVM report 601501 008. pag. 35 of 59. antifouling compound Irgarol 1051. Mar. Pollut. Bull. 28:613-620. Graphpad Prism® [computer program]. Windows 95 /NT version. Version 2.01. San Diego (US): Graphpad Software Inc., 1996. Hall, L.W.; Giddings, J.M.; Solomon, K.R.; Balcomb, R. (1999) An ecological risk assessment for the use of Irgarol 1051 as an algaecide for antifoulant paints. Crit. Rev. Toxicol. 29:367-437. Holt, J.S. (1993) Mechanisms and agronomic aspects of herbicide resistence. Ann. Rev. Plant Physiol. Plant Mol. Biol. 44:203-229 Jansma, J.W.; Linders, J. (1992) Dichlofluanide. Advisory report nr. 88/678801/090, RIVM/CSR (In Dutch) Jongbloed, R.; Luttik, R. (1996) 2-methylthio-4-tertbutylamino-cylcopropylamino-s-triazine (Irgarol 1051). Advisory report nr. 4351, RIVM/CSR (In Dutch) Kalf, D.F.; Mensink, B.J.W.G.; Montforts, M.H.M.M. (1999) Protocol for the derivation of harmonised maximum permissible concentrations (MPCs). RIVM report no. 601506 001 Karickhoff, S.W. (1981) Semi-empirical estimation of sorption of hydrophobic pollutants on natural sediments and soils. Chemosphere 10:833-846 Klisenko, M.A.; Vekhstein, M.Sh. (1971) Kinetics of the hydrolysis of metal derivatives of dialkyldithiocarbamic and ethylenebisdithiocarbamic acids in their dependence on the pH of the medium, and identification of their transformation products. Zh. Obshch. Khimii 5: 1125-1130. Könemann, H. (1981) Fish toxicity tests with mixtures of more than two chemicals: a proposal for a quantitative approach and experimental results. Toxicology 19:229-238. Kooijman, S.A.L.M. (1987) A safety factor for LC50 allowing differences in sensitivity among species. Wat. Res. 21: 269-276 Kruzynski, G.M.; Birtwell, I.K. (1994a) A predation bioassay to quantify the ecological significance of sublethal responses of juvenile chinook salmon (Onchorhynchus tshawytscha) to the antisapstain fungicide TCMTB. Can. J. Fish. Aquat. Sci. 51: 1780-1790 Kruzynski, G.M.; Birtwell, I.K.; Chew, G.L. (1994b) Behavioural approaches to demonstrate the ecological significance of exposure of juvenile Pacific salmon (genus Oncorhynchus) to the antisapstain fungicide TCMTB. J. Aquat. Ecosystem Health 3:113-127 Liu, D.; Maguire, R.J.; Lau, Y.L.; Pacepavicius, G.J.; Okamura, H.; Aoyama, I. (1997) Transformation of the new antifouling compound Irgarol 1051 by Phanerochaete chrysosporium. Wat. Res. 31:2363-2369. Liu, D.; Pacepavicius, G.J.; Maguire, R.J.; Lau, Y.L.; Okamura, H.; Aoyama, I. (1999) Mercuric chloridecatalyzed hydrolysis of the new antifouling compound Irgarol 1051. Wat. Res. 33:155-163 MacKinnon, D.L.; Farrell, A.P. (1992) The effect of 2-(thiocyanomethylthio)benzothiazole on juvenile coho salmon (Oncorhynchus kisutch): sublethal toxicity testing. Environ. Toxicol. Chem. 11:1541-1548 Millet, M.; Palm, W-U.; Zetsch, C. (1998) Abiotic degradation of halobenzonitriles: Investigation of the photolysis in solution. Ecotox. Environ. Saf. 41:44-50. Montforts, M.H.M.M. (1999) Chlorothalonil. CSR advisory report 06105A00 Motonaga, K.; Takagi, K.; Matumoto, S. (1998) Suppression of chlorothalonil degradation in soil after repeated application. Environ. Toxicol. Chem. 17:1469-1472. Ordelman, H.G.K.; Van Noort, P.C.M.; Van Steenwijk, J.M.; Ten Hulscher, T.E.M.; Beek, M.A.; Botterweg, J.; Faasen, R.; Frintrop, P.C.M.; Evers, H.G. (1993) Dithiocarbamaten, een analyse van de problematiek in aquatisch milieu. RIZA nota 93.025 Peñalver, A.; Pocurull, E.; Borrull, F.; Marcé, R.M. (1999) Solid-phase microextraction of the antifouling Irgarol 1051 and the fungicides dichlofluanid and 4-chloro-3-methylphenol in water samples. J. Chromatogr. A. 839:253-260. Peñuela, G.A.; Barceló,, D. (1998) Photodegradation and stability of chlorothalonil in water studied by solidphase disk extraction, followed by gas chromatographic techniques. J. Chromatogr. A 823:81-90. Posthumus, R. (1999) MTR voor chloorthalonil. CSR advisory report 06532a00 Readman, J.W.; Wee Kwong, L.L.; Grondin, D.; Bartocci, J.; Villeneuve, J.P.; Mee, L.D. (1993) Coastal water.
(36) pag. 36 of 59. RIVM report 601501008. contamination from a triazine herbicide used in antifouling paints. Environ. Sci. Technol. 27: 1940-1942 Readman, J. (1996) Antifouling herbicides-a threat to the marine environment? Mar. Poll. Bull. 32:320-321 Reuther, C.; Crommentuijn, T.; Van de Plassche, E.J. (1998) Maximum permissible concentrations and negligible concentrations for aniline derivatives. RIVM report no. 601501 003 Rogers, H.R.; Watts, C.D.; Johnson, J. (1996) Comparative predictions of Irgarol 1051 and atrazine fate and toxicity. Environ. Technol. 17: 553-556. Scarlett A, Donkin ME, Fileman TW, Donkin P. (1997) Occurence of the marine antifouling agent Irgarol 1051 within the Plymouth Sound locality; implications for the green macroalga Enteroporpha intestinalis . Mar Pollut Bull 34: 645-651. Scarlett, A.; Donkin, P.; Fileman, T.W.; Evans, S.V.; Donkin, M.E. (1999) Risk posed by the antifouling agent Irgarol 1051 to the seagrass Zostera marina. Aquat. Toxicol. 45:159-170 Solomon, K.R.; Baker, D.B.; Richards, R.P.; Dixon, K.R.; Klaine, S.J.; La Point, T.W.; Kendall, R.J.; Weisskopf, C.P.; Giddings, J.M.; Giesy, J.P.; Hall, L.W.; Williams, W.M. (1996) Ecological risk assessment of atrazine in North American surface waters. Environ. Toxicol. Chem. 15:31-76. SRC (1997) SRC-Log Kow for windows, version 1.53. Steen, R.J.C.A.; Leonards, P.E.G.; Brinkman, U.A.Th.; Cofino, W.P. (1997) Ultra-trace-level determination of the antifouling agent Irgarol 1051 by gas chromatography with tandem mass spectrometric detection. J. Chromat. 766:153-158. Tanabe, S.; Prudente, M.; Mizuno, T.; Hasegawa, J.; Iwata, H.; Miyazaki, N. (1998) Butyltin contamination in marine mammals from North Pacific and Asian coastal waters. Environ. Sci. Technol. 32:193-198. Ten Hallers-Tjabbes, C.C.; Kemp, J.F.; Boon, J.P. (1994) Imposex in Whelks (Buccinum undatum) from the Open North Sea: Relation to Shipping Traffic Intensities. Mar. Pollut. Bull. 28:311-313. Tibosch, H.; Luttik, R.; Linders, J. (1993) Ziram. Advisory report no. 93/67101/100, 1st amendment, RIVM/CSR (In Dutch) Tolosa, I.; Readman, J.W.; Blaevoet, A.; Ghilini, S.; Bartucci, J.; Horvat, M. (1996) Contamination of Mediteranean (Cote d’Azûr) coastal waters by organotins and Irgarol 1051 used in antifouling paints. Mar. Pollut. Bull. 32:335-341. Tomlin, C.D.S. (ed.) (1997) The Pesticide Manual, Eleventh Edition. British Crop Protection Council, Surrey, UK Van de Plassche, E.J. (1994) Towards integrated environmental quality objectives for several compounds with a potential for secondary poisening. RIVM report no. 679101 012 Van de Plassche, E.J.; Van der Hoop, M.; Posthumus, R.; Crommentuijn, T. (1999) Risk limits for boron, titanium, tellurium, uranium and organosilicon compounds in the framework of EU Directive 76/464/EEC. RIVM report no. 601501 005 Van der Pas, L.J.T.; Matser, A.M.; Boesten, J.J.T.I.; Leistra, M. (1999) Behaviour of matamitron and hydroxychlorothalonil in low-humic sandy soils. Pestic. Sci. 55:923-934. Van der Pol, J.J.C.; Van der Linde, A. (1999) TCMTB. Advisory report no. 06456a00, RIVM/CSR (In Dutch) Van Hattum, B.; Baart, A.C.; Boon, J.G.; Steen, R.; Ariese, F. (1999) Computer model to generate predicted environmental concentrations (PECs) for antifouling products in the marine environment. IVM-E99/15, Institute for Environmental Studies, Amsterdam, 68 p. Van Leeuwen, C.J.; Van der Zandt, P.T.J.; Aldenberg, T.; Verhaar, H.J.M.; Hermens, J.L.M. (1992) Application of QSARs, extrapolation and equilibrium partitioning in aquatic effects assessment. I. Narcotic industrial pollutants. Environ. Toxicol. Chem. 11:267-282 Van Leeuwen, C.J., Verhaar, H.J.M. and Hermens, J.L.M. (1996). Quality criteria and risk assessment for mixtures of chemicals in the aquatic environment. Human and Ecological Risk Assessment, 2: 419-425. Van Straalen, N.M.; Denneman, C.A.J. (1989) Ecotoxicological evalutation of soil quality criteria. Ecotoxicol. Environ. Saf. 18:241-251 Van Wezel, A.P.; Traas, T.; Polder, M.; Posthumus, R.; Van Vlaardingen, P.; Crommentuijn, T.; Van der Plassche, E.J. (1999a) Maximum permissible concentrations for polychlorinated biphenyls. RIVM report.
(37) RIVM report 601501 008. pag. 37 of 59. no. 601501 006 Van Wezel, A.P.; Posthumus, R.; Van Vlaardingen, P.; Crommentuijn, T.; Van de Plassche, E.J. (1999b) Maximum Permissible Concentrations and Negligible Concentrations for phthalates (dibutylphthalate and di(2-ethyl-hexyl) phthalate), with special emphasis on endocrine disruptive properties. RIVM report no. 601501 007 Voulvoulis, N.; Scrimshaw, M.D.; Lester, J.N. (1999a) Alternative antifouling biocides. Appl. Organometal. Chem. 13:135-143 Voulvoulis, N.; Scrimshaw, M.D.; Lester, J.N. (1999b) Analytical methods for the determination of 9 antifouling paint booster biocides in estuarine water samples. Chemosphere 38; 3505-3516 VROM (1989) Premises for risk management. Risk limits in the context of environmental policy. Second chamber, session 198801989, 21137, no.5 Zhou, J.L.; Fileman, T.W.; Evans, S.; Donkin, P.; Mantoura, R.F.C.; Rowland, S.J. (1996) Seasonal distribution of dissolved pesticides and polynuclear aromatic-hydrocarbons in the Humber estuary and Humber coastal zone. Mar. Pollut. Bull. 32:599-608.
Afbeelding


+7


GERELATEERDE DOCUMENTEN
The overall aim of this thesis was to firstly determine multi-mycotoxin exposure levels of infants and young children and its effects on infant growth parameters in deep rural areas
Artificial intelligence Artificial neural networks Command blocks Case-based reasoning Computerized maintenance management system Decision support systems European reliability
[B true ]: True FDG activity concentration in the phantom background; [S true ]: True FDG activity concentration in the phantom spheres; A ref : Reference FDG activity; COV:
Doel Doel van de Helpdesk RIVM Stoffen Expertise Centrum SEC is het efficiënt beantwoorden van vragen van verschillende doelgroepen over de potentiële risico's van chemische
Het RIVM heeft in acht afvalwatermonsters en 32 monsters van ventilatielucht, die verspreid over het jaar 2008 door Urenco zijn afgenomen, de totaal alfa en totaal-beta
The last result, home language seems a bit biased, given that the PISA booklet from the Ministry of Education and Research found that on average 22% of students fill out
The aim of this thesis is to understand how metabolic alterations and environmental factors that influence them, such as diet and oxygen pressure, affect senescent cells and
In de inleiding wordt ge- steld: “dat twee zaken van belang zijn als het gaat om de samenwerking tussen onderwijs- praktijk en onderwijsonderzoek: het draag- vlak onder
