Scientific Assessment and Policy Analysis
WAB 500102 021
Fossil Fuel Deposit Fires
Occurrence Inventory, design and
assessment of Instrumental Options
Report
500102 021Authors
P.M. van Dijk C. Kuenzer J. Zhang K.H.A.A. Wolf J. Wang September 2009CLIMATE CHANGE
SCIENTIFIC ASSESSMENT AND POLICY ANALYSIS
Fossil Fuel Deposit Fires
Occurrence Inventory, design and assessment of Instrumental Options
This study has been performed within the framework of the Netherlands Research Programme on Scientific Assessment and Policy Analysis for Climate Change (WAB), for the project Fossil Fuel
Wetenschappelijke Assessment en Beleidsanalyse (WAB) Klimaatverandering
Het programma Wetenschappelijke Assessment en Beleidsanalyse Klimaatverandering in opdracht van het ministerie van VROM heeft tot doel:
• Het bijeenbrengen en evalueren van relevante wetenschappelijke informatie ten behoeve van beleidsontwikkeling en besluitvorming op het terrein van klimaatverandering;
• Het analyseren van voornemens en besluiten in het kader van de internationale klimaatonderhandelingen op hun consequenties.
De analyses en assessments beogen een gebalanceerde beoordeling te geven van de stand van de kennis ten behoeve van de onderbouwing van beleidsmatige keuzes. De activiteiten hebben een looptijd van enkele maanden tot maximaal ca. een jaar, afhankelijk van de complexiteit en de urgentie van de beleidsvraag. Per onderwerp wordt een assessment team samengesteld bestaande uit de beste Nederlandse en zonodig buitenlandse experts. Het gaat om incidenteel en additioneel gefinancierde werkzaamheden, te onderscheiden van de reguliere, structureel gefinancierde activiteiten van de deelnemers van het consortium op het gebied van klimaatonderzoek. Er dient steeds te worden uitgegaan van de actuele stand der wetenschap. Doelgroepen zijn de NMP-departementen, met VROM in een coördinerende rol, maar tevens maatschappelijke groeperingen die een belangrijke rol spelen bij de besluitvorming over en uitvoering van het klimaatbeleid. De verantwoordelijkheid voor de uitvoering berust bij een consortium bestaande uit PBL, KNMI, CCB Wageningen-UR, ECN, Vrije Universiteit/CCVUA, UM/ICIS en UU/Copernicus Instituut. Het MNP is hoofdaannemer en fungeert als voorzitter van de Stuurgroep.
Scientific Assessment and Policy Analysis (WAB) Climate Change
The Netherlands Programme on Scientific Assessment and Policy Analysis Climate Change (WAB) has the following objectives:
• Collection and evaluation of relevant scientific information for policy development and decision–making in the field of climate change;
• Analysis of resolutions and decisions in the framework of international climate negotiations and their implications.
WAB conducts analyses and assessments intended for a balanced evaluation of the state-of-the-art for underpinning policy choices. These analyses and assessment activities are carried out in periods of several months to a maximum of one year, depending on the complexity and the urgency of the policy issue. Assessment teams organised to handle the various topics consist of the best Dutch experts in their fields. Teams work on incidental and additionally financed activities, as opposed to the regular, structurally financed activities of the climate research consortium. The work should reflect the current state of science on the relevant topic. The main commissioning bodies are the National Environmental Policy Plan departments, with the Ministry of Housing, Spatial Planning and the Environment assuming a coordinating role. Work is also commissioned by organisations in society playing an important role in the decision-making process concerned with and the implementation of the climate policy. A consortium consisting of the Netherlands Environmental Assessment Agency (PBL), the Royal Dutch Meteorological Institute, the Climate Change and Biosphere Research Centre (CCB) of Wageningen University and Research Centre (WUR), the Energy research Centre of the Netherlands (ECN), the Netherlands Research Programme on Climate Change Centre at the VU University of Amsterdam (CCVUA), the International Centre for Integrative Studies of the University of Maastricht (UM/ICIS) and the Copernicus Institute at Utrecht University (UU) is responsible for the implementation. The Netherlands Environmental Assessment Agency (PBL), as the main contracting body, is chairing the Steering Committee.
For further information:
Netherlands Environmental Assessment Agency PBL, WAB Secretariat (ipc 90), P.O. Box 303, 3720 AH Bilthoven, the Netherlands, tel. +31 30 274 3728 or email: wab-info@pbl.nl.
Preface
This report presents factors that influence the quantification of green house gas (GHG) emissions released by uncontrolled fossil fuel deposit fires (mostly coal seam fires, hence often abbreviated to ‘coal fires’). The major unanswered question in fossil fuel deposit fire research is “How much global-warming relevant GHG is released by coal fires on a local, regional, country-wide, and global scale?” The answer to this question is of economic interest because uncontrolled fossil fuel deposit fire- related emission minimization could contribute to certified emissions trading under the Clean Development Mechanism (CDM) of the Kyoto Protocol and protocols to follow.
We indicate why the topic of fossil fuel deposit fire emission quantification is highly sensitive and present several reasons why reliable global coal fire quantification has not yet been achieved. This report focuses on the numerous obstacles in the quantification of coal fire emissions that have to be overcome to publish reasonable and scientifically sound numbers. Key parameters that complicate GHG emission quantification include variations in coal petrography, heterogeneities in coal layering, differences in overburden bedrock characteristics, varying crack and vent pathway densities above the burning seam, variations in the degree of combustion, uncertainties in measuring techniques, as well as the problem of spatial, and especially timely, transfer of results. Despite these challenges, we present an outlook on options for the future quantification of coal fires.
In this study we have concentrated on field- and laboratory studies of combustion of organic shales (as current results are available and comparable to coal seam fires), we present three case studies on coal fire-related GHG emission quantification on provincial scale in China, and we propose an integrated quantification option aimed at the joint analyses of local knowledge, geophysical data, and remote sensing data with the objective to retrieve numbers that are unbiased by economic and political interferences. As a first estimate, we conclude that the emissions of GHGs from coal fires in China account for well less than 0.4% of all human-induced global annual CO2 emissions, most likely even less than 0.1%. This is much less than
This report has been produced by:
Dr. Paul van Dijk, Wang Jun1) , Prasun Gangopadhyay
International Institute for Geo-Information Science and Earth Observation (ITC), Department of Earth Systems Analysis
Dr. Karl-Heinz Wolf
TU-Delft, Faculty Civil Engineering and Geosciences, Section Applied Geophysics & Petrophysics
Dr. Claudia Kuenzer2), Dr. Jianzhong Zhang2)
TU-Vienna, Institute of Photogrammetry and Remote Sensing (IPF)
1) Ningxia Coalfield Fire-fighting Project Management Department, Shenhua Ningxia Coal
Industry Co. Ltd.
2) In 2008 as private consultants
Name, address of corresponding author:
Paul van Dijk
International Institute for Geo-Information Science and Earth Observation (ITC) Department of Earth Systems Analysis (ESA)
P.O.Box 6
7500 AA Enschede http://www.itc.nl E-mail: vandijk@itc.nl
Disclaimer
Statements of views, facts and opinions as described in this report are the responsibility of the author(s).
Copyright © 2009, Netherlands Environmental Assessment Agency
All rights reserved. No part of this publication may be reproduced, stored in a retrieval system or transmitted in any form or by any means, electronic, mechanical, photocopying, recording or otherwise without the prior written permission of the copyright holder.
Contents
Executive Summary 9
Samenvatting 13
1 Introduction 17
1.1 Scope of the report 17
1.2 Relation to Kyoto protocol and CDM 18 1.3 Challenges for coal fire related emission quantification 19 1.3.1 Difficult to approach and measure 21 1.3.2 Variability in degree of combustion 21 1.3.3 Surface temperature patterns and coal fire-related energy release 22 1.3.4 The challenge of timely predictions 23 1.3.5 The challenge of extrapolation to other areas 23 1.3.6 Difference in estimated CO2 emission from coal fires 23
2 Previous Research 25
2.1 Borehole methods 25
2.2 Geophysical methods 25
2.3 Inventory of the global scope of fossil fuel fires by remote sensing 26 3 Modelling Fossil Fuel Fires: Spontaneous combustion of organic shales:
Fieldwork, laboratory observations and modelling 29
3.1 Introduction – Geology 29
3.2 Field data and literature 30
3.3 Geophysical exploration 33
3.4 Laboratory experiments and results 35
3.5 Experimental results 36
3.5.3 Matrix permeability 38
3.6 The combustion and convection model 39
3.6.1 Model explanation 39
3.6.2 Parameter definition 40
3.7 Results and discussion 41
3.7.1 Notes: 43
3.8 Conclusions 43
4 Case study: Rujigou syncline, Ningxia, China 45 4.1 Location and history of coal fires in Ningxia 45
4.2 Impacts of the coal fires 47
4.3 Coal fire fighting methods in Ningxia 49 4.4 Monitoring coal fire in Ningxia 52 4.4.1 Temperature measurements 52
4.4.2 Gas content analysis 52
4.4.3 Remote sensing approach 53
4.4.4 Monitoring coal fires using geophysics and geochemistry methods 53 5 Case study: Wuda syncline, Inner Mongolia, China 57
5.1 Location and history of coal fires in Wuda 57 5.2 Impacts of the coal fires in Wuda 59 5.3 Coal fire fighting methods in Wuda 60 5.4 Figures for coal loss in Inner Mongolia 60 5.5 Satellite monitoring of coal fires in Wuda 60 5.6 Monitoring coal fire extent and intensity using thermal photos in Wuda 62 6 Case study of a province: Xinjiang autonomous region, China. 63 6.1 Location and history of coal fires in Xinjiang 63 6.2 Impacts of the coal fires in Xinjiang 65 6.3 Coal fire fighting methods in Xinjiang 66 6.4 Monitoring coal fires in Xinjiang 66 7 Automated detection of thermal anomalies due to fossil fuel fires 69
7.1 Theory of Algorithms for Coal Fire Risk Area Demarcation and Thermal
Anomaly detection 69
7.2 Application of Algorithms for Coal Fire Risk Area Demarcation and Thermal
Anomaly detection based on Landsat, MODIS and ASTER data 77 7.2.1 Combination of algorithm synergetic effects: Experiments with Landsat data 77 7.2.2 Detection of unknown fires: Field survey in September 2003 80 7.2.3 Detection of unknown fires: Field survey in June 2004 81 7.2.4 Thermal anomaly extraction based on MODIS and ASTER data 82
7.2.5 Data (pre-) analyses 84
7.2.6 Multi band extraction results 86 7.2.7 Multi diurnal extraction results 88 7.2.8 Multi temporal extraction results (different years) 92 7.2.9 Comparison results with high resolution TIR data 93
7.3 Discussion and conclusions 98
8 Estimation of GHG emission due to fossil fuel fires 99 8.1 Proposed method to approximate coal fire-related emissions 99 8.1.1 Method for local GHG emission estimation of a single coal fire 99 8.1.2 Method for regional GHG emission estimation of one coal fire area 100 8.1.3 Estimation of GHG emissions for Ningxia 100 8.1.4 Estimation of GHG emissions for the Wuda coal mining region, and other
occurrences in Inner Mongolia 100 8.1.5 Estimation of GHG emissions for the Xinjiang province 103 8.2 Method for national GHG emission estimation (province or country) 103
8.2.1 Conclusions 105
8.3 Global estimation of GHG emission from fossil fuel deposit fires. 105 9 Technical options of (future) satellite derived CO2 quantifications 107
9.1 Introduction 107
9.2 Theoretical options and limitations for CO2 anomaly detection 108
References 109
List of Tables
1 Difficulties for direct in situ measurements of the three quantitative coal fire parameters: amount of burning coal, amount of energy release, amount of
emitted gasses 20
2 Interrelationships of public, political and economic pressures with regard to low or
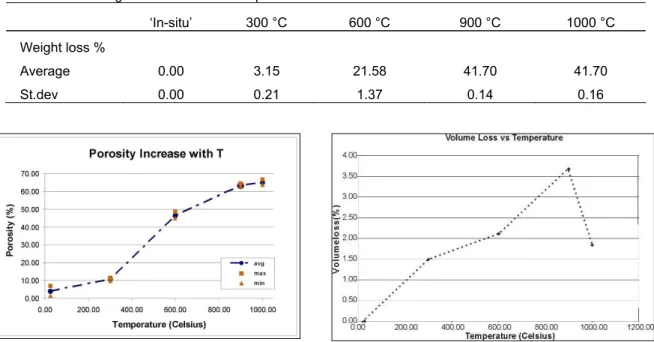
high estimates of coal fire related GHG emission 24 3 Heating and temperature profile of the core samples 36 4 Mineral content by XRF-analysis of in-situ sample 37 5 Overview of weight loss at different temperatures 37
6 Porosity measurements 38
7 Permeability vs. temperatures 38
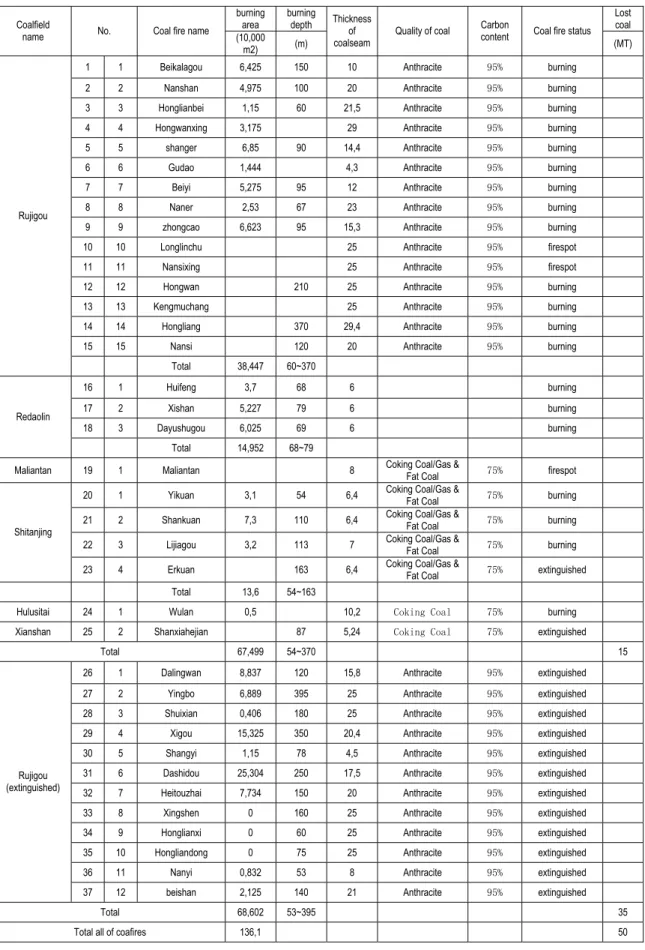
8 Main parameters convection and combustion model 41 9 Parameter variation versus maximum temperature 42 10 Coal fire statistics in Ningxia province, China 46 11 Atmospheric quality standard (mg/m3), above they ‘standard value’ conditions for
the inhabitants are considered harmful 48 12 Atmospheric monitoring measurements (autumn) 48 13 Atmospheric monitoring measurements (winter) 49
14 Sensor characteristics 53
15 Coal fires statistics in Xinjiang (shaded names appear in the text and/or
illustrations) 64
16 Coal classification in China 65
17 Coal fire risk area delineation supporting the exclusion of false alarms 78 18 Specifications of MODIS images used in this study 83 19 Thermal anomaly extraction in data from 4 different times of the day as extracted
from the thermal band 32 91 20 Thermal anomaly extraction in data from 4 different times of the day as extracted
from the ratio band (20/32) 91 21 Coal fire emissions in Wuda as estimated from reported burning coal volume and
22 Coal fire emissions in China as estimated from reported and assumed burning
coal volume. 104
List of Figures
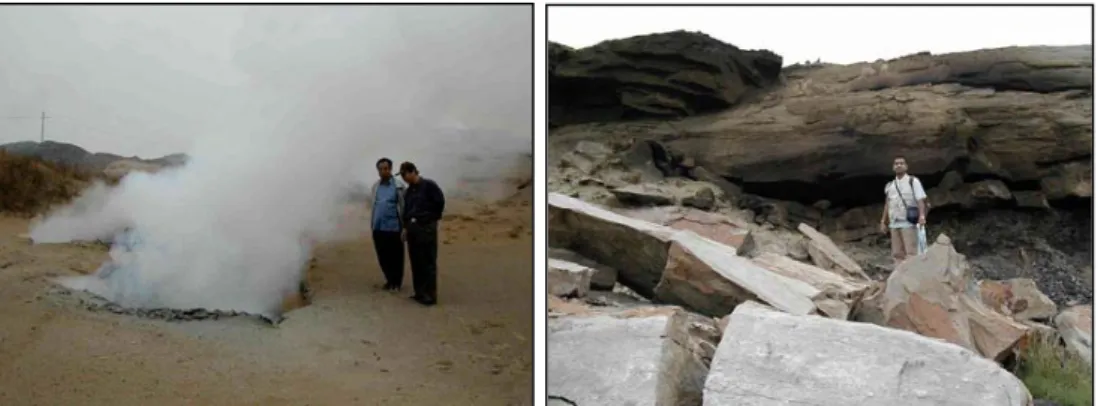
1 Strong gas emission through sinkhole above a subsurface coal fire (left) and coal
fire induced bedrock collapse (right), both in Wuda, Inner Mongolia, China. 18 2 Relationship between the three major quantitative coal fire parameters: amount of
burning coal, amount of gasses emitted, and amount of energy released
(Kuenzer et al. 2007d) 20 3 Complex system of a shallow subsurface coal fire. Numerous influences in a near
chaotic system hamper the quantification of burned coal and related gaseous
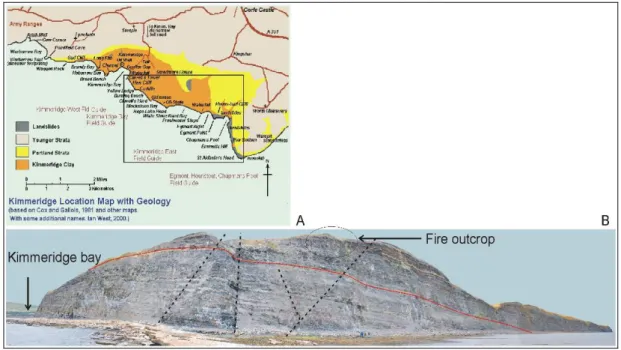
emissions. (Kuenzer et al. 2007d) 21 4 Coal fire related energy release 22 5 A: Location map. B: View of the cliff from Kimmeridge bay to St’ Aldhelms head. 30
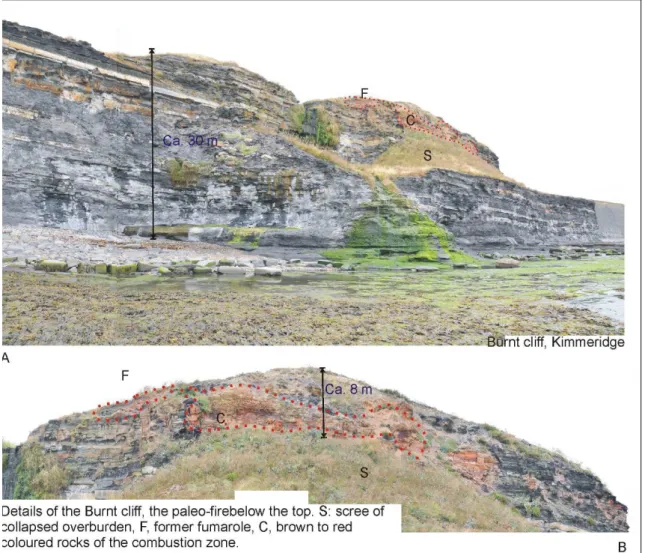
6 A and B: Details of Burnt Cliff 31
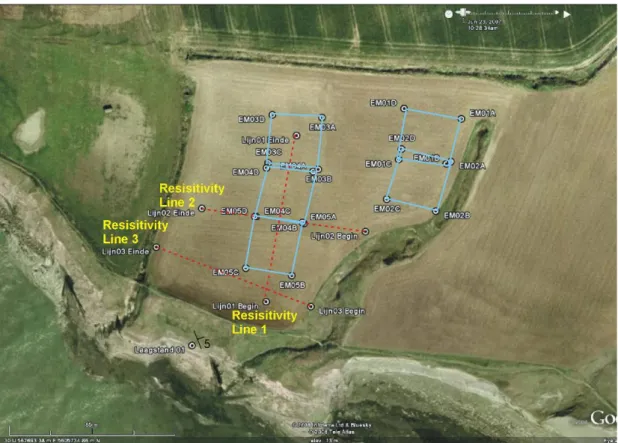
7 A. Major fault system in the cliff, consisting of extension faults 32 8 Location of the geophysical lines for Induced Resistivity (red) and TDEM (blue)
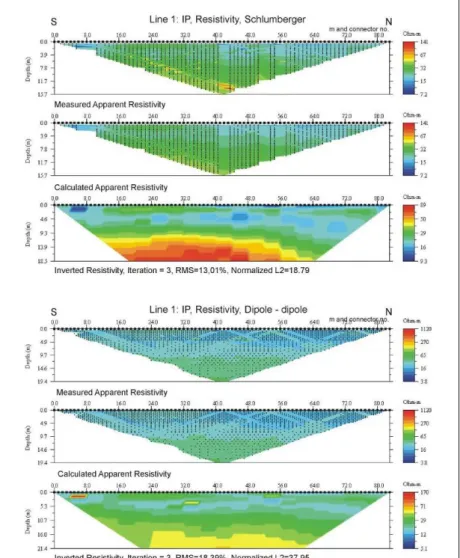
measurements, starting ca. 20 m from the cliff head 33 9: Resistivity measurements of line 1; perpendicular to the cliff face. 34 10 Resistivity measurements of line 3; parallel to the cliff face 35 11 Porosity (A) and volume loss (B) as a function of temperature after thermal
treament 37
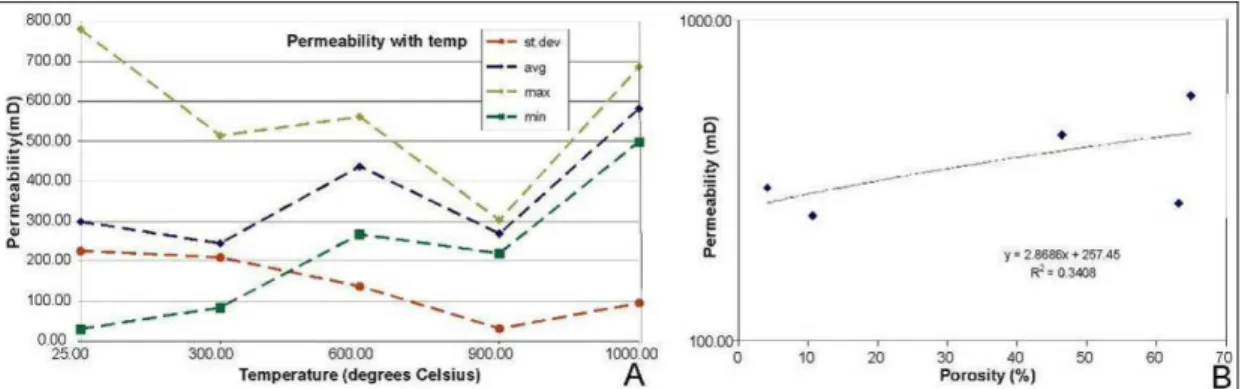
12 A: Permeability versus temperature, including minimum and maximum values and
the standard deviation. B Log permeability as a function of the porosity. 39 13 Model domains for the Kimmeridge cliffs, as an adaption to the original model of
Wolf (2006) 40
14 Convection model result: Oxygen concentration [%], flow [m3/(m/s)] 42 15 Coal fire distribution map for Rujigou coal mining area 45 16 a and b Fire fighting by water supply (a) and drilling to inject synthetic foam (b) 50 17 a and b: large excavation operation at Beishan coal fire area to remove entire
burning coal layer. c and d: Coal fire at Nanyi (a) taken in 1997, (b) taken in 2002 after excavation and rehabilitation. e and f: Coverage of coal fire outcrop at a cliff above the village of Rujigou, with a pond for extra protection (e), and coverage of
coal fire with overburden, note new cracks developing near the cliff face (f) 51 18 A 19 month Gas content analysis from a monitoring borehole. Pink: temperature
in °C; blue: Oxygen content in %; yellow: CO in ppm 52 19 Electro-magnetic field measurements in Rujigou area 54 20 Thermal photos of the Beishan coal fire 55 21 Wuda syncline. Background image: Landsat 7 ETM+, optical colour composite
(nir, red, green; bands 4,3,2) 57
22 Location of the Wuda coalmine area 58 23 Wuda syncline as seen in panchromatic (black-and-white) 60 cm high-resolution
Quickbird satellite imagery 61
24 A: Coal fire #7 in Wuda coal mining syncline. B: Daytime, and C: Nighttime
thermal camera field photo 62
25 A Chinese map of Xinjiang coal fire areas distribution (red dots are coal fires) 63 26 A: Multiple incised river terraces along the Totunhue river, near Kelazha, Xinjiang.
B: Red colored pyrometamorphic rock (‘klinker’) along Totunhue river scarp, with
cracks due to coal fire related subsidence on foreground. 65 27 A: Qitaibeishan open pit mining with coal fire. B: Inspection of borehole in
sand/gravel covered coal fire at Qitaibeishan (1995) 66 28 Overview Xinjiang. Location: latitude 42°31' to 42°50, longitude 81°19 to 81°S34', 67 29 Fire fighting techniques at Xiaolongkao/xiaohuangshan coal fire in Dahuanshan
coal mining area (Number 17 in Table 15), Xinjiang, illustrating a combined effort
of covering coal fires with overburden, and injection if water/mud in the hot zone. 68 30 Delineating the area, in which coal fire related thermal anomalies can be
31 Radiometrically corrected Landsat-7 ETM+ spectra for different surfaces. (here: 6=mid infrared, 7=thernak infrared to present channels in the correct wavelengths
range) 70
32 Summarized workflow of the knowledge based test sequence 73 33 A moving window filter of varying size (11*11 to 35 * 35) investigated the thermal
data set 74
34 Histogram for thermal anomalous areas on a night-time ETM+ image acquired in
2002 76
35 Sequence of the algorithm for automated thermal anomaly extraction 77 36 Synergy of spectral test sequence (coal fire risk area delineation) and thermal
algorithm: rejection of false alarms outside the delineated risk areas 79 37 Coal fire risk areas superimposed on the panchromatic band of Landsat 7 ETM+
scene of 21.09.2002 79
38 Thermal clusters extracted with the automated detection algorithm based on Landsat 7 ETM+ night-time data from 28.09.2002 superimposed on the
panchromatic band of Landsat ETM+ daytime data from 21.09.2002 80 39 Newly detected coal fire in the valleys of Hulusitai and Shitanjing about 30km
northeast of Rujigou 81
40 Newly detected coal fire in the valley east of the Yellow River about 27 km
southeast of Wuda city 82
41 Comparison of MODIS radiant temperatures in band 20 (b) and band 32 (c), and
ratio image (d) for pre-dawn data of February 17, 2005 85 42 Thermal clusters extracted with the automated detection algorithm based on
MODIS ratioed pre-dawn data from 02.02.2005 86 43 Thermal anomaly extraction for the MODIS predawn subset of February 17th
2005 87
44 Number of anomalies extracted from band 20, band 32 and a ratio-band of bands
20 and 32 for MODIS pre-dawn data on February 17th 2005 88 45 Thermal anomalies extracted from band 32 (TIR) of a morning (a), afternoon (b),
evening (c) and a pre-dawn scene (d) 89 46 Thermal anomalies extracted the ratio band (20/32) of a morning (a), afternoon
(b), evening (c) and a pre-dawn scene (d) 90 47 Statistics of multi-diurnal thermal anomaly extraction for morning, afternoon,
evening and pre-dawn data from the MODIS thermal band 32 92 48 Multi-temporal comparison of anomaly extraction for an evening dataset of
November 2001 (left side) and an evening dataset of 2005 (right side) for band
20, 32 and the ratio band. The MODIS subset has an extent of 172 km x 85 km. 93 49 a: Thermal anomalous clusters extracted from ASTER band 14 (orange), MODIS
warm areas from band 32 (grey) and MODIS hottest zones from the ratio image
(white) in February/March 2005 95
50 MODIS hot spot anomalies from pre-dawn ratio data (white) and extracted daytime thermal anomalies from LANDSAT band 6 data (orange) overlain on a
multispectral LANDSAT subset of Jharia coal field 96 51 Two coal mining and storage areas 150 km west (a) and 50 km west (b) of Jharia. 97 52 Coal fire mapping result in Wuda syncline for the year 2003 (top) and for a newly
Executive Summary
Introduction
This project brings together existing knowledge on the problem of combustion of in-situ fossil fuel deposits, in particular coal occurrences. It links the physical properties of coal and its combustion emission products to detection and monitoring options with state-of-the-art earth observation techniques, and with an outlook to future methods, including improved sensors and (semi)automated detection algorithms. Concerning fire extinguishing it focuses on the technical difficulties of monitoring and auditing aspects of reduction schemes (like CDM), with an inventory of current fire fighting techniques.
The report can be summarized in four main parts:
• In-situ and laboratory modeling of combustion (Chapter 3 on Kimmeridge organic shales).
• 3 case studies in China, with detailed tables on coal loss in mines for the provinces Ningxia, Inner Mongolia and Xinjiang (Chapters 4, 5 and 6).
• The potential of automated detection of thermal anomalies in readily available remote sensing data (Chapter 7).
• An estimation of GHG emission (Chapter 8), based on the data in the previous chapters. In addition, Chapter 9 explores the option of CO2 emission quantification from point sources
(like fossil fuel deposit fires, but also industry and urban areas) through satellite observations; a theoretical option that is still out of reach with present day technology. Theoretically, a remote sensing and radiative transfer based model that estimates CO2 concentration can be made for a
given plume height of a geo-natural event such as coal fire. However, the proposed model would deal with uncertainties that can not be resolved as yet.
Problem setting
The problem of quantification of GHG emission from fossil fuel deposit fires can be approached from 3 sides (see Figure 2):
1) The measurement of direct emission of CO2 into the atmosphere;
2) The measurement of exact amount of coal lost in combustion (referred to as ‘coal burnt’), multiplied by factors for carbon content and CO2 (and possibly CH4) generation;
3) The measurement of energy release from the combustion, and recalculation to amount of fuel and subsequently CO2 (and possibly CH4) generated.
As the first option is not feasible with the present technology, as stated above, and the third contains still too much uncertainty with regards to modeling energy transfer and coupling to remote sensing observations (besides the very dynamic and rapidly fluctuating nature of deposit fires), the present study is based on the most reliable figures of coal lost and coal burnt that are provided by the Chinese coal mining authorities. The main constituents of the report are summarized in the next sections.
In-situ and laboratory modeling of combustion
(Chapter 3 on Kimmeridge organic shales).
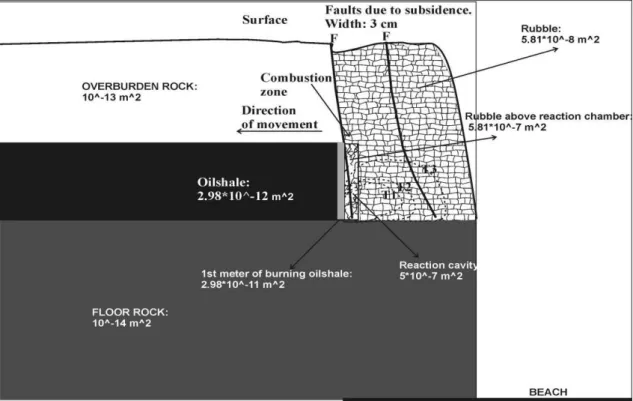
The convection and combustion model applied to simulate combustion of an oil shale cliff near Kimmeridge Bay, Southern England, provides a good perception of the in-situ behaviour. On one hand, observations at burning cliff and laboratory experiments were essential to get the requested parameters as input for modelling. On the other hand, the model provided explanations for the pyrometamorphical behaviour as observed at the outcrops. The model proved to be applicable at lower temperatures. Therefore, it also can be used in areas where low caloric coals are being subject to coal fires. It can be concluded that the maximum combustion temperature (800 K) hardly changes with the thickness of the combustion zone, and this is of direct importance to the thermal modelling of combustion in remotely sensing. The permeability of the rubble zone (or scree) in the model is of greater importance for changing of
the maximum temperature, which is in agreement with the perceived importance of cracks and vents in the case of subsurface coal fires. The oxygen concentration in the model shows that in all cases the oxidation process consumes all oxygen and that temperature is permeability dependent. Translation of the results to other regions in the world and to coal deposits is only possible when local geological conditions and petrophysical parameters are known. In addition, local climate is also an important factor. Therefore, it remains complicated to estimate a world wide CO2 contribution of fossil fuel deposits. Hence, an inventory based on occurrence and
climate is essential. Estimation of the world wide CO2 contribution of (low grade) coals and oil
shales is only possible when climate conditions and the occurrence of (seasonal) coal fires are correlated and quantified.
Case studies in 3 provinces of China
(Chapters 4 on Ningxia, 5 on Inner Mongolia and 6 on Xinjiang).
In these chapters an overview is given of coal fire related research over the last 2 decades. In addition, new tables are presented that are compiled by the Chinese mining authorities. The tables contain the best possible estimation of the amount of coal lost through fires, and are made by the coal mining companies. A distinction needs to be made clear between coal lost trough burning (‘coal burnt’), and in addition coal lost because the reserves are not (economical) recoverable any more (‘coal lost’ = burnt coal + uneconomical rest of coal that is not (completely) burnt).
Even though there is still a limited chance of over-estimation (by local mines in order to be eligible to receive more financing for fire extinguishing), we believe that these figures are subjected to mutual internal review and therefore can be used as a reasonable estimation base. In the province of Ningxia 37 coal fires occur of which 14 are extinguished. The Rujigou coal mining area is used as case study for Ningxia (it contains 27 of the 37 coal fire locations, of which 12 are extinguished). The total coal lost is estimated at 50 Mt (up to end of 2007, seeTable 10 ). It is estimated that about 2 million tons of coal is burned out per year. Between 11.6 and 7 million tons of CO2 are generated annually accordingly (resp. with and without
contribution from CH4).
For Inner Mongolia no detailed figures per location are available. The known coal fire regions are: Wuda, Gulaben, Zhozi Shan and Er Duo Si. Note Gulaben is located west of Rujigou (province Ningxia), and in fact the continuation of the same synclinal deposit. The Wuda coal field is used as case study, and forms the most important mining area with the most severe coal fire problem. The total amounts for the entire province are estimated at 64 individual coal fires, totaling 2280 * 10,000 m2 and 4.5 Mt coal burnt per year. The upper limit for annual emission is
20.25 Mt CO2 equivalent (incl. CH4) and the lower limit is 10 Mt CO2.
The coal fires in Xinjiang make up for 435 Mt of coal loss per year (Table 15). However, this includes the coal that is remaining inaccessible afterwards (‘coal lost’). It is estimated that there is about 13.5 Mt of coal directly burnt out per year. The Xinjiang coal fire fighting team has already extinguished 8 coal fire fields during the last 50 years, and presently is working on 31 coal fires. 13.5 Mt of coal per year burnt from coal fire in Xinjiang generates between 67.5 (incl. CH4) and 36 million tons of CO2. In 1995, the Xinjiang coal fire fighting team made a plan to
extinguish all the coal fires in Xinjiang by the year of 2015, instead of the 2020 in the previous plan.
The potential of automated detection of thermal anomalies in remote sensing data
(Chapter 7).
The algorithm for automated detection of thermal anomalies due to fossil fuel fires using remote sensing data includes two steps. One step is automated delineation of coal fire risk areas using multi-optical bands. The other step is to automatic detection of the thermal anomalies using thermal band data. This algorithm was developed based on the known coal fires in the Wuda
mining area. Later it is used to detect unknown fires in China, and in India. It is established that the method is feasible by using the data from Landsat-7, ASTER, and MODIS. Night-time thermal data have the best contrast for detection thermal anomalies due to fossil fuel fires from the background. In principle it is possible to use this algorithm to generate a world fossil fuel fires distribution map (however that is a very large assignment).
The area of a thermal anomaly extracted by the algorithm varies when data from different times or different source satellites are used. This is because the thermal anomaly on the earth surface varies with its surrounding conditions. When the surrounding temperature is high, such as in summer and/or during the day, the anomaly has a smaller area. When the surrounding temperature is low, such as in winter and/or at night, the same coal fire forms an anomaly with a bigger area. More research is needed for comparing anomalies from different times. At present, there is still not a feasible way to quantify the development of fossil fuel fires by using remote sensing data, but it is feasible to tell the existence and relative size of a fossil fuel fire. The conclusion is that the link between in-situ fossil fuel fire models (such as presented in Chapter 3) and remote sensing monitoring cannot be made yet.
An estimation of GHG emission
(Chapter 8).
China
The reported total burnt coal in Xinjiang, Ningxia, and Inner Mongolia is 13.5+2+4.5 = 20 million tons, which we take as an upper limit for the annual total uncontrolled combustion of coal in China, because this concerns an upper estimate with considerable margins, and in other provinces the problem is much less. In the most conservative approach (assuming each ton releasing 2.7 tons of CO2 and 0.1 tons of CH4), this would lead to an annual emission of 100 Mt
CO2 equivalent (including methane) and 54 Mt without methane. It is very unlikely that the upper
limit is realistic, because complete combustion will not give any CH4, and incomplete
combustion will leave uncombusted remants of coal in the ground. Furthermore we cannot completely rule out some exaggeration in view of government subsidy for extinghuising. We conclude that coal fire-related emissions in China accounts for well less than 0.4% of all human-induced global annual CO2 emissions, probably even less than 0.1% (5-10 Mt coal burnt/year).
Global estimation
Unfortunately, no reliable figures (or even estimates) for global in-situ combustion from fossil fuel deposits exist. Therefore it is very hard to estimate the GHG emission due to the fossil fuel fires. However, taking into account the global coal reserves and coal production figures, as well as the climate conditions, we assume that the global CO2 emission due to uncontrolled
combustion can not be more than 4 times the probable emission from China. The upper limit is 100 Mt (192 Mt with possible CH4 included), which amounts to 0.4% (0.7% with methane
included) of the global annual human-induced CO2 budget. A more reliable inventory of global
CO2 emission from uncontrolled combustion of fossil fuel deposits needs to be elaborated, and
Key findings
The most important results can be summarized as follows: About methodology and technical options:
• Using earth observation data for direct detection of CO2 from point sources, though
theoretically possible, is beyond the present technical options. The gap, both in signal strength and spatial resolution (from km2 to m2), is still too large and is not expected to be closed in the near future.
• Routine detection of thermal anomalies in areas prone to fossil fuel fires is proven to be feasible with operational satellites, and can be achieved globally with sufficient support of sensor availability and processing capacity, as well as an outline of coal bearing sedimentary basins (approx. 1:500,000 scale).
• A quantitative link between thermal anomalies to amount of fuel burnt and CO2 emitted
depends on further work on the thermal models of fossil fuels and its coupling to remote sensing data, also provided that limited ground truth is available.
About quantification with presently available data:
• China: Based on the detailed data on coal burnt in the 3 most seriously affected provinces of China, we estimate a maximum emission of 100 Mt CO2 equivalent
(including methane, calculated at 23x CO2). This would be in the order of 0.1-0.4% of
total human-induced global annual CO2 emission.
• Global: Due to a lack of a reliable inventory of fossil fuel fires and annual losses due to combustion, we can only make a rough estimation. Given the various uncertainties we estimate it to be in the range of 0.4-0.7 % of human-induced global annual CO2
emission.
Samenvatting
Introductie
Dit project inventariseert bestaande kennis betreffende het probleem van ontbranding van
in-situ fossiele brandstof voorkomens, in het bijzonder steenkool afzettingen. De fysische
eigenschappen van steenkool en de gassen die bij verbranding vrijkomen worden in verband gebracht met de technische mogelijkheden van detectie en monitoring met behulp van hedendaagse aardobservatie technieken, evenals te verwachten toekomstige ontwikkelingen, inclusief verbeterde sensoren en (semi-)automatische detectie algorithmen. Wat betreft het bestrijden van de branden worden de technische problemen van het vastleggen en verantwoorden van emissie reductie (zoals CDM) besproken, inclusief een invertarisatie van huidige brandbestrijdingstechnieken.
Het rapport kan samengevat worden in 4 hoofdthema’s:
• In-situ en laboratorium modellering van verbranding van fossiele brandstoffen (Hoofdstuk 3
over Kimmeridge organische schalies).
• 3 case studies in China, met gedetailleerde tabellen over het verlies van steenkool in de mijnen van de provincies Ningxia, Inner Mongolia en Xinjiang (Hoofdstuk 4, 5 en 6).
• De mogelijkheid van automatische detectie van thermale anomaliën in normal verkrijgbare remote sensing data (Hoofdstuk 7).
• Een schatting van broeikasgas emissie (Hoofdstuk 8), gebaseerd op de data uit de voorgaande hoofdstukken.
Hiernaast geeft Hoofdstuk 9 een overzicht van de mogelijkheid om CO2 uitstoot uit puntbronnen
te kwantificeren (zoals van fossiele brandstof voorkomens, maar ook industrie en urbane gebieden) door middel van satelliet observatie; een theoretische optie die nog buiten bereik van de hedendaagse technologie ligt. In theorie kan een op remote sensing gebaseerd stralingsinteractie model de CO2 concentratie schatten van een bepaalde hoogte van een
natuurlijk fenomeen zoals een kolenbrand. Echter zo‘n model zou met onzekerheden te maken hebben die nog niet opgehelderd zouden kunnen worden.
Probleemstelling
Het probleem van de kwantificatie van broeikasgas (GHG) emissie van fossiele brandstof voorkomens kan van 3 kanten benaderd worden (zie Figuur Figure 2):
1) Het meten van de directe emissie van CO2 in de atmosfeer;
2) Het bepalen van de exacte hoeveelheid steenkool die verloren gaat door ontbranding, vermenigvuldigd met de factoren voor koolstof gehalte en CO2 (en evt. CH4) ontstaan;
3) Het vaststellen van de energie ontwikkeling door de verbranding, en herleiding tot de hoeveelheid brandstof en vervolgens de ontstane CO2.
Omdat de eerste optie niet haalbaar is met de huidige stand van de technologie, zoals hierboven aangegeven, en de derde mogelijkheid nog teveel onzekerheid bevat ten aanzien van het modeleren van energie overdracht en koppeling aan aardobservatie (nog afgezien van de zeer dynamische en snel fluctuerende aard van de branden), is de huidige studie gebaseerd op de meest betrouwbare cijfers van steenkool verlies door verbranding die door de Chinese kolenmijn autoriteiten verstrekt is. De belangrijkste bevindingen van het rapport worden in de volgende paragrafen samengevat.
In-situ en laboratorium modellering van verbranding
(Hoofdstuk 3 over Kimmeridge organische schalies).
Het convectie en verbrandingsmodel dat werd ontwikkeld om de verbranding van een olieschalie klif in de buurt van Kimmeridge Bay (Zuid Engeland) te simuleren, geeft een goed inzicht in het in-situ gedrag. Aan de ene kant waren de observaties aan de brandende klif en de laboratorium experimenten essentieel om de gewenste parameters als invoer voor het model te
verkrijgen. Aan de andere kant gaf het model verklaringen voor het pyro-metamorf gedrag van het gesteente zoals waargenomen in de klif. Het model bleek ook toepasbaar bij lagere temperaturen. Daarom kan het ook gebruikt worden in gebieden waar laag-calorische steenkool aan kolenbranden ten prooi valt. Er kan geconcludeerd worden dat de maximale verbrandingstemperatuur (800 K) nauwelijks veranderd met de dikte van de brandende laag, en dit is van direct belang voor de thermische modellering van brandhaarden in remote sensing. De permeabiliteit van de puin zone (of steenslag) in het model is van groter belang voor de variatie in de maximum temperatuur, wat in overeenstemming is met het veronderstelde belang van scheuren en openingen in het geval van onderaardse steenkool branden. De zuurstof concentratie in het model laat zien dat in alle gevallen het oxidatie proces alle beschikbare zuurstof consumeert, en de temperatuur in feite van de permeabiliteit afhangt. Toepassing van deze resultaten op andere regio’s in de wereld, en op steenkool voorkomens is alleen mogelijk als lokale geologische condities en petrofysische parameters bekend zijn. Daarnaast is het lokale klimaat ook een belangrijke factor. Derhalve blijft het zeer moeilijk om tot een wereldwijde schatting van de CO2 bijdrage van brandende fossiele brandstof voorkomens te komen. Om
deze reden is het noodzakelijk om tot een gezamenlijke inventarisatie van steenkool voorkomens en klimaat zones te komen. Schatting van de bijdrage aan de wereldwijde uitstoot van CO2 door brandende fossiele koolwaterstof voorkomens is alleen mogelijk als zowel de
klimaat omstandigheden als de (seizoensgebonden) branden gecorreleerd en gekwantificeerd worden.
Case studies in 3 provincies van China
(Hoofdstukken 4 over Ningxia, 5 over Inner Mongolia en 6 over Xinjiang).
In deze hoofdstukken wordt een overzicht gegeven over onderzoek gerelateerd aan spontane steenkoolbranden over de laatste 2 decennia. Daarnaast worden nieuwe tabellen gepresenteerd die zijn samengesteld door de Chinese steenkoolmijn autoriteiten. De tabellen bevatten de best mogelijke schatting van de hoeveelheid steenkool die verloren is gegaan door branden, gemaakt door de mijnbouw bedrijven zelf. Hierbij moet een verschil worden gemaakt tussen verloren gegaan door verbranding (‘coal burnt’), en verloren gegaan doordat de steenkool niet meer (economisch) winbaar is (‘coal lost’ = verbrande steenkool + niet economisch winbare resterende (gedeeltelijk) onverbrande steenkool).
Het is niet onmogelijk dat hier een element van te hoge schattingen in zit (door lokale mijnen om meer fondsen voor bluswerkzaamheden te verkrijgen), wij gaan er echter van uit dat deze cijfers door middel van onderlinge vergelijking en controle redelijk betrouwbaar zijn als basis voor betrouwbare schattingen.
Er bevinden zich 37 steenkoolbranden in de provincie Ningxia, 14 hiervan zijn geblust. Als voorbeeld studie wordt het Rujigou steenkool mijngebied gebruikt (het bevat 27 van de 37 steenkoolbrand locaties, waarvan er 12 zijn geblust). De totale hoeveelheid verbrande steenkool (coal burnt) wordt geraamd op 50 Mt (miljoen ton; tot eind 2007, zie Table 10). Naar schatting ongeveer 2 Mt steenkool wordt verbrand per jaar. Als gevolg hiervan wordt jaarlijks tussen de 11.6 and 7 miljoen ton CO2 gegenereerd (resp. met en zonder CH4).
Er zijn geen gedetailleerde cijfers per locatie bekend voor Inner Mongolia. De bekende steenkool mijngebieden zijn: Wuda, Gulaben, Zhozi Shan en Er Duo Si. Het zij vermeldt dat Gulaben zich ten westen van Rujigou (provincie Ningxia) bevindt, en in feite de voortzetting van dezelfde synclinale afzetting is. Het Wuda steenkool veld wordt gebruikt als voorbeeldstudie; het vormt het belangrijkste mijngebied met het ernstigste probleem van steenkoolbranden. De totale hoeveelheden voor de hele provincie worden geschat op 64 individuele steenkool branden, over een gebied van 2280 * 10,000 m2 met een verlies (coal burnt) van 4.5 Mt steenkool per jaar. De bovengrens voor jaarlijkse emissie is 20.25 Mt CO2 equivalent (incl. CH4)
en de ondergrens is 10 Mt CO2.
De steenkoolbranden in Xinjiang hebben 435 Mt verlies aan steenkool per jaar tot gevolg (‘coal lost’;Table 15). Echter, dit is inclusief de niet-winbare steenkool die achterblijft. Naar schatting verbrandt ongeveer 13.5 Mt steenkool per jaar (‘coal burnt’). Het steenkoolbrand
bestrijdingsteam in Xinjiang heeft tot nu toe 8 steenkool brandhaarden gestopt in de laatste 50 jaar, en op dit moment werkt men aan 31 steenkoolbranden. De 13.5 Mt steenkool (‘coal burnt’) per jaar van de branden in Xinjiang veroorzaakt tussen de 67.5 (incl. CH4) en 36 Mt CO2
uitstoot. Het steenkoolbrand bestrijdingsteam in Xinjiang heeft in 1995 een plan gemaakt om alle steenkoolbranden tegen 2015 te beëindigen (en niet 2020 zoals in het vorige plan).
De mogelijkheden van automatische detectie van thermale anomalieën in remote sensing data
(Hoofdstuk 7).
Het algoritme voor automatische detectie van temperatuur anomalieën als gevolg van steenkoolbranden met aardobservatie data bevat twee stappen. De eerste is de automatische afbakening van risico gebieden voor steenkoolbranden met behulp van multi-optische banden. De tweede stap is het automatisch detecteren van temperatuur anomalieën met behulp van de data uit de thermale banden. Het algoritme is ontwikkeld op basis van de bekende steenkool-branden in het Wuda mijngebied. Daarna is het gebruikt om nog onbekende brandhaarden in China en India op te sporen. Hieruit blijkt dat deze methode bruikbaar is met data van Landsat-7, ASTER en MODIS. Nachtelijek opnamen in het thermale gedeelte van het spectrum hebben het beste contrast voor de detectie van temperatuur anomalieën als gevolg van steenkoolbranden ten opzichte van de achtergrond. Het is in principe mogelijk dit algoritme te gebruiken om een wereldwijde inventarisatie van steenkoolbranden te maken (dit is zou echter een zeer omvangrijke taak zijn).
Het oppervlakte van een temperatuur anomalie die door het algoritme wordt bepaald kan variëren omdat data van verschillende satellieten, en van verschillende opname tijden, wordt gebruikt. Dit komt omdat de temperatuurs anomalie op het aardoppervlakte varieërt met verschillende omgevings condities. Als de omgevingstemperatuur hoog is, zoals in de zomer en/of overdag, heeft de anomalie een kleinere omvang. Als de omgevingstemperatuur laag is, zoals in de winter en/of in de nacht, vormt dezelfde steenkoolbrand een anomalie van grotere omvang. Meer onderzoek is noodzakelijk om de anomalieën van verschillende omvang en opnametijd te vergelijken. Op dit moment is er nog geen goede methode om de ontwikkeling van steenkoolbranden te kwantificeren met behulp van aardobservatie, maar het is wel mogelijk het bestaan en de relative grootte te bepalen. De conclusie is dat de koppeling tussen fysische modellen van in-situ steenkoolbrand (zoals gepresenteerd in hoofdstuk 3) en monitoring met behulp van aardobservatie nog niet gemaakt kan worden.
Schatting van broeikasgas uitstoot
(Hoofdstuk 8).
China
De gedocumenteerde totale hoeveelheid verloren steenkool (‘coal burnt’) in Xinjiang, Ningxia, en Binnen Mongolië is 13.5+2+4.5 = 20 miljoen ton. Dit bedrag wordt aangenomen als bovengrens van de totale jaarlijkse hoeveelheid ongecontroleerde verbranding van steenkool in China, omdat we spreken over een bovengrens met ruime marge, en dit probleem in andere provincies veel geringer in omvang is. In de meest conservatieve schatting (waarin aange-nomen wordt dat iedere ton steenkool 2,7 ton CO2 en 0,1 ton CH4 oplevert) zou dit een jaarlijke
uitstoot geven van 100 Mt CO2 equivalent (inclusief methaan) and 54 Mt zonder methaan. Het is
erg onwaarschijnlijk dat de bovenlimiet realistisch is, omdat volledige verbranding geen methaan meer zou opleveren, en onvolledige verbranding nog restanten onverbrande steenkool in de grond zou overlaten. Bovendien kunnen we niet geheel uitsluiten dat enige overdrijving heeft plaatsgevonden met het oog op het verkrijgen van overheids subsidie voor bestrijden van de branden. Wij concluderen dat de steenkoolbrand gerelateerde uitstoot in China voor veel minder dan 0,4% bijdraagt aan de jaarlijkse wereldwijde hoeveelheid van alle menslijk veroorzaakte CO2 uitstoot, waarschijnlijk zelfs minder dan 0,1% (5-10 Mt ‘coal burnt’/jaar).
Wereldwijde schatting
Helaas bestaan er geen betrouwbare gegevens (of zelfs maar schattingen) voor wereldwijde
in-situ verbranding van fossiele brandstof voorkomens. Derhalve is het erg moeilijk om tot een
schatting van de broeikasgas uitstoot van deze branden te komen. Echter, uitgaande van de wereldwijde steenkool reserves en steenkoolproductie cijfers, en tevens van de klimaatzones, nemen wij aan dat de wereldwijde uitstoot van CO2 ten gevolge van ongecontroleerde
verbranding niet meer kan zijn dan 4 maal de waarschijnlijke uitstoot in China. Deze bovengrens is 100 Mt (192 Mt inclusief mogelijke CH4), wat overeenkomt met 0,4% (0,7%
inclusief methaan) van het wereldwijde jaarlijkse menselijk veroorzaakte CO2 budget. Een
betrouwbaardere inventarisatie van de wereldwijde uitstoot van CO2 door ongecontroleerde
verbranding van fossiele brandstof moet nog ontwikkeld worden, en ligt niet binnen de mogelijkheden qua tijd en beschikbare middelen van dit project.
Samenvatting op hoofdlijnen
De meest belangrijke resultaten kunnen als volgt worden samengevat:
Wat betreft de methodologie en technische mogelijkheden:
• Het gebruik van aardobservatie data voor de directe detectie van CO2 vanuit
puntbronnen, alhoewel theoretisch mogelijk, ligt buiten de huidige technische mogelijk-heden. Het verschil, zowel in signaalsterkte als in ruimtelijk oplossend vermogen (van km2 naar m2), is nog steeds te groot en het wordt niet verwacht dat dit in de nabije toekomst overbrugd zal worden.
• Routinematige detectie van temperatuur anomalieën in risico gebieden voor ontbranding van fossiele brandstofvoorkomens is mogelijk gebleken met operationele satelliet-gegevens, en zou wereldwijd bereikt kunnen worden met voldoende beschikbaarheid van sensoren en dataverwerkingscapaciteit. Tevens is daarvoor de wereldwijde configuratie van steenkoolhoudende sedimentaire bekkens noodzakelijk (plm. 1:500.000 schaal).
• Een kwantitatief verband tussen temperatuurs anomalieën aan de oppervlakte en de hoeveelheid verloren gegane brandstof en gerelateerde CO2 uitstoot kan pas gelegd
worden na verder onderzoek aan de thermische modellen van fossiele brandstof en de koppeling hiervan aan aardobservatiegegevens, met beperkte beschikbaarheid van grondverificatie.
Wat betreft kwantificatie met de huidige beschikbare gegevens:
• China: Gebaseerd op de gedetailleerde gegevens met betrekking tot verloren gegane steenkool (“coal burnt”) in de drie provincies van Chian waar dit probleem het ernstigste is, schatten wij een maximum uitstoot van 100 Mt CO2 equivalent (inclusief methaan
bijdrage, gesteld op 23x CO2). Dit zou in de orde van 0,1-0,4% van de totale menselijk
veroorzaakte jaarlijkse wereldwijde CO2 uitstoot zijn.
• Wereld: Wegens een gebrek aan betrouwbare inventarisatie van spontane branden in fossiele brandstof voorkomens, en daarmee gepaard gaande jaarlijkse verliezen aan brandstof, kunnen we alleen een ruwe schatting maken. Gegeven de verschillende onzekerheden schatten wij de bijdrage hiervan aan de totale jaarlijkse menselijk veroorzaakte CO2 uitstoot in de orde van 0,4-0,7%.
• Verder onderzoek om deze schattingen beter te begrenzen is noodzakelijk om een meer betrouwbare uitkomst te verkrijgen.
1
Introduction
1.1 Scope of the report
Fossil fuel deposit fires are an environmental and economic threat and have been researched by numerous investigators from various disciplines (Bylo, 1960; Greene et al., 1969; Lapham et al., 1980; Banerjee, 1982; Bhattacharya and Reddy, 1994; Zhang, 1996; Rosema et al., 1999; Prakash and Gupta, 1999; Zhang, J., et al., 2004; Zhang, X., et al., 2004; Zhang, J., 2004; Zhang J. et al. 2007, Zhang and Kuenzer 2007, Litschke et al., 2005; Lohrer et al., 2005; Wessling et al., 2008; Kuenzer et al., 2005; Kuenzer et al., 2007a/b/c/d; Kuenzer and Stracher, 2008, Kuenzer et al. 2008). In this report we mainly deal with uncontrolled combustion of coal and organic shale deposits. Other hydrocarbon sources are excluded, such as natural gas and oil leakage from underground reservoirs, coalbed methane leakage (Kuenzer et al. 2007a), and submarine gas hydrates (containing both CO2 and CH4). Organic shales are also known to be
prone to spontaneous combustion (UK, Middle East, North Africa). A continuum exists from forest fires through peat fires to lignite and coal fires, for example in Kalimantan, Indonesia. Our estimation does not take into account the forest and peat-fires.
We refer to a coal fire as a burning or smoldering coal seam or coal waste that has been ignited by spontaneous combustion. Coal fires are reported from China, India, the United States, Australia, Indonesia, Venezuela, South Africa, Russia, Croatia, and other countries. Coal fires can ignite naturally or through human influence, whereas the latter is the cause in most cases of coal fire ignition. Coal ignites though a process called spontaneous combustion. The reaction of carbon in the coal with oxygen in the air is an exothermal process. This means during the reaction of carbon (C) and oxygen (O) to CO2 heat is released. If this heat cannot be released
from the inner surfaces of a coal volume the coal can ignite at temperatures as low as 80°C. Conditions, which favor the process of spontaneous combustion are a large coal volume, insufficient ventilation, hot outside temperatures, low coal quality (high volatile content), large outer and inner surface of the coal particles (e.g. through expansion and shrinking in case of repeated wetting and drying) and mining activity. Although paleo-coal fires burning for hundreds of years, and as early as Pleistocene, are known that prove the existence of naturally occurring coal fires, most coal fires existing nowadays are related to mining activities. Mining leads to the exposure of formerly covered coal volumes to the outside air. Mining furthermore leads to the extension of the inner surface of coal volumes and exposes the coal to the anthropogenic risk of accidental ignition through open fire (negligent acts: technical accidents, cigarettes, coal burning for cooking and heating) (Kuenzer, 2005; Zhang, 2004; Rosema et al. 1999; van Genderen and Guan, 1997). Coal fires lead to the loss of the economic resource (coal), uncontrolled land subsidence due to the volume loss underground, the deterioration of vegetation, and most important, the emission of green house-relevant and toxic gasses (see Figure 1 ). Detailed analyses of the environmental impacts of coal fires can be found in Kuenzer and Voigt (2003) and Kuenzer et al. (2007b). This report focuses on green house gasses (GHGs) released by coal fires. Carbon dioxide (CO2) and methane (CH4) are the only gasses released by coal fires
that are considered GHGs by the Kyoto Protocol. In this report we concentrate on CO2
emissions, given the fact that CH4 emissions are minor compared to CO2 and CH4 has a limited
atmospheric residence time, although its greenhouse effect is 23x1 that of CO2. However in the
final estimation, we do include a figure including CH4 as well.
Several other detrimental (environmental) effects of natural coal fires are: - useless
consumption of a non-renewable energy resource, increase of aerosols in the local atmosphere, coaldust and ashes are usually deposited in the nearby agricultural fields and housing areas, and toxic elements (like As, F, Hg, Se) can contaminate water resources and enter the food chain (Finkelman et al., 2001).
1 In this report a multiplication factor of 23 for methane versus CO
2 is used whereas in more recent IPCC
Numerous authors have addressed the problem of coal fires based on geologic, mineralogical, geophysical and remote sensing based research. While the first research group is mainly interested in the formation of new minerals around coal fire induced cracks and vents and investigates chemical changes of the coal and surrounding bedrock or facilitates bore hole drillings and geologic / geomorphologic mapping to date age, depth and progression of a fire (Lapham et al., 1980; Coates et al., 2005, Masalehdani et al. 2005, Kuenzer and Stracher 2008) the second group employs methods such as gas sample analysis, electromagnetic profile measurements, geophysical modeling, temperature measurements, micro seismic, and geo-electrics to quantitatively analyze, locate and predict the coal fires and their development (Lohrer et al., 2005; Wessling et al. 2008, Litschke et al., 2005). Kuenzer et al. (2005) focussed on coal fires dynamic behaviour based in in-situ repeated mapping of coal fires in China over a course of five years. Remote sensing based coal fire research has mainly focused on coal fire related thermal anomaly detection, the detection of land cover changes in the mining environments, the detection of land surface subsidence due to the volume loss underground and the development of methods for coal fire risk area delineation. Furthermore, in depth thermal analysis, such as sub-pixel thermal mapping, geologic mapping based on emissivity and coal fire quantification were pursued (Ellyett and Fleming, 1974; Fisher and Kuntz, 1968, Greene et al., 1969, Guan, 1989, Knuth et al., 1968, Mansor et al., 1994; Li, 1985, Moxham and Greene, 1967; Prakash and Gupta, 1998; Prakash and Gupta, 1999; Prakash et al. 1995, Saraf et al. 1995, Zhang X. et al. 2004; Zhang 2004, Tetzlaff 2004, Kuenzer et al. 2005, Kuenzer 2005, Kuenzer et al. 2007a, Kuenzer et al. 2007b, Kuenzer et al. 2007c, Kuenzer et al. 2008, Zhang et al. 2007, Zhang and Kuenzer 2007).
However, few investigators have published figures on the amounts of green house-relevant gas released through coal fires. Rosema et al. (1993) and van Genderen and Guan (1997) assumed that coal fires in China alone contribute 2% to 3% of all annual human-induced CO2 emissions,
whereas Kuenzer et al. (2007) assume that this figure is more on the order of 0.1%. The main goal of this report is to demonstrate the numerous difficulties that have to be overcome on the way to a sound coal fire emission quantification. Firstly a simulation model for combustion is presented, based on recent field- laboratory and modelling work on Kimmeridge oil shales in the UK. Next, we present an inventory for coal fire-related GHG emissions in three provinces of China where this problem is the most urgent. Furthermore we describe a method that is suitable for estimating coal fire-related emissions on local and regional scale based on remote sensing data, and comment on (future) satellite options.
Figure 1 Strong gas emission through sinkhole above a subsurface coal fire (left) and coal fire induced bedrock collapse (right), both in Wuda, Inner Mongolia, China.
1.2 Relation to Kyoto protocol and CDM
It is widely known that fossil fuel deposit fires release CO2 and CH4, as well as harmful and toxic
gasses, such as SO2, NOX, and, in smaller amounts, CO and N2O. Especially, the release of
CO2 and CH4 is worth investigating, because these gasses are known to contribute to global
warming and are the only coal fire-emitted gasses considered as GHGs by the Kyoto Protocol (Goudie and Cuff, 2002; Rosenqvist et al. 2003; Wagner, 2004). The quantitative findings of
fossil fuel deposit fire-related emissions can be a basis for certified emissions trading under the framework of the Kyoto Protocol and similar protocols to follow. According to the Kyoto Protocol, GHGs are CO2, CH4, perfluorocarbons, hydrofluorocarbons, and sulphur hexafluoride. Only the
first two are emitted from fossil fuel deposit fires (Litschke et al., 2005); thus, only those are discussed here.
The aim of the Kyoto Protocol is to improve the overall flexibility and economic efficiency of making emission cuts. It introduced three mechanisms for emissions reduction, which are presented in detail in Rosenqvist et al. (2003). One of those mechanisms is the limited trading system ‘clean development mechanism’ (CDM), a mechanism whereby non-Annex I parties (non-industrialized countries) can create ‘certified emission reductions’ (CERs) through developing projects that reduce the net emissions of GHGs. Annex I parties (governments as well as private entities) can assist in financing these projects and purchase the resulting credits as a means to achieve compliance with their own reduction commitments. Thereby, a CER is a unit of GHG reduction that has been generated and certified under the provisions of the Kyoto Protocol for the CDM. Credits adhering to the guidelines of CDM have been generated and are bankable since 2000. For the CDM, it is especially important to determine the level of emissions that would have occurred without the investment. Only then can proper credit be given for the difference between the (lower) actual emissions and the baseline level that would have occurred otherwise (Rosenqvist et al. 2003, Wagner, 2004, Kuenzer, 2007b).
Large energy companies are investigating the potential to extinguish the large number of coal fires burning in northeastern India, and west and north-central China. However, to date, no coal fire-related emission trading agreement is known to have been signed anywhere in the world. Requirement to obtain CDM certificates is a baseline level definition for coal fire-related GHG emission, which has yet to be established. It needs to be known how much CO2 equivalent a
certain coal fire releases to the atmosphere over a certain amount of time. Based on such a baseline a company can get the proper credits for extinguishing this fire. Such baselines are a pressing need, especially in China. The country is the largest market worldwide concerning emission trade under the CDM, and more than 170 Kyoto-based CDM contracts had been signed in other fields of industry by the end of 2006 (URL1, URL2, Kuenzer 2007b).
1.3 Challenges for coal fire related emission quantification
The three major parameters for coal fire quantification are the amount of coal burning [tons of coal], the amount of energy released [mega-watts], and the amount of GHGs emitted [tons of CO2] (Figure 2).
From a very simplified perspective, one could come to the conclusion that, at first sight, the solution seems easy. Either one measures green house-relevant emissions directly or one retrieves the amount indirectly via the other quantities. If the amount of coal burning in a coal fire is known, it is possible to calculate how much gas is emitted. Another option is if the amount of energy released by a fire is known, one knows the amount of subsurface coal that is burning. However, for these indirect methods of gas emission estimation, two transfer functions (relationships) would have to be established:
• A transfer function between the amount of burning coal and the amount of emitted GHGs.
• A transfer function between coal fire energy release and the amount of burning coal (again the first transfer function is needed; thus, this pathway contains more uncertainty).
Table 1 Difficulties for direct in situ measurements of the three quantitative coal fire parameters: amount of burning coal, amount of energy release, amount of emitted gasses.
Amount of burning coal Direct measurements of burning coal: - Not possible, because the coal burns
underground.
>> Only approximation via a 3D model possible, hence importance of modelling.
Amount of energy release For in situ temperature- and calorimetric measurements in a dense grid it needs it be considered that:
- To define energy release of a coal fire zone on the surface, the underground coal fire outline on the surface needs to be known (available in situ mapping result).
- Energy release undergoes strong fluctuations. - Similar burning volumes of coal might lead to
different energy release depending on overlying bedrock characteristics and crack systems.
- It is not possible to map a whole coal fire area (regional scale) of several km² in this way (too costly and time consuming)
>> Thermal remote sensing as an option
Amount of emitted gasses In situ gas measurements in a dense grid: - Gas emissions undergo strong fluctuations - Gas is emitted through cracks and vents but
also permeates through the overburden (normal rock/soil).
- It is not possible to measure emitted gas in a whole coal fire area (regional scale) of several km² in this way (too costly and time
consuming)
>> Constrain for a small representative coal fire are and extrapolate.
>> CO2 detection by hyperspectral analysis of
remote sensing data is beyond the present spectral and spatial resolution.
Figure 2 Relationship between the three major quantitative coal fire parameters: amount of burning coal, amount of gasses emitted, and amount of energy released (Kuenzer et al. 2007d)
Under laboratory conditions, it is possible to measure gas emission quantitatively from a small volume of burning coal. However, this is not possible under realistic in situ conditions in a coal fire area. The technical difficulties of measuring the three quantities in situ are presented in Table 1 and Figure 3.
Figure 3 Complex system of a shallow subsurface coal fire. Numerous influences in a near chaotic system hamper the quantification of burned coal and related gaseous emissions. (Kuenzer et al. 2007d)
1.3.1 Difficult to approach and measure
Coal fires occur underground. Thus, it is only possible to assess the fire’s characteristics indirectly through surface temperature mapping, gas emission measurements, interpretation of mine works information and geological maps, borehole analyses, analyses of minerals or pyrometamorphic rocks, and further related activities. This approximation of GHG release via one of the three parameters is only possible with detailed geologic data, time consuming and costly field surveys, and very detailed knowledge of the coal fire zone through in situ mapping.
1.3.2 Variability in degree of combustion
The coal in coal fires does not burn completely; incomplete combustion occurs. If coal combusts completely in a coal-fired power plant, 1 ton of high-rank coal (ie, 1 ton of coal with 80% carbon content) will lead to the emission of 2.5 tons of CO2. This number can be derived from the
pure carbon leads to the release of 3.666 grams of CO2. However, in a coal fire, the degree of
combustion, which can be described quantitatively as the relationship of emitted CO to CO2,
depends on numerous factors. These factors undergo daily changes. The degree of combustion depends on the type of coal, volatile matter, coal rank, layering density, and impurities influencing the calorific value of the coal. Heterogeneities in the layering of the coal can decrease the degree of combustion. Weather conditions, such as wind and moisture, also play a role. Overall, the ventilation of coal (oxygen supply) is the most crucial factor influencing the speed of the combustion process (see Figure 3).
Additionally, natural coal fires often occur in complex environments. Frequently, large masses of bedrock and coal waste are moved around. Seams are exposed and covered again. Fire-induced volume loss underground leads to cracks and fractures in the overlying strata and land subsidence. The latter accelerates the underground fires through increased oxygen supply (see Figure 3). Each coal fire burns at different intensity and speed; some reach internal temperatures above 1200°C, whereas others smolder at much lower temperatures. Some fires consume all available energy supply (coal) within a short period of time, whereas other fires burn for decades or even centuries. The fire progression rate has been observed to range between less than 10 and up to 100 meters per year, which is in accordance with modelling results (Wessling et al., 2008). Thus, internal and external factors lead to strong variations in the combustion process.
1.3.3 Surface temperature patterns and coal fire-related energy release
Energy release is difficult to measure in situ, especially for a larger area (see Table 1). However, thermal remote sensing data can be utilized, as for example by Tetzlaff (2004), to derive coal fire-related energy release based on a linear relationship between the spectral radiance observed at the thermal satellite sensor and in situ energy release (see Figure 4). This linear relationship was derived based on mathematical scenarios of varying fire size and temperatures for fires less than 600°K and not exceeding 1000 m² in size. The related algorithm can estimate the energy release of a predefined area within remote sensing data. This means that coal fire outlines must be known to calculate energy release. However, in many regions, detailed coal fire outlines derived from in situ mapping are not available. Furthermore, energy release can vary daily, based on different weather conditions, and, especially, changes in ventilation through new cracks and vents.
Figure 4 Coal fire related energy release. Left: thermal Landsat-7 ETM+ summer nighttime image from 2002. Right: Energy release in MW for the individual coal fires as mapped in situ (red fire outlines overlain on thermal satellite data (left). Polygons, defining an area, need to be available so that the algorithm can calculate a fire’s energy release. The subset is facing up (north) and shows 20 * 20 km. It represents the Wuda coal mining syncline, Inner Mongolia, China. From Tetzlaff (2004).
Additionally, the depth of the fire strongly influences the thermal (energy release) pattern on the surface. For deeper fires, heat transported by conduction, which is a relatively slow heat transfer mechanism, plays a bigger role. Thus, a thermal anomaly might not be visible at the
surface. Convection, which is a fast heat transfer mechanism, plays a bigger role for shallow, subsurface fires. Thus, a deep fire might lead to a weaker signal than a shallow fire, even though the amount of coal burning underneath might be equal. Furthermore, some of the heat released from the fires (shallow or deep) will never reach the surface; it is transferred into the surrounding rock layers (also downward). Thus, remote sensing-derived energy release is likely to underestimate the true energy release.
1.3.4 The challenge of timely predictions
If a private company extinguishes a coal fire, theoretically it would get emission certificates for the amount of CO2 that the fire would have released, for the duration of the CDM contract
agreement, if it had not been extinguished. However, it is a very challenging task to predict how long a coal fire will burn. So it is hard to specify, for example, if the company would get emission reduction certificates for 5 years or only for 2 years. Furthermore, natural spontaneous extinction of coal fires has been reported and is not yet understood. Currently, it is being discussed that contract periods will be as long as preceded monitoring activities to grant an understanding of the fire. For example a monitoring period of 4 years, and quantifications derived thereof, would lead to a 4-year CDM contract. The challenge here is that coal fires undergo nearly unpredictable changes over time.
1.3.5 The challenge of extrapolation to other areas
Even if one can quantify the emissions of one local coal fire area, for example in China, it is difficult to extrapolate these results to a whole country without entering the blurred zone of what can still be considered scientifically reasonable. Coal fires between different countries, for example India and China, vary even more significantly due to their geological setting (coal quality, deposit type and configuration), the local climate and mining methods.
The mining engineers, fire fighters, and coal mining administrators who live and work in these regions daily are the persons who probably can best determine how much coal is burning in a fire. However, one has to be cautious for overestimation of the burning volume where financial support for coal fire extinction is provided by the government.
1.3.6 Difference in estimated CO2 emission from coal fires
According to Rosema et al. (1993), it is estimated that coal fires in China alone account for 2% to 3% of all human-induced CO2 emissions globally. This figure was based on a reported annual
loss of coal in China of between 100 and 200 million tonnes without specification (also no differentiation was made between combusted coal and coal that could not be mined anymore in fire-affected areas). This rough figure was subsequently copied, spread, and repeated by numerous investigators in scientific papers (eg, van Genderen and Guan, 1997; Huang et al., 2001), and it was quoted over and over again in international media. By now it seems to be an accepted fact that this number exists, although the source of the estimation and the theoretical background for the calculation of this number were never laid out in a published paper.
Cassels (1997) already arrived at the conclusion that the coal loss and related CO2 emission
were overestimates. Based on the coal loss of 140 to 1400 tonnes/year for a typical fire in a well-studied location there would have to be 1 million to 100,000 fires to achieve an annual loss of 140 million tonnes in China, which is obviously not the case. He does not give a new estimation, but a more realistic number of 1000 to 10,000 fires would lead to between 0.14 and 14 million tonnes/year loss in China, amounting to max. 0.25% of CO2 emission.
Other investigators estimated that CO2 emissions released by coal fires in China add up to
around 0.1% to 0.2% of all human-induced CO2 emissions (Kuenzer et al., 2007). This number
sounds small; however, taking into consideration that 0.1% is still one thousandth of all human-related CO2 emissions, it is still a significant quantity. Thus, it can be stated that coal fires
contribute to global warming by emitting CO2 and other GHG’s. Which number is scientifically
closer to reality is still open to debate, and this report aims to give a better underpinned estimation.
![Figure 14 Convection model result: Oxygen concentration [%], flow [m 3 /(m/s)]](https://thumb-eu.123doks.com/thumbv2/5doknet/3251303.20537/43.892.151.753.188.726/figure-convection-model-result-oxygen-concentration-flow-m.webp)