to interact with an early birth risk survival model
A clinical decision support system for gynecologists
Academic year 2019-2020
Master of Science in Computer Science Engineering
Master's dissertation submitted in order to obtain the academic degree of
Backere, Dr. ir. Lucas Sterckx
Counsellors: Ir. Gilles Vandewiele, Prof. dr. Femke Ongenae, Dr. ir. Femke De Supervisors: Prof. dr. ir. Sofie Van Hoecke, Prof. dr. ir. Thomas Demeester
Student number: 01503861
Silke De Clercq
Preface
I would like to thank my supervisors and promotors, especially Ir. Gilles Vandewiele and dr. ir. Thomas Demeester for their support and guidance throughout my thesis. I would also like to give a special thanks to Isabelle Dehaene, who was always willing to answer my queries and supported me greatly by sharing her expertise in the field of obstetrics. Finally, I would like to thank the gynecologists who participated in the survey and shared their opinion about the developed clinical decision support system.
The author gives permission to make this master dissertation available for consultation and to copy parts of this master dissertation for personal use. In all cases of other use, the copyright terms have to be respected, in particular with regard to the obligation to state explicitly the source when quoting results from this master dissertation.
Abstract
Problem Preterm birth is the leading cause of death among children under five years old and its’ prevalence ranges from 5% to 18% globally [1]. However, gynecologists experience difficulties in assessing whether a patient with symptoms of preterm labour will actually deliver preterm due to the large number of potential causes.
Objective In this thesis, a proof-of-concept of a clinical decision support system is pro-posed that may assist gynaecologists when estimating the time-to-delivery. It consists of two parts: (a) a web application, developed to easily store and generate time-to-delivery predictions based on the patient’s information (b) a prediction model, based on survival analysis techniques that predicts the risk of having a preterm birth within a predeter-mined term.
Results A survey conducted among 11 gynecologists showed that the majority reported that the web app is user-friendly and they would use it regularly. Three prediction models were optimized and evaluated: (i) a Cox Proportional Hazards model including all admis-sion features, (ii) a minimal Cox Proportional Hazards model including only 31 features and (iii) an Accelerated Failure Time model, with an underlying gradient boosting train-ing technique, includtrain-ing all the admission features. These 3 models resulted in a C-index of respectively 0.7709, 0.7704 and 0.7930.
Conclusion The Accelerated Failure Time model showed the most potential and scored well over a wide range of evaluation metrics. In future research, other models that com-bine survival analysis with machine learning techniques should be investigated and the prediction model should be integrated with the web application to test their usefulness in practice.
Keywords: preterm birth, clinical decision support system, web application development, survival analysis
A clinical decision support system for gynecologists to
interact with an early birth risk survival model
Silke De Clercq
Supervisors: Prof. dr. ir. Sofie Van Hoecke, Prof dr. ir. Thomas Demeester
Abstract— Problem: Preterm birth is the leading cause of death among children under five years old and its’ prevalence ranges from 5% to 18% globally [1]. However, gynecologists experience difficulties in assessing whether a patient with symptoms of preterm labour will actually deliver preterm due to the large number of potential causes.
Objective: In this thesis, a proof-of-concept of a clinical decision support system is proposed that may assist gynaecologists when estimating the time-to-delivery. It consists of two parts: (a) a web application, developed to easily store and generate time-to-delivery predictions based on the patient’s information (b) a prediction model, based on sur-vival analysis techniques that predicts the risk of having a preterm birth within a predetermined term.
Results: A survey conducted among 11 gynecolo-gists showed that the majority reported that the web app is user-friendly and they would use it regularly. Three prediction models were optimized and evaluated: (i) a Cox Proportional Hazards model including all admission features, (ii) a min-imal Cox Proportional Hazards model including only 31 features and (iii) an Accelerated Failure Time model, with an underlying gradient boosting training technique, including all the admission features. These 3 models resulted in a C-index of respectively 0.7709, 0.7704 and 0.7930.
Conclusion: The Accelerated Failure Time model showed the most potential and scored well over a wide range of evaluation metrics. In future research, other models that combine survival analysis with machine learning techniques should be investigated and the prediction model should be integrated with the web application to test their usefulness in practice.
I. INTRODUCTION
According to the WHO, preterm birth is the leading cause of death among children under five years old and its prevalence ranges from 5% to 18% globally [2]. Resulting in approximately 1 million children dying each year due to com-plications of preterm birth. These comcom-plications include impairments to vision, hearing, the lungs, the cardiovascular system and non-communicable diseases [3, 4]. Moreover, preterm births also
form an enormous burden on both the families, the economy and the society [4]. Unfortunately, gynecologists experience difficulties in assessing whether a patient with symptoms of preterm labour will actually deliver preterm, due to the large number of potential causes and a limited understanding of the exact physiology of the uterus and parturition [2, 5]. Nevertheless, an accurate prediction of the risk of preterm delivery remains crucial to not only increase the survival rate, but to allow for correct medication administration and avoid unnecessary hospitalizations as well. Machine learning (ML) offers an objective de-cision support solution as it has the potential to predict with high accuracy and it can easily process the increasing amount of medical data gathered in the electronic health records (EHR). The main goal of this thesis is to develop a clinical decision support system that may as-sist gynaecologists when estimating the time-to-delivery. Section II, describes the general PRE-TURN project of which this thesis is a part, as well as the PRETURN dataset used to train the predictive models. Section III presents the web application, developed for gynecologists to easily generate time-to-delivery predictions based on their patient’s information. The user-friendliness of the tool has been evaluated by gynecologists through an online survey, which is also explained in Section III. In Section IV, the actual prediction model are described, along with their optimization process. Finally, Section V, sums up the main accomplishments of this thesis.
II. PRETURN STUDY
This thesis has been performed in the context of the PRETURN study, i.e. PREdiction Tool for prematUre laboR and Neonatal outcome, which aims to support clinicians in their decision process regarding the preterm birth risk of a patient. In this thesis, the PRETURN dataset is used to evaluate the accuracy of the prediction models. It contains anonymised data collected from patients admitted 1
to the Department of Gynecology and Obstetrics at Ghent University Hospital, between 2012 and 2017. The dataset holds information on 1,555 pregnancy-related admissions, corresponding to 1368 pregnancies of 1325 women, who were in between 24 and 37 weeks of gestation. The data consists mostly of structured variables that are available immediately after admission, such as the age of the mother, medication, admission indication, previous preterm birth history etc.
III. WEB APPLICATION
Mobile health (mHealth) applications are becom-ing more popular every day and can be defined as the use of mobile phones, patient monitoring devices and personal digital assistants, to support the practice of medicine and public health [6]. This thesis focuses on one particular kind of mHealth application, namely the clinical decision support system (CDSS), which is designed to be a direct aid in the clinical decision-making process by providing patient-specific assessments or recommendations to the clinician or patient [7, 8]. Thanks to their promising results, CDSSs are also on the rise in obstetrics and gynecology. A. QUiPP app
To support gynecologists in their decision process, this thesis focus on the development of an easy-to-use web tool that estimates the preterm birth risk based on medical information about the pa-tient. However, such an application already exists. The Quantitative instrument for the prediction of preterm birth (QUiPP) app was created by King’s College London and aims to predict the preterm birth risk for both symptomatic and asymptomatic women, based on variables such as quantitative fetal fibronectin (qfFN) and cervical length [9]. In the QUiPP app, the gynecologist fills out a very small questionnaire about the patient and immediately receives a list of risk probabilities, presented as simple percentages. Unfortunately, the QUiPP app doesn’t provide any reasoning behind these prediction results. Validation of the QUiPP prediction models shows that the AUC scores for the asymptomatic and symptomatic models are ranging respectively from 0.77-0.99 and 0.77-0.88, which is higher than previously reported for prediction models based on cervical length and qfFN [10–12]. Even though the QUiPP app may aid clinicians in the preterm birth pre-diction problem, it lacks transparency and only incorporates a very small parameter set. Therefore,
a new prediction tool is developed in this thesis, called the PRETURN app.
B. PRETURN app
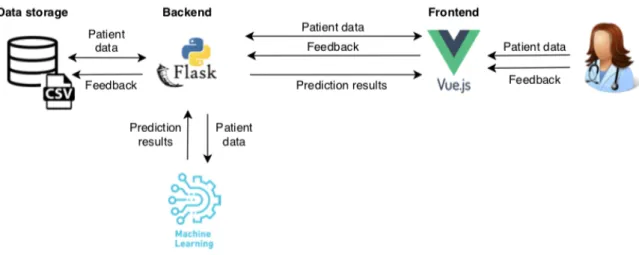
The architectural overview of the PRETURN web application is shown in Figure 2.
1) Frontend: The frontend was set up using the VueJS framework [13] and BootstrapVue [14]. VueJS is a JavaScript framework that allows for swift development due to its gentle learning curve [13]. In addition, BootstrapVue integrates the popular frontend CSS library, Bootstrapv4 [15], into the VueJS framework to ensure fast and responsive webdesign [14].
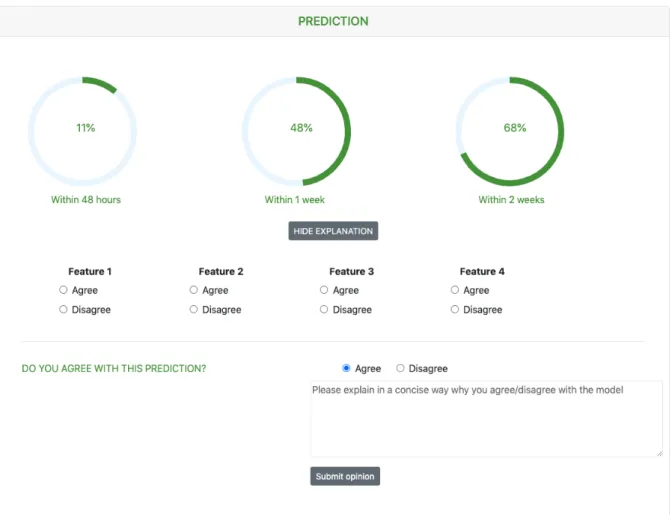
Using the web interface, the clinician may search for a patient’s file, enter the patient’s data through forms, request a risk prediction, and provide feedback on these prediction results. The patient’s file is divided into three parts: admission data, temporal data and prediction results. The admis-sion data contains information that should remain static throughout the admission, e.g. amount of fetuses, whereas temporal variables may change regularly, e.g. blood pressure. To give a good overview of such temporal variables, the PRE-TURN app displays their evolution in time using a chart. The current parameter set, supported in the tool, was determined in consultation with experts. However, if the gynecologist believes that important parameters are missing, they can add extra custom parameters in the tool. Figure ?? shows how prediction results are presented in the web app. The 3 percentages are used to indicate the risk percentages of birth within 2 days, 7 days and 14 days from the request time. The gynecologist may wonder how these percentages were calculated, so the app will also display the top 4 features that were the most important in the prediction calculation. For research purposes, the gynecologist can provide feedback on these prediction results. They can indicate if they agree with the fact that the top 4 features are indeed important risk factors and if they agree with the prediction overall.
2) Backend: To correctly store and retrieve the patient’s data, a Flask [16] web API is deployed. The API has endpoints to perform general Create, Read, Update and Delete (CRUD) operations on the patient files and an endpoint to generate risk predictions. Both the patient data and the clinician’s feedback on the predictions are stored
Fig. 1: Architectural overview of PRETURN app
Fig. 2: Visualization of prediction results in the PRETURN app
in a comma-separated values (CSV) file. The use of an actual database system seems superfluous for now, as data storage is not the main objective of this POC and the system might become integrated with the hospital’s database in the future. Since the development of the ML model is still in progress, the API is presently not integrated with an actual model.
C. Survey
To understand the gynecologists’ needs and wishes regarding the PRETURN tool, a survey is con-ducted among the gynecologists at the Ghent University Hospital, i.e. UZGent. This survey is focused mainly on testing the user-friendliness of the app but questioned the gynecologists about their views on using AI, how they want the prediction results visualised, how they would use the app in the workplace, etc. The survey contained a small tutorial, asking the participants to try out certain operations in a live test version of the app. The questionnaire could be filled in using the Google Forms platform [17] and participation was voluntary. 11 gynecologists participated in the survey. The overall layout of the patient’s page was considered clear and user-friendly by nine respondents. Seven people stated that they would use the app regularly and three sometimes. To increase their trust in the prediction system, multiple respondents felt that the prediction model should have a high positive and negative predictive value, specificity and sensitivity and should be externally validated, preferably by multiple studies based on a large population. Others simply asked for a good textual explanation of the reasoning behind the prediction results. The majority of the respondents would use the app to confirm their own decision, only 5 stated they would use the app to make a decision for them when they have doubts.
IV. PREDICTION MODEL
It is important to select the most suitable type of model that scores high in both accuracy and efficiency as well as interpretability. For the preterm birth problem, the model should not only predict whether a preterm birth will occur but also how soon it will happen. Survival Analysis (SA) is a set of statistical techniques that aim to model how long it takes before an event of interest occurs, i.e. time-to-event analysis [18, 19]. Due to censoring, time to event variables require specific techniques. Censoring occurs frequently
in survival data obtained through clinical trials and indicates that only a subset of the study group will experience the event within the study period. For the other individuals, the actual survival times are not observed, resulting in incomplete or so-called censored data [19]. In the PRETURN dataset, 410 out of 1555 admissions are censored due to, for example, patients being transferred to other hos-pitals. The exclusion of the censored data during model analysis would result in biased estimates, underestimating the true survival time severely [20]. Fortunately, Survival Analysis techniques can handle right-censored data perfectly [21]. A. Cox Proportional Hazards model
One of the most popular models for survival data is the Cox Proportional Hazards (Cox PH) regression model, which is used to relate several predictor variables, i.e. covariates, to the survival time simultaneously [22, 23]. It tries to estimate the hazard function h(t) based on the value on the covariates. The hazard function h(t) reflects the instantaneous potential that an individual experiences the event at time t, given he has already survived until time t [19]. The main idea of the Cox PH model is that the logarithm of the hazard of an individual is a linear function of the individual’s covariates and a baseline hazard function that is shared by all individuals. Thus, the hazard function can be defined as
h(t, Xi) = h0(t)exp(Xi ) (1)
where Xi denotes the corresponding covariate
vector for individual i, T = (
1, 2, ..., p)
represents the coefficient vector and h0(t)is the
baseline hazard function that is the same for all individuals. As it is a semi-parametric model, no knowledge about the probability distribution is required and the baseline function can be an arbitrary, non-negative function of time [24]. For two individuals X1 and X2, the hazard ratio is
defined as follows d
HR = h(t, X1) h(t, X2)
= exp[(X1 X2) ]
This equation illustrates the main assumption made by the Cox PH model. This assumption is called theProportional Hazards assumption and states that the hazard ratio of two instances should be constant over time [25]. If any test suggests that the proportional hazards assumption is violated,
the Cox PH model can be adjusted to take the non-proportionality into account [23]. Once the hazard function is estimated, the survival probability S(t) can be calculated, which is the probability that the event has not occurred yet at time t.
S(t) = S0(t)exp(X )
where S0(t) = exp( H0(t))is known as the
base-line survival function with H0(t)the cumulative
distribution function of h0(t)[24].
B. Accelerated Failure Time model
The accelerated failure time model (AFT) is a parametric approach that aims to estimate the survivor function directly as follows [25]:
S(t) = S0( t)
where S0(t)represents the baseline survivor
func-tion and is an acceleration factor, that depends on the covariates X and is defined as
= exp(b1x1+ b2x2+ ... + bpxp)
From this equation, it is clear that the covariates can cause nothing more than an acceleration or deceleration of the baseline survivor function by some constant. If > t, the length of the survival time is increased, whereas a < t decreases the survival time. The AFT model is often rewritten as a log-linear relationship with respect to time
log(T ) =< b, X > +✏
where < b, X > is the dot product of the coefficient vector b and the covariate vector X and ✏denotes the variability in the survival times [25]. As it is a parametric approach, the distribution of the survival times (✏) should be picked. The most commonly used forms are the Weibull, Log-Normal, Log-logistic or Generalised Gamma distributions [25].
In this thesis, XGBoost’s implementation of the AFT model is used. XGBoost is a very popular open-source library due to its high-performance implementation of gradient boosted decision trees [26]. To make this model work for gradient boosting, the dot product < b, X >is replaced by the output of the decision tree ensemble, i.e. T (x).
C. Metrics
To evaluate the prediction models, two evaluation metrics that take censoring into account, are used: Brier score and Concordance index.
1) Brier score: The Brier score measures the mean-squared difference between predictions and actual outcomes [27] and is defined as follows:
BS(t) = 1 N N X i=1 wi(t)[ˆyi(t) yi(t)]2
The sum is made over a sample of N individuals and for the ith individual, ˆy
i(t) denotes the
predicted outcome, while yi(t) represents the
actual outcome. The weight for the ith individual,
denoted by wi(t), is used to account for the
cen-soring information. More specifically, the weights are 0 for instances that were censored before t and greater than 1 for uncensored instances [27]. Since the Brier score measures the discrepancy between predictions and reality, a lower Brier score means a better goodness of fit.
2) Concordance index: The concordance index (C-index) evaluates the relative rankings of event times and is defined as the ratio of concordant pairs to total comparable pairs [27, 28]. A pair of instances is comparable if both of them are uncensored or if the observed time event time for the uncensored instance is smaller than the censoring time of the censored one [29]. Consider a comparable pair of instances (y1, ˆy1)and (y2, ˆy2)
where yi is the actual observed time and ˆyi
the predicted value. This pair is concordant if y1 > y2 and ˆy1 > ˆy2. As the concordance
probability c = P r(ˆy1 < ˆy2|y1 < y2) measures
the concordance between the rankings of actual values and predicted values, a higher C-index means a higher prediction accuracy [27].
D. Methods
In the PRETURN project, a Cox PH model for admission information has already been developed using the Lifelines library [30], a Survival Analy-sis library, written in Python, that contains a wide variety of SA techniques. However, this model still needs some optimization to increase both its accuracy and efficiency.
1) Data processing: From the structured variables, present in the PRETURN dataset, some extra fea-tures were extracted such as BMI, gestational age and preterm birth history. All categorical variables were one-hot-encoded and only the categories that appeared at least 10 times throughout the dataset, were kept as a feature. Finally, a total of 147 structured features are available for each patient. 5
2) Evaluation: To assess the predictive perfor-mance of the initial and suggested models, both the Concordance index and Brier score will be measured using 5-fold cross-validation on the training data. The concordance index will evaluate the rankings of survival times while the Brier score can give more insight into the accuracy of the predictions at specific times, i.e. within 1 day, 2 days or 7 days from admission. These time windows were decided in consultation with experts, as they are the bounds between which the effect of corticosteroids is considered to be optimal [31, 32].
E. Results
The initial Cox PH model with 147 features has a mean C-index of 0.7651 and a mean Brier score, for the prediction within 1 day, 2 days and 7 days, equal to 0.1155, 0.1392 and 0.1655 respectively on the training data. When checking the Proportional Hazards assumption, the variables gestational age and amount of days between current admission and previous pregnancy seem to violate the assumption because their relationship with the log hazard is nonlinear. Therefore, the quadratic and cubic terms of these variables are added to the feature set. The resulting Cox PH model, now with a total amount of 153 features, proved to have higher prediction power. After tuning the model’s hyperparameters, the model had a C-index of 0.7668 and Brier scores of 0.1133 (24h), 0.1378 (48h), 0.1654 (7d). To improve both the accuracy and efficiency of the model, it is crucial to assess which covariates are the most significant for accurate preterm birth risk prediction. This will also increase the user-friendliness as it would require the clinician to enter less information about the patient. Hence, the importance of the covariates are investigated by performinggreedy forward selection. The 25 most important features for the maximization of the C-index and the 10 most important for the minimization of the Brier scores, were merged and created a minimal model with only 31 features. For the optimization of the AFT model, all of the 153 features of the full Cox model were included and the hyperparameters of both the underlying gradient boosting algorithm and the AFT model were optimized.
Finally, the full Cox model, the minimal Cox model and the optimized AFT model are evaluated on the test set, as shown in Table I.
TABLE I: Evaluation of the full Cox model (153 features), minimal Cox model (31 features) and the AFT model on the test set
C-index Brier Full Cox 0.7709 within 1 day 0.1133 within 2 days 0.1373 within 7 days 0.1654 Minimal Cox 0.7704 within 1 day 0.1128 within 2 days 0.1334 within 7 days 0.1631 AFT 0.7930 within 1 day 0.1266 within 2 days 0.1541 within 7 days 0.2125 F. Discussion
All three models score rather good overall. How-ever, the prediction of the preterm birth risk is clearly more accurate on the short term than on the longer term. The minimal model may have a lower concordance index than the full Cox model but its Brier scores are also lower, indicating a better prediction accuracy. So the minimal Cox model should not be considered inferior to the full model. It is, however, important to state that the features in the minimal model are mostly well known important factors for preterm birth prediction, so new hidden relationships between the covariates will not be discovered by such a model. The AFT model has the highest C-index but its Brier scores are worse. Nevertheless, the AFT model still shows potential, which indicates that the combination of Survival Analysis and Machine Learning techniques may be a good solution to the preterm birth prediction problem. Thus, in the future, some other ML techniques, such as support vector machines and Artificial Neural Networks, could be investigated as well.
V. CONCLUSION
In this thesis, a clinical decision support system to help gynecologists predict the patient’s risk of having a preterm birth has been developed. Both parts, the PRETURN web app and the prediction model, have been evaluated and found useful. However, some further research is suggested, such investigating other Machine Learning techniques, before finally integrating both parts and assessing their usefulness in practice.
ACKNOWLEDGEMENTS
Special thanks go out to supervisors Prof. dr. ir. Sofie Van Hoecke, Prof dr. ir. Thomas Demeester and counsellors Ir. Gilles Vandewiele, Prof. dr. Femke Ongenae, Dr. ir. Lucas Sterckx for the guidance and help that they provided during this thesis. The author would also like to thank Isabelle Dehaene for sharing her expertise in the field of obstetrics and the gynecologists participating in the survey.
REFERENCES
[1] WHO, “The global action report on preterm birth,” 2012.
[2] L. Liu et al., “Global, regional, and national causes of under-5 mortality in 2000ˆa15: an updated systematic analysis with implications for the sustainable develop-ment goals,” The Lancet, vol. 388, 11 2016.
[3] N. Wood et al., “Neurologic and developmental disabil-ity after extremely preterm birth,” The New England journal of medicine, vol. 343, pp. 378–84, 09 2000. [4] A. Greenough, “Long term respiratory outcomes of
very premature birth (¡ 32 weeks),” Seminars in fetal neonatal medicine, vol. 17, pp. 73–6, 04 2012. [5] G. Fele-Zorz et al., “A comparison of various linear
and non-linear signal processing techniques to separate uterine emg records of term and pre-term delivery groups,” Medical biological engineering computing, vol. 46, pp. 911–22, 04 2008.
[6] S. Ryu, “Book review: mhealth: New horizons for health through mobile technologies: Based on the findings of the second global survey on ehealth (global observatory for ehealth series, volume 3),” Healthcare Informatics Research, vol. 18, p. 231, 09 2012.
[7] K. Kawamoto et al., “Improving clinical practice using clinical decision support systems: A systematic review of trials to identify features critical to success,” BMJ (Clinical research ed.), vol. 330, p. 765, 04 2005. [8] R. T. Sutton et al., “An overview of clinical decision
support systems: benefits, risks, and strategies for success,” NPJ digital medicine, vol. 3, pp. 17–17, Feb 2020, 32047862[pmid].
[9] H. Watson et al., “The quipp app: a safe alternative to a treat-all strategy for threatened preterm labour: Quipp app triage,” Ultrasound in Obstetrics Gynecology, vol. 50, 04 2017.
[10] J. Carter et al., “Development and validation of predic-tion models for the quipp app v.2: a tool for predicting preterm birth in women with symptoms of threatened preterm labor,” Ultrasound in Obstetrics Gynecology, vol. 55, 08 2019.
[11] Quipp app website. [Online]. Available: https://quipp. org
[12] H. Honest et al., “Accuracy of cervico-vaginal fetal fibronectin test in predicting the risk of spontaneous preterm birthˆaa systematic review,” Journal of Obstet-rics and Gynaecology, vol. 23, pp. S57–S57, 01 2003. [13] E. You. Vue.js. [Online]. Available: https://vuejs.org/ [14] BootstrapVue - Official site. [Online]. Available:
https://bootstrap-vue.org
[15] M. Otto and J. Thornton. Bootstrapv4 - Official site. [Online]. Available: https://getbootstrap.com
[16] Armin Ronacher. Welcome — Flask (A Python Microframework). [Online]. Available: http://flask. pocoo.org/
[17] Google Forms. [Online]. Available: https://www.google. com/intl/en-GB/forms/about/
[18] J. P. Klein and M.-J. Zhang, Survival Analysis, Software. American Cancer Society, 2005.
[19] T. Clark et al., “Survival analysis part i: Basic concepts and first analyses,” British journal of cancer, vol. 89, pp. 232–8, 08 2003.
[20] A. Pandey, “Survival analysis: Intuition implementation in python,” 01 2019.
[21] L. Oldja, “Survival analysis to explore customer churn in python,” 04 2018.
[22] D. R. Cox, “Regression models and life-tables,” Journal of the Royal Statistical Society. Series B (Methodological), vol. 34, no. 2, pp. 187–220, 1972. [23] L. Sullivan, “Survival analysis.”
[24] C. K. Reddy and Y. Li, “A review of clinical prediction models,” in Healthcare Data Analytics, 2015. [25] M. Bradburn et al., “Survival analysis part ii:
Multi-variate data analysis- an introduction to concepts and methods,” British journal of cancer, vol. 89, pp. 431–6, 09 2003.
[26] G. Seif, “A beginnerˆas guide to xgboost,” 05 2019. [27] P. Wang, Y. li, and C. Reddy, “Machine learning for
survival analysis: A survey,” ACM Computing Surveys, vol. 51, 08 2017.
[28] L. Sullivan, “Survival analysis.”
[29] H. Steck et al., “On ranking in survival analysis: Bounds on the concordance index,” in Advances in Neural Information Processing Systems 20, J. C. Platt et al., Eds. Curran Associates, Inc., 2008, pp. 1209–1216.
[30] C. Davidson-Pilon et al., “Camdavidsonpilon/lifelines: v0.25.2,” Aug 2020.
[31] N. Melamed et al., “Association between antenatal corti-costeroid administration-to-birth interval and outcomes of preterm neonates,” Obstetrics Gynecology, vol. 125, p. 1, 05 2015.
[32] F. Wilms et al., “Relationship between the time inter-val from antenatal corticosteroid administration until preterm birth and the occurrence of respiratory mor-bidity,” American journal of obstetrics and gynecology, vol. 205, pp. 49.e1–7, 03 2011.
Contents
1 Introduction 1 2 Preturn Study 4 2.1 PRETURN . . . 4 2.2 Dataset . . . 6 3 Web application 9 3.1 Related work . . . 9 3.2 Requirements . . . 16 3.2.1 Functional requirements . . . 16 3.2.2 Non-functional requirements . . . 17 3.3 Architecture . . . 17 3.4 Implementation . . . 18 3.4.1 Backend . . . 19 3.4.2 Frontend . . . 22 3.5 Survey . . . 31 3.5.1 Methods . . . 31 3.5.2 Results . . . 31 3.6 Future work . . . 34 4 Prediction model 35 4.1 Survival Analysis . . . 35 4.1.1 Censoring . . . 36 4.1.2 Basic concepts . . . 384.1.4 Cox proportional hazards model . . . 42
4.1.5 Accelerated failure time model . . . 45
4.1.6 Metrics . . . 46
4.2 Methods . . . 49
4.2.1 Data processing . . . 49
4.2.2 Optimization of Cox PH model . . . 50
4.2.3 Accelerated Failure Time model . . . 53
4.3 Results . . . 55
4.3.1 Checking the Proportional Hazards assumption . . . 55
4.3.2 Hyperparameter tuning . . . 56
4.3.3 Feature selection . . . 57
4.3.4 Accelerated Failure Time model . . . 64
4.3.5 Evaluation on test set . . . 65
4.4 Discussion . . . 65 5 Cost-sensitive analysis 69 6 Conclusion 71 Bibliography 72 Appendices 84 A Survey questions 85 A.1 Admissie paneel . . . 85
A.2 Temporeel paneel . . . 86
A.3 Predictie . . . 87
A.4 Pati¨ent overzicht . . . 88
A.5 Search . . . 89
A.6 PRETURN App . . . 89
List of Tables
2.1 Continuous and categorical structured variables in the PRETURN dataset 8
3.1 Overview of CDSSs in various medical domains . . . 11
3.2 Overview of pregnancy-related CDSSs that incorporate a prediction model into a mHealth application . . . 12
3.3 Admission parameters . . . 20
3.4 Temporal parameters . . . 21
4.1 Confusion matrix for binary classification problem . . . 48
4.2 Hyperparameters of Cox PH model in Lifelines . . . 51
4.3 Supported distribution for XGBoost’s implementation of the AFT model . 54 4.4 Hyperparameters of AFT model in XGBoost . . . 54
4.5 Evaluation metrics of Cox model with and without the cubic and quadratic terms for gest age and days other birth before gest . . . 56
4.6 Tested values of hyperparameters of Cox PH model . . . 56
4.7 25 selected features based on greedy forward selection on C-index . . . 58
4.8 Evaluation metrics of full Cox model with all features versus minimal Cox model with 25 most important features . . . 59
4.9 10 most important features for minimization of Brier scores for prediction within 1 day and 2 days . . . 62
4.10 Evaluation metrics of full Cox model with all features versus minimal Cox model with 31 most important features . . . 62
4.11 31 covariates and their coefficients of the final minimal Cox model . . . 63
4.12 Hyperparameters of AFT model in XGBoost . . . 64
4.13 Evaluation of the full Cox model (153 features), minimal Cox model (31 features) and the AFT model on the test set . . . 66
List of Figures
2.1 PRETURN decision support system [3] . . . 5
3.1 Screenshots of mhealth applications in Table 3.2 . . . 13
3.2 QUiPP app questionnaire for asymptomatic and symptomatic women [72] 15 3.3 Visualization of prediction results in QUiPP app [72] . . . 15
3.4 Architectural overview of PRETURN app . . . 17
3.5 Home page with search function . . . 23
3.6 Patient overview . . . 23 3.7 Admission panel . . . 24 3.8 Discharge modal . . . 25 3.9 Admission form . . . 26 3.10 Temporal panel . . . 27 3.11 Temporal form . . . 28 3.12 Temporal charts . . . 29 3.13 Prediction panel . . . 30
4.1 Illustration of censored data [87] . . . 36
4.2 Relationship among S(t), F(t), and f(t) [83] . . . 38
4.3 Taxonomy of Survival Analysis methods [87] . . . 40
4.4 Coefficients of 158 covariates of optimized Cox model . . . 57
4.5 Mean concordance index when performing greedy forward selection . . . . 60
4.6 Mean brier scores when adding 25 features incrementally from greedy for-ward selection based on C-index . . . 61
Glossary
AFT Accelerated Failure Time. 41, 45, 46, 53, 54, 62, 64, 65, 67, 70, 71 AI Artificial Intelligence. 31
AUC Area under the curve. 14, 47, 49 C-index Concordance index . 46–48, 52 CDF cumulative distribution function. 38, 39
CDSS clinical decision support system. 9, 10, 32, 33, 37, 71 CRUD Create - Remove - Update -Delete. 18
CSV comma-separated values. 18, 19
EHG Electrohysterography: measurement of the electrical activity of the uterus. 5 EHR Electronic health record. 2, 4, 33, 69
HR Hazard ratio. 43
JSON JavaScript Object Notation. 19
LASSO Least Absolute Shrinkage and Selection Operator. 51 mHealth Mobile Health. 9, 10
ML Machine Learning. 2, 18, 53, 68 NPV negative predictive value. 33, 49, 52 PARA PAediatric Risk Assessment. 12
PH Proportional Hazard. iv, 42–47, 49–52, 54–57, 65, 70, 71 PIERS Pre-eclampsia Integrated Estimate of RiSk. 10 POC Proof of concept. 6, 9, 17, 18, 71
PotM PIERS on the Move. 10
PPROM Preterm Premature Rupture of Membranes. 2, 14 PPV positive predictive value. 33, 48, 52
PRETURN PREdiction and decision-support Tool for prematUre Labour and Neonatal outcome. v, 3–9, 17, 18, 22, 32–35, 37, 40, 49, 50, 55, 70
PTB Preterm birth, also known as premature birth or delivery. 1, 2 PTL Preterm Labour. 2
qfFN quantitative fetal fibronectin. 14
QUiPP Quantitative instrument for the prediction of preterm birth. 14, 16 ROC Receiver operating characteristic. 49
SA Survival Analysis. 35, 37, 39, 41, 42, 46, 49 SpO2 Oxygen saturation. 10
sPTB spontaneous preterm birth. 14 WHO World Health Organisation. 1
Chapter 1
Introduction
Preterm birth (PTB) is defined by the World Health Organisation (WHO) as the delivery of babies who are born alive before 37 weeks of gestation, as opposed to the expected gestation of 40 weeks. Every year, almost 15 million babies are born prematurely, which accounts for more than 1 in 10 babies [1, 2]. In Flanders, the average prevalence rate amounts to 7%. However, in tertiary care centers, this number may be considerably higher, as, for example, 18% of the deliveries in Ghent University Hospital are preterm [3].
According to the WHO, preterm birth is the leading cause of death among children un-der five years old and its’ prevalence ranges from 5% to 18% globally [4]. Resulting in approximately 1 million children dying each year due to complications of preterm birth. Even though the treatment of preterm infants continuously improves, many PTB sur-vivors still face a lifetime of disability. In 2012, the WHO reported that almost 75% of morbidities are caused by complications induced by PTB [1]. These complications include impairments to vision, hearing, the lungs, the cardiovascular system and non-communicable diseases. Furthermore, PTB can lead to long-term conditions such as learning and cognitive impairments, increased risk of cerebral palsy and chronic disease in adulthood [5, 6].
Aside from the health impairments, preterm births form an enormous burden on both the families, the economy and the society [6]. For instance, the societal and economic cost of preterm births in the USA in 2005 were estimated around $51,600 per infant,
amounting to $26.2 billion yearly [7, 8]. More recently, in 2017, the total PTB healthcare expenditures in the Netherlands amounted to 159,8 million euro [9].
Better understanding of the causes and mechanisms behind PTB, may improve health outcomes and reduce healthcare service costs. Preterm birth can occur for three di↵erent reasons: They are either medically induced, caused by a membranes rupture prior to labour (PPROM) or provoked by spontaneous contractions, also known as preterm labour (PTL) [10]. Apart from these general causes of preterm birth, there is also a multitude of underlying mechanisms that might initiate preterm labour, including infection, over-distension, congenital defects of the uterus and cervical weakness. Other risk factors regarding the health and lifestyle of the mother, also have to be taken into account such as previous PTB history, stress, alcohol and drug use, diabetes, haemorrhage, illnesses, etc. [10, 11].
Due to this large amount of potential causes and the lack of knowledge regarding the exact physiology of the uterus and parturition, gynecologists experience difficulties in assessing whether a patient with symptoms of preterm labour (PTL) will actually deliver preterm [12, 4]. Nevertheless, an accurate prediction of the risk of preterm delivery remains crucial to not only increase the survival rate, but to allow for correct medication administration and avoid unnecessary hospitalizations.
At present, most methods of preterm birth prediction by clinicians are subjective. How-ever, machine learning ML might o↵er a more objective decision support solution as it has the potential to predict with high accuracy and confidence. Machine learning is partic-ularly interesting since it can process the increasing amount of medical data gathered in the electronic health records (EHR). Since ML is often seen as a black-box technique, it is crucial to clarify the causal inference behind the prediction to enhance the transparency and trustworthiness of the ML algorithm in such a high-stakes environment. Predictive machine learning models have already been applied in various medical use cases and often yield promising results [3, 13]. Naturally, several e↵orts have been made to assess the potential of such predictive models for PTB risk [14, 15, 16, 17]. The results illustrate that ML might be a viable way to diagnose true labour and detect the onset of preterm delivery [18, 8].
The main goal of this thesis is to develop a clinical decision support system that may assist gynaecologists when estimating the time-to-delivery. In Chapter 2, general information is
supplied about the overall PRETURN project of which this thesis is a part, as well as an exploratory analysis is made of the PRETURN dataset at disposal. Chapter 3 presents the web application, developed to easily generate time-to-delivery predictions based on the patient’s information. In order to assess the user-friendliness of this app, a survey was conducted among gynecologists, which is discussed in Chapter 3 as well. Since the machine learning model lies at the heart of the support system, Chapter 4 describes the actual prediction model, along with its’ optimisation process. Furthermore, Chapter 5 describes a future cost-sensitive analysis to increase efficiency even more. Finally, Chapter6, sums up the main accomplishments from this thesis.
Chapter 2
Preturn Study
This thesis has been performed in the context of the PRETURN study, i.e. PREdiction Tool for prematUre laboR and Neonatal outcome, clinical trial (EC/2018/0609) of Ghent University Hospital. The PRETURN study has the main goal to support clinicians in their decision process regarding the preterm birth risk of a patient. Section 2.1 reviews the main objective and previous research of the PRETURN project. In Section 2.2, the PRETURN dataset is presented.
2.1
PRETURN
Even though preterm birth leads to severe medical conditions and high societal and eco-nomical costs, preterm birth prediction is vital, but remains a major paediatric challenge, as mentioned in Chapter 1. Therefore, the PRETURN study has the primary objective to develop a clinical decision support system to promote a correctly timed and adequate, personalised approach to impending preterm birth, as shown in Figure 2.1 [3].
To support the experts in their decision-making at admission time, the system needs the admission information of the patient, available in the EHR. Along with the EHR data, the opinion of the expert on a previous prediction may serve as input of the predictor. Based on these data, a prediction model combining state-of-the-art machine learning techniques, expert knowledge and known causal inference, generates a prediction of the risk of delivery taking place within certain time windows. Finally, the prediction results
are visualised and, preferably, provided with a transparent and interpretable reasoning behind the prediction.
One important remark to make, is the choice of time windows. In the PRETURN study, the models are often chosen to report whether delivery is likely to occur within 24 hours, 48 hours or 7 days after hospitalization. These time windows were decided in consultation with experts, as they are the bounds between which the e↵ect of corticosteroids is con-sidered to be optimal [19, 20]. Corticosteroids have been proven to be an e↵ective means to reduce neonatal mortality and morbidity in preterm infants. However, the efficacy of this antenatal treatment depends on its’ timely administration and is thought to be optimal between 2 and 7 days after administering [16, 19, 21, 22].
Figure 2.1: PRETURN decision support system [3]
Within the PRETURN project, various research has been conducted. One of the most im-portant challenges in preterm labour prediction is the ability to deal with the large amount of unstructured data, available in the electronic health records. Therefore, Natural Lan-guage Processing techniques are investigated that allow to process doctors’ free-text notes and obtain medical insights [22]. Moreover, the added value of features extracted from raw electrohysterography signals have been reviewed, as well as the danger of over-sampling strategies before data partitioning, using the publicly available Term-Preterm EHG
Data-base (TPEHGDB) [18]. Furthermore, the incorporation of biased expert opinions in the prediction model has been examined and found to result in a considerable increase in predictive performance [3].
Examining the degree of transparency, expected by the clinician, behind the model’s reas-oning and investigating the implementation of a model in daily clinical use, are another ambition of the PRETURN study. This thesis contributes to this objective, as a survey is conducted among gynecologists, addressing these exact questions. So far, the prediction models in the PRETURN study mostly focused on predicting a dichotomized target. How-ever, applying Survival Analysis to directly predict the time-to-birth may o↵er a better solution. Hence, in this thesis, the main focus not only lies on a proof of concept (POC) of a decision-support application, as shown in Figure 2.1 but also on the investigation of several Survival Analysis techniques.
2.2
Dataset
The performance of the prediction models will be evaluated using the PRETURN dataset, which contains data collected from patients admitted to the Department of Gynecology and Obstetrics at Ghent University Hospital, between 2012 and 2017.
The original PRETURN dataset contains data from 5,215 women, corresponding to 6,185 pregnancies and 7,339 admissions. As an accurate prediction of the preterm birth risk is the main goal of this thesis, only admissions occurring between 24 and 37 weeks of gestation were included. The other admissions were excluded since the patient was not at high risk of preterm birth and thus did not require potential preventive measures. More specifically, neonatal intensive care is not started before 24 weeks of gestation in Ghent University Hospital and patients arriving at the hospital after 37 weeks of gestation are no longer at risk for preterm birth by definition. Apart from gestational age, some admissions have been filtered due to other variables’ values, such as variables that exceed the physically possible range. After filtering, 1,555 pregnancy-related admissions are kept, corresponding to 1368 pregnancies of 1325 women in between 24 and 37 weeks of gestation. To guarantee privacy, the data has been anonymised and each patient received a patient identifier. Since a patient can have multiple pregnancies, and multiple hospital admis-sions per pregnancy, records are identified and linked based on patient, pregnancy, and
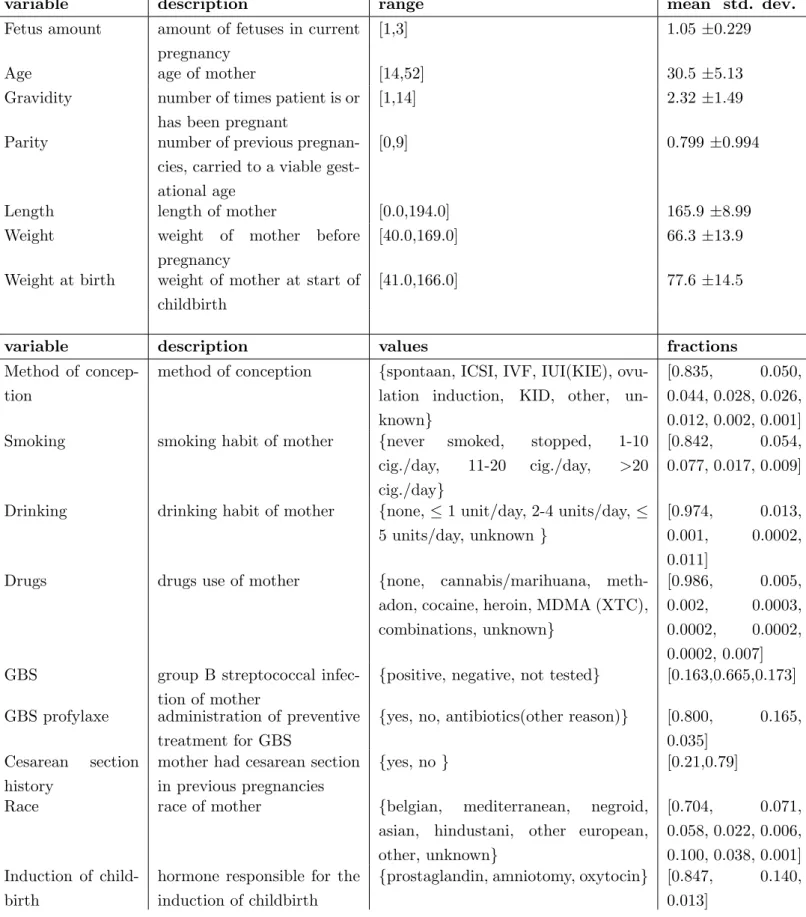
admission identifiers. Table 2.1 describes the set of structured clinical variables, which are available shortly after the patient’s admission to the hospital. In addition to these features, the PRETURN dataset includes some important date variables: the start & end date of the admission, the expected due date, the actual birth date and the date on which the membranes were ruptured.
Some less-structured variables were excluded from Table 2.1 for brevity, as they are either free-text input fields or they can contain a very wide variety of values. The variables excluded from Table 2.1 are: medical problems, illnesses, obstetric anamnesis, medication before/during the pregnancy and the admission indications. These variables often contain valuable information and cannot be excluded from the prediction model’s input. There-fore, they have to be rearranged in a more structured manner through either one-hot encoding or feature extraction, as will be explained in more detail in Chapter 4.
Finally, the PRETURN dataset also includes information on the preterm birth history of the subjects. For every patient in the dataset, the following extra variables regarding their previous preterm births are known: the birth date, the gestational age at birth and whether or not the child survived.
variable description range mean std. dev. Fetus amount amount of fetuses in current
pregnancy
[1,3] 1.05 ±0.229
Age age of mother [14,52] 30.5 ±5.13 Gravidity number of times patient is or
has been pregnant
[1,14] 2.32 ±1.49
Parity number of previous pregnan-cies, carried to a viable gest-ational age
[0,9] 0.799 ±0.994
Length length of mother [0.0,194.0] 165.9 ±8.99 Weight weight of mother before
pregnancy
[40.0,169.0] 66.3 ±13.9 Weight at birth weight of mother at start of
childbirth
[41.0,166.0] 77.6 ±14.5
variable description values fractions Method of
concep-tion
method of conception {spontaan, ICSI, IVF, IUI(KIE), ovu-lation induction, KID, other, un-known}
[0.835, 0.050, 0.044, 0.028, 0.026, 0.012, 0.002, 0.001] Smoking smoking habit of mother {never smoked, stopped, 1-10
cig./day, 11-20 cig./day, >20 cig./day}
[0.842, 0.054, 0.077, 0.017, 0.009]
Drinking drinking habit of mother {none, 1 unit/day, 2-4 units/day, 5 units/day, unknown }
[0.974, 0.013, 0.001, 0.0002, 0.011]
Drugs drugs use of mother {none, cannabis/marihuana, meth-adon, cocaine, heroin, MDMA (XTC), combinations, unknown}
[0.986, 0.005, 0.002, 0.0003, 0.0002, 0.0002, 0.0002, 0.007] GBS group B streptococcal
infec-tion of mother
{positive, negative, not tested} [0.163,0.665,0.173] GBS profylaxe administration of preventive
treatment for GBS
{yes, no, antibiotics(other reason)} [0.800, 0.165, 0.035]
Cesarean section history
mother had cesarean section in previous pregnancies
{yes, no } [0.21,0.79] Race race of mother {belgian, mediterranean, negroid,
asian, hindustani, other european, other, unknown} [0.704, 0.071, 0.058, 0.022, 0.006, 0.100, 0.038, 0.001] Induction of child-birth
hormone responsible for the induction of childbirth
{prostaglandin, amniotomy, oxytocin} [0.847, 0.140, 0.013]
Chapter 3
Web application
The first step in creating a clinical decision support system (CDSS) for gynecologists is developing an easy-to-use tool that estimates the preterm birth risk based on medical information about the patient. This allows gynecologists to swiftly consult the tool if they want a second opinion. The tool’s predictions could also be used to reassure an anxious patient and convince her that her chances of giving birth too early are very low. Firstly, the use of mobile Health applications and clinical decision support systems is explored in Section 3.1. Next, the requirements for a preterm birth prediction CDSS are enumerated. Section 3.3 presents the architecture of the PRETURN app, i.e. the proof of concept (POC) developed in this thesis. After that, Section 3.4 shows the actual implementation of the PRETURN app and how it aims to meet the aforementioned requirements. Finally, the process of surveying gynecologists to assess the user-friendliness of the POC, is explained along with the survey results and suggestions for future work.
3.1
Related work
As mobile devices have become almost ubiquitous, they allow a newer concept of clinical services, known as Mobile Health (mHealth) [23]. mHealth can be defined as the use of mobile phones, patient monitoring devices and personal digital assistants, to support the practice of medicine and public health [24]. The mHealth applications are able to address a multitude of gaps in healthcare such as educating patients [25, 26], collecting clinical health data [27, 28], managing chronic conditions and stress [29, 30], monitoring
the patient’s health and behaviour [31, 32, 33], improving compliance with medication [23, 34], etc.
Clinical decision support systems
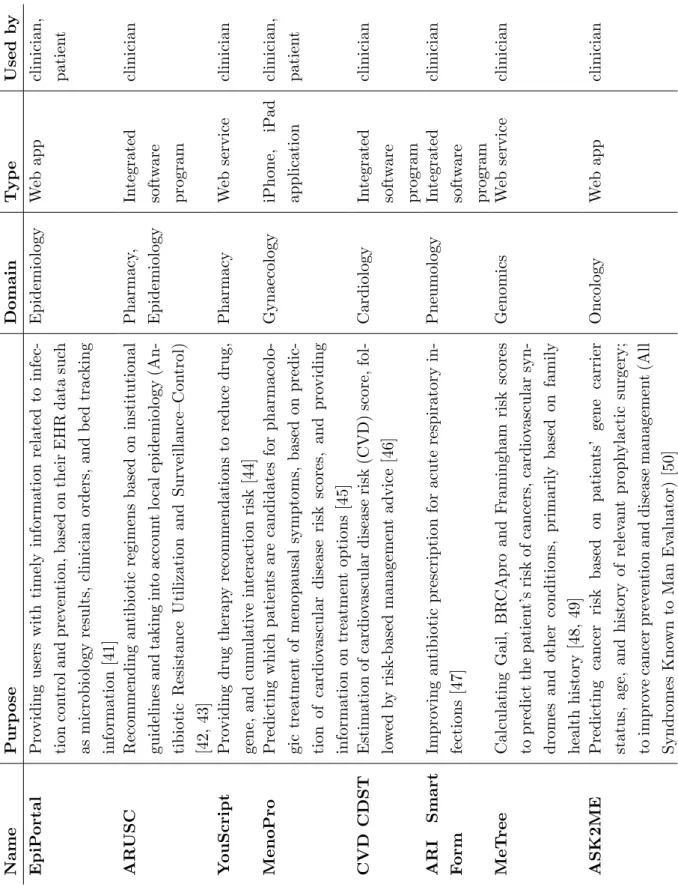
This thesis focuses on one particular kind of mHealth application, namely the clinical decision support system (CDSS). A CDSS is designed to be a direct aid in the clinical decision-making process by providing patient-specific assessments or recommendations to the clinician or patient [35, 36]. Such decision support systems provide several useful func-tions including acquiring and summarizing data, facilitating communication and inform-ation exchange, generating alerts or reminders and supporting educinform-ational and research initiatives [37]. Furthermore, research has shown that CDSSs are an e↵ective means to improve prescribing practices, enhance the delivery of preventive care services and reduce serious medication errors [38, 39, 35, 40]. Thanks to their promising results, CDSSs are deployed in all kinds of medical domains. To demonstrate their versatility, an overview of some clinical decision support applications and their application domains is shown in Table 3.1.
mHealth in obstetrics and gynecology
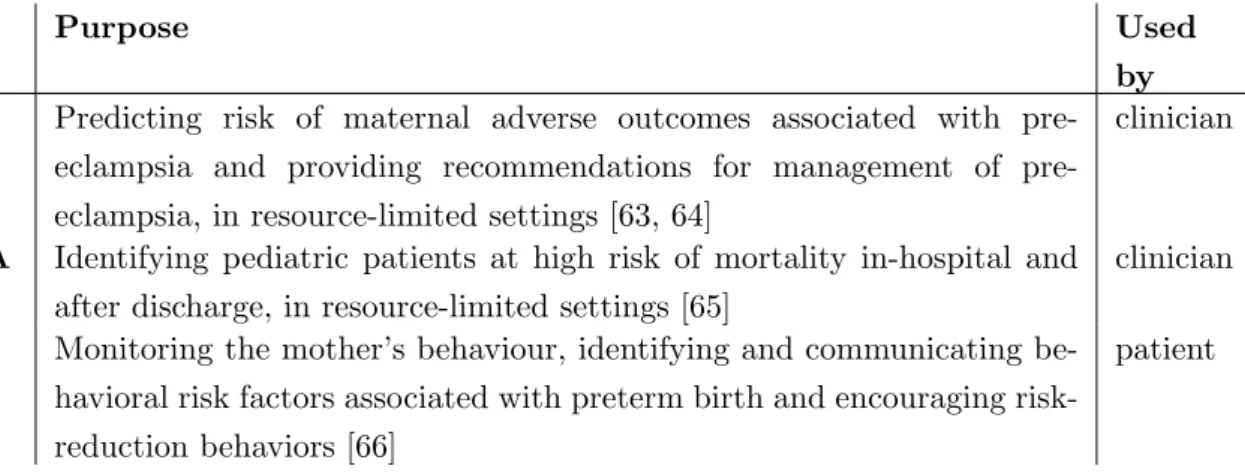
mHealth applications are also on the rise in obstetrics and gynecology. For example, several apps have been developed to educate expectant parents [51, 52, 53], to calculate the due date or fertile window [54, 55], to detect postpartum depression or gestational diabetes mellitus by monitoring the mother’s behaviour and health [56, 57], etc. In addition, pregnancy-related prediction models show promising results [58, 59, 60, 61, 62]. Similar to the CDSS built in this thesis, Table 3.2 presents three pregnancy-related CDSSs, that incorporate a prediction model into an mHealth application.
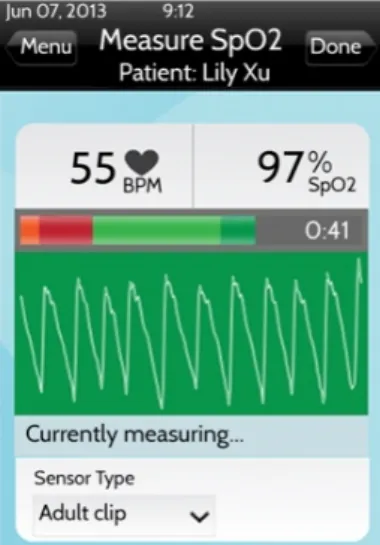
The Pre-eclampsia Integrated Estimate of RiSk (PIERS) on the Move (PotM) is an mHealth smartphone app combining two successful innovations: the miniPIERS risk as-sessment model and the Phone Oximeter [63, 64]. The miniPiers model is developed to predict the risk of an adverse outcome in women with pre-eclampsia, in low resourced settings. This risk score is then used within a decision tree model to generate treatment recommendations. As this decision tree is based, amongst others, on the oxygen satura-tion (SpO2) value, a pulse oximetry sensor (Phone Oximeter) is integrated into the PotM app [67]. The PotM has been proven to be a successful tool, as an accuracy of 85.5% is
Nam e P u rp os e D om ai n Ty p e Use d b y E p iP or tal P ro v id in g u se rs w it h ti m el y in for m at ion re lat ed to in fe c-ti on con tr ol an d p re ve n ti on , b as ed on th ei r E HR d at a su ch as m ic rob iol ogy re su lt s, cl in ic ian or d er s, an d b ed tr ac k in g in for m at ion [41] E p id em iol ogy W eb ap p cl in ic ian , p at ie n t AR US C R ec om m en d in g an ti b iot ic re gi m en s b as ed on in st it u ti on al gu id el in es an d tak in g in to ac cou n t lo cal ep id em iol ogy (An -ti b iot ic R es is tan ce Ut il iz at ion an d S u rv ei ll an ce –C on tr ol ) [42, 43] P h ar m ac y, E p id em iol ogy In te gr at ed sof tw ar e p rogr am cl in ic ian Y ou S c ri p t P ro v id in g d ru g th er ap y re com m en d at ion s to re d u ce d ru g, ge n e, an d cu m u lat iv e in te rac ti on ri sk [44] P h ar m ac y We b se rv ic e cl in ic ian M e n oP ro P re d ic ti n g w h ic h p at ie n ts ar e can d id at es for p h ar m ac ol o-gi c tr eat m en t of m en op au sal sy m p tom s, b as ed on p re d ic -ti on of car d io vas cu lar d is eas e ri sk sc or es , an d p ro v id in g in for m at ion on tr eat m en t op ti on s [45] G y n ae col ogy iP h on e, iP ad ap p li cat ion cl in ic ian , p at ie n t CVD CDST E st im at ion of car d io vas cu lar d is eas e ri sk (C VD ) sc or e, fol -lo w ed b y ri sk -b as ed m an age m en t ad v ic e [46] C ar d iol ogy In te gr at ed sof tw ar e p rogr am cl in ic ian A R I S m ar t F or m Im p ro v in g an ti b iot ic p re sc ri p ti on for ac u te re sp ir at or y in -fe ct ion s [47] P n eu m ol ogy In te gr at ed sof tw ar e p rogr am cl in ic ian Me T re e C al cu lat in g G ai l, B R C Ap ro an d F ram in gh am ri sk sc or es to p re d ic t th e p at ie n t’ s ri sk of can ce rs , car d io vas cu lar sy n -d rom es an d ot h er con d it ion s, p ri m ar il y b as ed on fam il y h eal th h is tor y [48, 49] G en om ic s We b se rv ic e cl in ic ian A S K 2M E P re d ic ti n g can ce r ri sk b as ed on p at ie n ts ’ ge n e car ri er st at u s, age , an d h is tor y of re le van t p rop h y lac ti c su rge ry ; to im p ro ve can ce r p re v en ti on an d d is eas e m an age m en t (Al l S y n d rom es K n ow n to M an E val u at or ) [50] O n col ogy W eb ap p cl in ic ian
App Purpose Used by PotM Predicting risk of maternal adverse outcomes associated with
eclampsia and providing recommendations for management of pre-eclampsia, in resource-limited settings [63, 64]
clinician
PARA Identifying pediatric patients at high risk of mortality in-hospital and after discharge, in resource-limited settings [65]
clinician
MPH Monitoring the mother’s behaviour, identifying and communicating be-havioral risk factors associated with preterm birth and encouraging risk-reduction behaviors [66]
patient
Table 3.2: Overview of pregnancy-related CDSSs that incorporate a prediction model into a mHealth application
reached when using the threshold of 25% miniPIERS-calculated predicted probability to define a high-risk population [64].
Another app that incorporates the Phone Oximeter module, is the PAediatric Risk As-sessment (PARA) app. As the pediatric postdischarge mortality rate often exceeds the in-hospital mortality rate in Sub-Saharan Africa [68], the PARA’s main objective is the early identification of pediatric patients at high risk of mortality, both in-hospital and after discharge, in resource-limited settings [65].
Some mHealth applications are tailored to be used by the patient instead of the clinician, such as the MyHealthyPregnancyApp (MHP). Studies have shown that simple precautions can significantly reduce preterm birth risk [66]. However communicating these simple suggestions to women at high risk, turns out to be the real challenge. Socioeconomic di↵erences often complicate the communication and health care providers sometimes lack the time to learn about the patient’s specific conditions and gather the particular advice for their unique circumstances [69]. Therefore, the MHP app aims to maintain contact with pregnant women in order to assess and communicate their personalized pregnancy risks related to preterm birth and encourage risk-reduction behavior [66].
For illustration purposes, Figure 3.1 some screenshots are shown of the applications in Table 3.2.
(a) Pulse oximetry module in the PotM app [63]
(b) Summary pages indicating the risk factors in the PARA app [65]
(c) Logic diagram to identify, communicate, and intervene with a specific preterm birth risk by the MyHealthPregnancy app [66]
QUiPP
The primary objective of this thesis is the development of a CDSS aiding gynecologists by accurately predicting the preterm birth risk. However, such an application already exists. The Quantitative instrument for the prediction of preterm birth (QUiPP) app was created by King’s College London and aims to prevent the maternal and fetal risks incurred by unnecessary interventions given to women, caused by a treat-all strategy [15].
The QUiPP app is designed to help clinicians determine the spontaneous preterm birth (SPTB) risk in two cases: asymptotic women at high risk of preterm birth and women showing symptoms of threatened preterm labor [15]. For each case, 3 di↵erent prediction models have been developed and they are chosen depending on whether the risk assessment includes the test results for quantitative fetal fibronectin (QfFN) concentration alone, the cervical length alone or both qfFN and cervical length [70]. Apart from clinical test results as qfFN and cervical length, other variables are incorporated such as medical history (previous sPTB/PPROM/cervical surgery), previous late miscarriage, gestational age (between 18 and 37 weeks), number of fetuses and of course the presence of symptoms suggestive of preterm labour [71].
The QUiPP app is available as both a smartphone and web app. Upon opening the app, two questionnaires are at the clinician’s disposal, for either an asymptomatic or symptomatic patient, as depicted in Figure 3.2. Once this questionnaire has been filled in, the risk probabilities of spontaneous delivery are presented as simple percentages, shown in Figure 3.3. Unfortunately, the QUiPP app doesn’t provide any reasoning behind these prediction results.
Validation of the QUiPP prediction models shows that the AUC scores for the asymp-tomatic and sympasymp-tomatic models are ranging respectively from 0.77-0.99 and 0.77-0.88, which is higher than previously reported for prediction models based on cervical length and qfFN [70, 72, 73]. So the QUiPP app may indeed be considered a reliable aid in the PTB risk calculation [15].
Figure 3.2: QUiPP app questionnaire for asymptomatic and symptomatic women [72]
3.2
Requirements
Even though the QUiPP app may aid clinicians in the preterm birth prediction problem, it does not meet all the requirements. More specifically, the QUiPP app incorporates only a very small set of parameters and lacks transparency in the prediction results. Hence, in this section, the fundamental requirements are enumerated for the CDSS aimed at in this thesis.
3.2.1
Functional requirements
resuirements
• The clinician can add a new patient to the system and create her patient file. • The clinician can search for a particular patient based on her identifier.
• The clinician can enter information about the patient’s health that remains constant throughout the pregnancy.
• The clinician can enter information about patient ’s health that change throughout the pregnancy and/or admission.
• The clinician can enter information about the admission, discharge or readmission of the patient.
• The clinician can enter information about the birth of the child.
• The system saves the entered patient’s data in an open, exportable format that easily allows use by other software.
• The system displays the entered patient data to give the clinician a clear overview. • The clinician can request a prediction of the preterm birth risk based on the entered
patient data.
• The system displays the prediction results in a clear and interpretable way.
• The system provides a transparent reasoning behind the prediction results to boost the clinicians’ trust.
3.2.2
Non-functional requirements
• Data Integrity: The patient data should not contain inconsistencies.
• Security: Only clinicians should be able to access the app and their patient’s data. • Usability: The application should be easily available through a web interface,
assuming there is an internet connection available at the hospital.
• User-friendliness: The app should be designed in an intuitive and user-friendly way and avoid time-consuming prediction generation to stimulate the app’s incor-poration into the clinical workflow.
3.3
Architecture
As no existing mHealth application meets the aforementioned requirements, a POC, called the PRETURN app, is developed. Figure 3.4 gives an overview of the architecture of the PRETURN app, along with the chosen technologies to implement it.
Figure 3.4: Architectural overview of PRETURN app
The PRETURN app is a web application, that is divided into a front- and backend. The frontend of the web tool was set up using the VueJS framework [74] and BootstrapVue [75]. VueJS is a JavaScript framework that allows for swift development due to its gentle
learning curve [74]. In addition, BootstrapVue integrates the popular frontend CSS library, Bootstrapv4 [76], into the VueJS framework to ensure fast and responsive webdesign[75]. Via this frontend, the clinician may enter the patient data, request a risk prediction, and provide feedback on the prediction results. These functionalities will be explained in more detail in Section 3.4.
To correctly store and retrieve the patient’s data, a Flask [77] web API is deployed. The API should have endpoints to perform general Create, Read, Update and Delete (CRUD) operations on the patient files and an endpoint to generate risk predictions. Both the patient data and the clinician’s feedback on the predictions are stored in a comma-separated values (CSV) file. The use of an actual database system seems superfluous for now, as data storage is not the main objective of this POC and the system might become integrated with the hospital’s database in the future. Following the functional requirements in Section 3.2, CSV is chosen because it is an open and exportable format, that easily lends itself to be used by other software such as the machine learning module. As shown in Figure 3.4, the backend is also supposed to be coordinating the machine learning (ML) module. Since the development of the ML model is still in progress, see Chapter 4, the API is presently not integrated with an actual model. The necessary endpoints for prediction calculation, however, have already been set up and currently contain random percentage generation. Thus, for now, the backend’s main functionality is the coordinated access to the data storage.
Revisiting the non-functional requirements in Subsection 3.2.2, it is obvious that the usability requirement has been satisfied, as the PRETURN app is available through a responsive web interface. The security requirement is considered to be out-of-scope for this POC. In the future, an authentication login may be added to ensure the system’s security.
3.4
Implementation
This section gives a more detailed on how the functional requirements in Section 3.2 are met in the PRETURN app. First, an in-depth look is taken at the data storage in the backend, after which the frontend’s functionalities are shown in an elaborate walkthrough.
3.4.1
Backend
As mentioned in Section 3.3, the main functionality, for now, in the backend is access to the data storage. The Flask API is well documented and contains endpoints to retrieve, search or add a patient’s file, to add or edit the admission or temporal information and to generate a risk prediction for a particular patient. Patient data is stored in a comma-separated values (CSV) file according to the JavaScript Object Notation (JSON) format shown in Listing 3.1. As an identifier, an integer is assigned to each patient upon creation of the patient’s entry. The data gets separated into three parts: admission, temporal, prediction.
Listing 3.1: General JSON format when storing patient information
1 [ 2 { 3 i d : 1, // PRETURN i d 4 a d m i s s i o n : [ ], // 1 e n t r y p e r a d m i s s i o n 5 t e m p o r a l : [ ], // 1 e n t r y p e r measurement timestamp 6 p r e d i c t i o n : [ ] // 1 p e r r e q u e s t e d p r e d i c t i o n 7 }, 8 . . . 9 ]
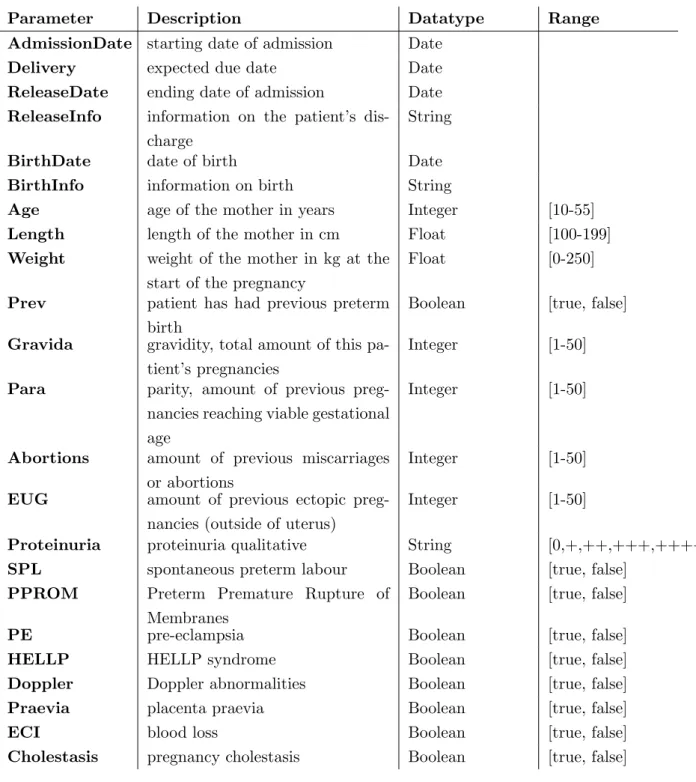
Every time the patient is admitted to the hospital, a new admission entry can be added, which contains more general data that ought to remain the same during an admission. Table 3.3 shows the selection of parameters in such an admission entry. Except for Ad-missionDate and Delivery, the values for the shown keys can be empty. The ReleaseInfo, ReleaseDate, BirthDate and BirthInfo are optional, thus only present if the patient is discharged or gave birth respectively.
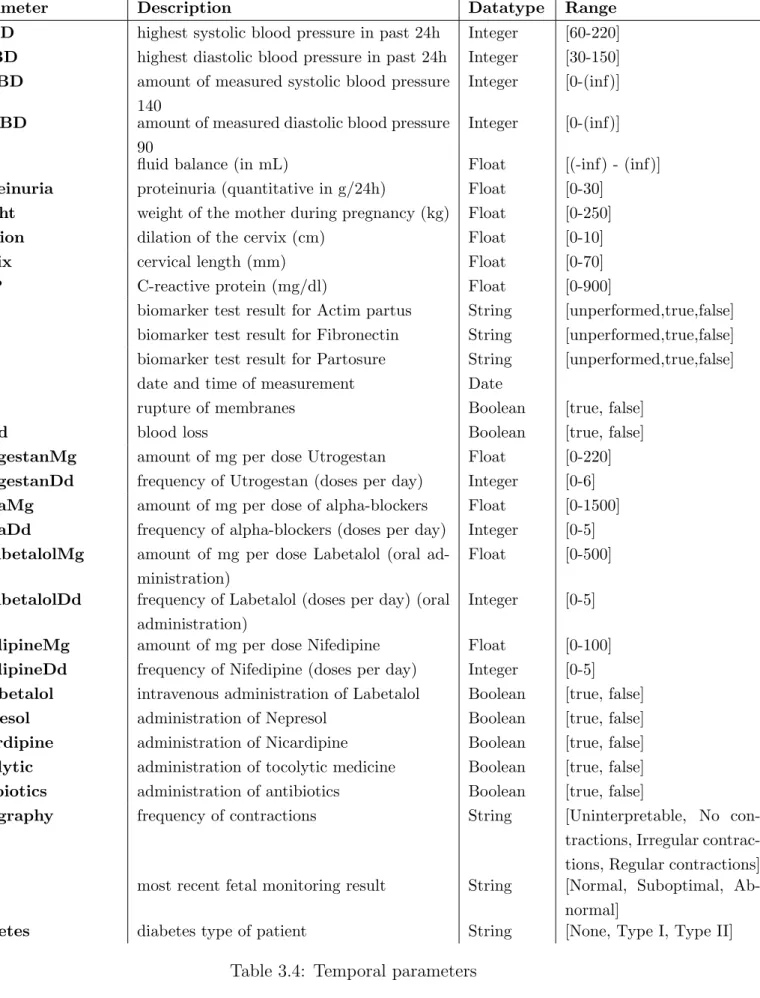
Some parameters are measured multiple times during admission and may vary greatly. The values for these parameters are stored in the temporal entry, as shown in Table 3.4. To increase user-friendliness, only the date parameter is required, all the other parameters may be left empty. If gynecologists base their decision on certain parameters that have not yet been included in the tool, they can add an extra custom parameter using the custom parameter. They can add as many custom parameters as they prefer, as long as they provide both the name (feature name) and value (feature value) for this new parameter. The date timestamp uniquely identifies each temporal entry so multiple temporal entries can be added for each admission.
Parameter Description Datatype Range AdmissionDate starting date of admission Date
Delivery expected due date Date ReleaseDate ending date of admission Date ReleaseInfo information on the patient’s
dis-charge
String
BirthDate date of birth Date BirthInfo information on birth String
Age age of the mother in years Integer [10-55] Length length of the mother in cm Float [100-199] Weight weight of the mother in kg at the
start of the pregnancy
Float [0-250]
Prev patient has had previous preterm birth
Boolean [true, false]
Gravida gravidity, total amount of this pa-tient’s pregnancies
Integer [1-50]
Para parity, amount of previous preg-nancies reaching viable gestational age
Integer [1-50]
Abortions amount of previous miscarriages or abortions
Integer [1-50]
EUG amount of previous ectopic preg-nancies (outside of uterus)
Integer [1-50]
Proteinuria proteinuria qualitative String [0,+,++,+++,++++] SPL spontaneous preterm labour Boolean [true, false]
PPROM Preterm Premature Rupture of Membranes
Boolean [true, false]
PE pre-eclampsia Boolean [true, false] HELLP HELLP syndrome Boolean [true, false] Doppler Doppler abnormalities Boolean [true, false] Praevia placenta praevia Boolean [true, false] ECI blood loss Boolean [true, false] Cholestasis pregnancy cholestasis Boolean [true, false]
Parameter Description Datatype Range SABD highest systolic blood pressure in past 24h Integer [60-220] DABD highest diastolic blood pressure in past 24h Integer [30-150] aSABD amount of measured systolic blood pressure
140
Integer [0-(inf)]
aDABD amount of measured diastolic blood pressure 90
Integer [0-(inf)]
fluid fluid balance (in mL) Float [(-inf) - (inf)] proteinuria proteinuria (quantitative in g/24h) Float [0-30]
weight weight of the mother during pregnancy (kg) Float [0-250] dilation dilation of the cervix (cm) Float [0-10] cervix cervical length (mm) Float [0-70] CRP C-reactive protein (mg/dl) Float [0-900]
ap biomarker test result for Actim partus String [unperformed,true,false] fib biomarker test result for Fibronectin String [unperformed,true,false] part biomarker test result for Partosure String [unperformed,true,false] date date and time of measurement Date
rom rupture of membranes Boolean [true, false] blood blood loss Boolean [true, false] utrogestanMg amount of mg per dose Utrogestan Float [0-220] utrogestanDd frequency of Utrogestan (doses per day) Integer [0-6] alphaMg amount of mg per dose of alpha-blockers Float [0-1500] alphaDd frequency of alpha-blockers (doses per day) Integer [0-5] OSlabetalolMg amount of mg per dose Labetalol (oral
ad-ministration)
Float [0-500]
OSlabetalolDd frequency of Labetalol (doses per day) (oral administration)
Integer [0-5]
nifedipineMg amount of mg per dose Nifedipine Float [0-100] nifedipineDd frequency of Nifedipine (doses per day) Integer [0-5] IVlabetalol intravenous administration of Labetalol Boolean [true, false] nepresol administration of Nepresol Boolean [true, false] nicardipine administration of Nicardipine Boolean [true, false] tocolytic administration of tocolytic medicine Boolean [true, false] antibiotics administration of antibiotics Boolean [true, false]
tocography frequency of contractions String [Uninterpretable, No con-tractions, Irregular contrac-tions, Regular contractions] fetal most recent fetal monitoring result String [Normal, Suboptimal,
Ab-normal]
diabetes diabetes type of patient String [None, Type I, Type II]
![Figure 2.1: PRETURN decision support system [3]](https://thumb-eu.123doks.com/thumbv2/5doknet/3273019.21348/24.893.111.782.532.828/figure-preturn-decision-support-system.webp)
![Figure 3.3: Visualization of prediction results in QUiPP app [72]](https://thumb-eu.123doks.com/thumbv2/5doknet/3273019.21348/34.893.300.590.621.1015/figure-visualization-of-prediction-results-in-quipp-app.webp)