RIVM
National Institute for Public Health and the Environment P.O. Box 1
3720 BA Bilthoven the Netherlands www.rivm.com
Economic evaluation of prevention
Modelling the cost-effectiveness of increasing alcohol
taxes and of prevention of major depression
Report 270091006/2008 P.H.M. van Baal et al.
RIVM Report 270091006/2008
Economic evaluation of prevention
Modelling the cost-effectiveness of increasing alcohol taxes and of
prevention of major depression
PHM van Baal M van den Berg L Tariq RT Hoogenveen CG Schoemaker AJ Schuit GA de Wit Contact: Pieter van Baal
Centre for Prevention and Health Services Research Pieter.van.Baal@rivm.nl
This investigation has been performed by order and for the account of Ministry of Health, Welfare and Sports, within the framework of project V/270091, Cost-effectiveness of prevention
© RIVM 2008
Parts of this publication may be reproduced, provided acknowledgement is given to the 'National Institute for Public Health and the Environment', along with the title and year of publication.
Rapport in het kort
Economische evaluatie van preventieModelleringstudies naar de kosteneffectiviteit van accijnsverhogingen op alcohol en van depressiepreventie
Accijnsverhogingen op alcohol en een vroegtijdige opsporing van depressies leveren veel
gezondheidswinst op tegen relatief lage kosten. De opsporing van dit stadium van een depressie door
de huisarts, gevolgd door minimale contact psychotherapie (MCP) levert naar verwachting 13.000 gezonde levensjaren op en kost op termijn gemiddeld € 6.800, - per gewonnen gezond levensjaar. De geplande accijnsverhoging voor 2009 levert naar verwachting 13.000 gezonde levensjaren op en kost op termijn gemiddeld € 5.100,- per gewonnen gezond levensjaar. Beide maatregelen zijn daarmee kosteneffectieve interventies.
Uit eerder onderzoek bleek dat beide interventies effectief zijn in het voorkomen van ziekte, alleen was nog weinig bekend over de kosteneffectiviteit. Daarom is in dit rapport met behulp van
modelberekeningen de mogelijke kosteneffectiviteit in de Nederlandse context onderzocht. Hierbij is uitgegaan van grootschalige implementatie van de maatregelen. De gezondheidseffecten zijn uitgedrukt in voor kwaliteit gecorrigeerde gewonnen levensjaren (QALY’s, oftewel gewonnen gezonde
levensjaren) en alleen kosten binnen het gezondheidszorgperspectief zijn meegenomen. Andere kosten- en effectencategorieën zoals ziekteverzuim hebben ook een grote invloed op de kosteneffectiviteit van de interventies. Onderzoek naar de bredere kosten en effecten van preventieve interventies is daarom gewenst.
Trefwoorden: kosteneffectiveitsanalyse; economische evaluatie; preventie; modelleren; alcohol; depressie
Abstract
Economic evaluation of prevention
Modelling the cost-effectiveness of increasing alcohol taxes and of prevention of major depression Increasing alcohol taxes and case finding of sub-threshold depression and subsequent treatment thereof are both preventive interventions that yield high benefits at low costs. Case finding of sub-threshold depression in the setting of the Dutch general practitioner is estimated to result in health gains of approximately 13,000 QALYs at a cost of € 6,800 per QALY gained. The planned Dutch alcohol tax increase for 2009 results in on average 13,000 QALYs at a cost of € 5,100 per QALY gained.
This report describes research on the cost-effectiveness of increases in alcohol taxes and case finding of sub-threshold depression and subsequent treatment thereof with Minimal Contact Psychotherapy (MCP). Both interventions have been proven effective in previous research. However, not much is known on the cost-effectiveness of these interventions. Therefore, using simulation models, the cost effectiveness of these interventions has been investigated for the Netherlands in this report. To do this, a health care perspective was taken implying that only health care costs were taken into account and that effects were expressed in Quality Adjusted Life Years (QALYs).
Especially for the tax increase, taking the health care perspective effectively illustrated the advantages compared to interventions whose intervention costs traditionally fall inside the health sector like treatment of alcohol addiction or curative treatments in a hospital setting. For depression, which also has a high impact on health care costs, our modelling exercise revealed that even within this narrow perspective ignoring several important costs outside the health care setting, prevention of major depression appears to be cost-effective. However, it deserves recommendation to carry out further research into these interventions focusing on costs and consequences outside the health care sector. Key words: cost-effectiveness, economic evaluation, prevention, modelling, alcohol, depression
Preface
This report describes two modeling studies on the cost-effectiveness of preventive interventions. Many colleagues from the Center for Nutrition and Health, Center for Public Health Forecasting and the Center for Prevention and Health Services Research provided with critical feed-back on drafts of this report. We would like to thank all of them for their contributions to our work. Furthermore, we would like to thank Filip Smit from the Trimbos Institute and Theo Vos from the University of Queensland for their indispensable contributions to the development of the depression model.
Contents
Samenvatting 7
1. Introduction 10
2. Cost effectiveness of increasing alcohol taxes 11
2.1 Background 11
2.2 Methods 12
2.2.1 The RIVM Chronic Disease Model (CDM) 12
2.2.2 Scenarios 13
2.3 Results 14
2.4 Conclusion and discussion 18
3. Cost-effectiveness of depression prevention 21
3.1 Background 21
3.2 Methods 21
3.2.1 Intervention and target population 21
3.2.2 Depression Markov Model 22
3.2.3 Scenarios 23
3.3 Results 24
3.4 Conclusion and discussion 26
Samenvatting
Binnen het project ‘Kosteneffectiviteit van preventie’ is de kosteneffectiviteit van accijnzen op alcohol en preventie van depressie middels actieve opsporing en behandeling van subklinische depressie in de huisartspraktijk onderzocht. Beide interventies zijn effectieve interventies gebleken. Van beide interventies is echter nog weinig bekend over de kosteneffectiviteit. Daarom is in dit rapport met behulp van modelleren onderzocht wat de mogelijke kosteneffectiviteit zou zijn in Nederland. Hierbij is uitgegaan van grootschalige implementatie en zijn alleen kosten binnen het
gezondheidszorgperspectief meegenomen. De gezondheidseffecten zijn uitgedrukt in voor kwaliteit gecorrigeerde levensjaren (QALY’s c.q. gezonde levensjaren). Met behulp van een zogenaamde probabilistische gevoeligheidsanalyse zijn onzekerheden in de invoergegevens (onder andere onzekerheden in de prijsgevoeligheid van de vraag naar alcohol) vertaald naar schattingen van de onzekerheid in de uitkomsten (zorgkosten en QALY’s).
Accijnsverhoging op alcohol
Overmatig alcoholgebruik, gedefinieerd als drie of meer alcoholconsumpties per dag voor mannen, en twee of meer alcoholconsumpties per dag voor vrouwen, is een belangrijke risicofactor/oorzaak voor sterfte en ziektelast in termen van verhoogd risico op chronische ziektes waaronder hart- en vaatziekten en diverse soorten kankers. Tevens is alcohol geassocieerd met een verhoogd risico op
verkeersongelukken. Dit leidt tot veel gezondheidsverlies in termen van verloren kwaliteit van leven, verloren levensjaren, en voor kwaliteit gecorrigeerde levensjaren (QALY’s). Ondanks het feit dat in de meeste westerse landen accijnzen op alcohol een belangrijke rol spelen bij het tot stand komen van de verkoopprijzen van alcohol, worden accijnsverhogingen traditioneel niet gezien als een instrument om de volksgezondheid te bevorderen. Een verklaring hiervoor ligt in het feit dat deze accijnzen
gereguleerd worden vanuit het ministerie van Financiën en dat de accijnsopbrengsten geen deel uitmaken van het gezondheidszorgbudget.
In hoofdstuk 2 van dit rapport is de kosteneffectiviteit van accijnsverhoging op alcohol onderzocht met behulp van het RIVM Chronische Ziekten Model (CZM). Met behulp van schattingen van de
prijsgevoeligheid van de vraag naar alcohol zijn accijnsverhogingen vertaald in dalingen van de alcoholconsumptie. Het CZM is vervolgens gebruikt om het effect van dalingen in alcoholconsumptie, te ramen op de zorgkosten, gewonnen levensjaren en voor kwaliteit gecorrigeerde levensjaren. Als basis voor deze raming diende een referentiescenario welke vergeleken is met de volgende interventiescenario’s:
• ‘Nederlands scenario’: in dit scenario zijn de gezondheidseffecten en kosteneffectiviteit berekend
van accijnsverhogingen op alcohol welke gepland staan voor het jaar 2009. Verwacht wordt een verhoging van € 0,027 per fles bier;
• ‘Zweeds scenario’: gezondheidseffecten en kosteneffectiviteit zijn berekend gebaseerd op
accijnzen op alcohol gehanteerd in Zweden. In Zweden zijn accijnzen op alcohol het hoogst binnen Europa, resulterend in een accijnsverhoging van € 0,18 per fles bier, €1,34 per 0,75 liter wijn, en €9,51 per 0.7 liter sterke drank.
In het Nederlandse scenario daalt de alcoholconsumptie met gemiddeld 0,3% en in het Zweedse scenario met gemiddeld 18,3%. Deze daling in alcoholconsumptie resulteert in een daling van aan alcohol gerelateerde chronische ziekten en een stijging van de levensverwachting. In termen van zorgkosten is de stijging van de zorgkosten als gevolg van levensverlenging groter dan de besparingen op alcoholgerelateerde ziekten. De geplande accijnsverhoging voor 2009 levert naar verwachting
13.000 QALYs op en kost gemiddeld € 5.100 per gewonnen QALY. In het Zweedse scenario worden naar schatting 624.0000 QALY’s gewonnen tegen een prijs van € 5.300 per gewonnen QALY. Hoewel de kosteneffectiviteit in beide scenario’s dus bijna gelijk is, zijn echter de gezondheidswinsten in het Zweedse scenario vele malen groter.
Geconcludeerd kan worden dat een accijnsverhoging op alcohol vanuit het gezondheidszorgperspectief een kosteneffectieve interventie is. In eerder onderzoek naar de kosteneffectiviteit van accijnzen op alcohol gericht op het verminderen van zwaar alcoholgebruik waren alleen de gezondheidseffecten van de zware drinkers meegenomen in de analyse. Aangezien accijnzen op alcohol niet kunnen worden toegerekend aan specifieke categorieën drinkers, is het nodig om gezondheidseffecten voor de hele populatie mee te nemen. Dit is in deze studie gedaan, en in dat geval blijft een accijnsverhoging doelmatig en zijn de gezondheidseffecten bovendien groter. Doelmatigheid zou nog gunstiger kunnen zijn als ook de negatieve gezondheidseffecten van alcoholconsumptie op anderen worden
meegenomen. Deze zijn echter moeilijker te kwantificeren.
Actieve opsporing subklinische depressie en behandeling middels minimale contact psychotherapie
In Nederland staat depressie in termen van ziektelast op de vierde plaats in de ranglijst. Jaarlijks krijgen ongeveer 290,000 volwassenen ( 3% van de Nederlandse bevolking) voor het eerst in hun leven te maken met klachten van depressie. Effectieve preventie van depressie kan de ziektelast aanzienlijk verminderen. In hoofdstuk 3 van dit rapport is de kosteneffectiviteit van actieve opsporing van subklinische depressie en behandeling middels minimale contact psychotherapie (MCP) onderzocht. MCP is succesvol gebleken bij het voorkomen van depressie. Het is een interventie gericht op personen met een zogenoemde subklinische depressie, dus personen die klinische symptomen van depressie ondervinden maar nog niet gediagnosticeerd zijn voor depressie. Hoewel de kosteneffectiviteit van MCP in het verleden is onderzocht waren de uitkomstmaten destijds niet uitgedrukt in voor kwaliteit gecorrigeerde levensjaren (QALY’s) maar in het aantal vermeden gevallen van depressie. Daarnaast was de gekozen tijdshorizon slechts één jaar, en waren de kosten van het opsporen van geschikte kandidaten in de huisartspraktijk niet meegenomen in de analyse. In dit onderzoek hebben we de kosteneffectiviteit van MCP uitgedrukt in euro’s per QALY, berekend vanuit het
gezondheidszorgperspectief. Hiervoor hebben we het depressiemodel, beschreven in ons voorgaand rapport, uitgebreid teneinde subklinische depressie mee te nemen.
In het interventiescenario bestond de studiepopulatie uit alle personen in de leeftijdscategorie 20-65 jaar welke jaarlijks de huisarts bezoeken. Volgens het Centraal Bureau voor de Statistiek (CBS) zijn dit ongeveer 7 miljoen personen. Allereerst zijn al deze personen wanneer op bezoek bij de huisarts (niet specifiek voor klachten/symptomen van depressie) gescreend op subklinische depressie. Hierna, de tweede stap, zijn de positief bevonden personen opnieuw gescreend om te controleren of deze patiënten voldeden aan de inclusiecriteria (onder andere niet gediagnosticeerd als depressief). Een Markov model is vervolgens gebruikt om gezondheidseffecten en –kosten te schatten als gevolg van de
MCP-interventie.
In het interventiescenario ontvingen gemiddeld ongeveer 296.000 personen de MCP-interventie, wat gelijk staat aan ongeveer 4% van de studiepopulatie. Gemiddeld won een persoon bij het ontvangen van de MCP-interventie 0,045 QALY over een periode van vijf jaar, tegen additionele kosten van €300. Dit resulteert in een kosteneffectiviteitratio van € 6.800 per gewonnen QALY. Wanneer kosten
gerelateerd aan het wervingsproces (eerste stap) buiten beschouwing worden gelaten, daalt de incrementele kosteneffectiviteitratio naar € 3.100 per gewonnen QALY.
Geconcludeerd kan worden dat vanuit het gezondheidszorgperspectief gezondheidswinst kan worden behaald tegen relatief lage kosten bij het actief opsporen van personen met subklinische depressie
binnen huisartspraktijken, en het aanbieden van de MCP-interventie aan deze mensen. Vergeleken met een eerdere studie naar de doelmatigheid van MCP, toont deze studie aan dat wanneer
gezondheidseffecten worden uitgedrukt in termen van QALY’s in plaats van het aantal vermeden gevallen van depressie, de MCP-interventie nog steeds doelmatig blijft ook als de wervingskosten worden meegenomen in de analyse.
Discussie
Dit rapport beschrijft de kosteneffectiviteit van twee interventies gericht op accijnsverhogingen op alcohol en preventie van depressie. Vanuit het gezondheidszorgperspectief leveren beide interventies gezondheidswinst op tegen relatief lage kosten. Hoewel dit een relevant gegeven is voor beleidsmakers, aangezien zij keuzes maken die betrekking hebben op het gezondheidszorgbudget, kunnen andere kosten- en effectencategorieën een grote invloed hebben op de kosteneffectiviteit van de interventie. Bijvoorbeeld, afname in morbiditeit in de beroepsbevolking zou kunnen leiden tot stijging van de arbeidsproductiviteit, waardoor indirecte effecten optreden. In het geval van overmatig alcoholgebruik en depressie kunnen indirecte kosten hoger uitpakken dan de directe medische kosten. Vanuit het maatschappelijk perspectief zouden kosten en effecten gerelateerd aan mantelzorg, gewelddadig gedrag door binge-drinkers, en vroegtijdig sterfte moeten worden betrokken in de analyse, aangezien deze substantieel kunnen zijn. Daarom wordt in dit rapport gepleit voor onderzoek naar de bredere kosten en effecten van preventieve interventies.
1.
Introduction
In order to know whether investing in prevention offers value for money, many economic evaluations have estimated the cost effectiveness of different preventive interventions. In cost effectiveness analysis costs and effects of a program or intervention and at least one alternative are calculated and presented in a so-called cost effectiveness ratio. The health gain due to the intervention is captured in the denominator of the cost-effectiveness ratio, while the numerator captures the net costs of obtaining that health gain. This provides health policy makers with information on how to gain health most efficiently. To enable comparison across a broad range of interventions targeted at different diseases, risk factors and/or age groups, health gains are preferably expressed in quality adjusted life years (QALYs). The QALY measure combines both the effects of an intervention on mortality and on quality of life.
In this study, we will estimate the cost effectiveness of two different interventions aimed at reducing the burden of diseases contributing importantly to morbidity and mortality in the Netherlands, namely:
• alcohol tax increases;
• prevention of major depression.
These interventions were chosen because both depression and alcohol dependence are currently important public health policy targets in the Netherlands, and for both interventions not much is known about the cost effectiveness of prevention in terms of euro per QALY. To estimate the cost
effectiveness of both interventions, modeling techniques are used. Important advantage of modeling is that information from many different sources can be combined to form a single coherent framework. Moreover, modeling techniques allow translating intermediate outcomes like reduced alcohol consumption into QALYs. The outline of this report is as follows: chapter 2 focuses exclusively on alcohol tax increases and chapter 3 on the prevention of major depression through minimal contact psychotherapy. Each chapter ends with a conclusion and discussion.
2.
Cost effectiveness of increasing alcohol taxes
2.1
Background
Excessive alcohol use (defined as more than three alcohol consumptions per day for men, and more than two alcohol consumptions per day for women) is a cause of morbidity and mortality, as it increases risks of chronic diseases such as coronary heart disease and several types of cancer, with associated losses of quality of life and life-years 1. According to Statistics Netherlands, at the moment about 14% of the Dutch men aged 12 and over drinks more than three alcoholic consumptions per day and about 10% of the Dutch women aged 12 and over drinks more than two alcoholic consumptions per day 2. As a consequence, about 1% of the Dutch mortality, 4.5% of the Dutch burden of disease and 0.6% of the Dutch total health care costs in 2003 can be attributed to chronic diseases caused by excessive alcohol consumption 3. Therefore, alcohol control in its various guises potentially decreases the burden of disease substantially and thus is an important candidate for health care policy 4.
Even though in most Western countries retail prices of alcohol are heavily influenced by alcohol excise taxes 3 an alcohol tax increase is a public policy tool that traditionally falls outside the scope of health policy. The reason for this might be that alcohol taxes usually are controlled by Ministries of Finance and that tax revenues are not part of the health care budget. A notable exception in this respect is Thailand where excise taxes on alcohol and tobacco are used to fund major health care programs 5. Still, from a public health perspective alcohol taxes are an important instrument as they are known to be able to substantially decrease alcohol consumption. An increase in alcohol taxes normally leads to an increase in prices of alcohol, which in turn leads to a decrease in the demand of alcohol. To measure the effect of price increases on alcohol consumption, economists estimate the price elasticity that indicates how much the consumption of a certain good changes if its price is changed. Clements, Yang and Zheng 6 report price elasticity figures for seven countries, (Finland, Sweden, Norway, UK, Canada, Australia and New Zealand), covering the period from the mid-1950s to the mid-1980s. They find a price elasticity of – 0.35 for beer, – 0.68 for wine and – 0.98 for spirits. These price elasticity figures imply that if for instance beer prices increase with 10%, beer consumption decreases with 3.5%. The only previous study on the cost effectiveness of alcohol taxation was conducted within the WHO-CHOICE project 7 8. They found that alcohol control policies, particularly tax increases on alcohol, are cost-effective relative to other health interventions. However, in their estimates of the cost
effectiveness of alcohol taxes, they only took into account health effects derived in heavy drinkers and ignored effects of taxation on the health of moderate drinkers. In this chapter, we estimate the cost effectiveness of an alcohol tax increase using a dynamic model for the entire Dutch population, from a health care perspective focusing on health benefits and health care costs in alcohol users themselves. This implies that we will not take into account external effects of alcohol prevention policies, e.g. through a reduction of harm done to others through violence. Also, since the effects of price increases have been limited to average consumption of alcohol, we did not take into account effects on drinking patterns (e.g. binge drinking during one or two days a week and abstinence on the remaining days) and alcohol dependency.
2.2
Methods
2.2.1
The RIVM Chronic Disease Model (CDM)
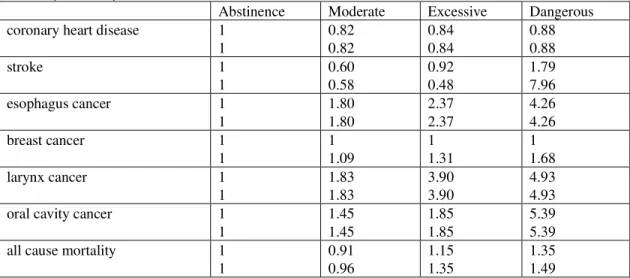
To extrapolate from decreased alcohol consumption due to tax increases to effects on health care costs, life years gained and QALYS gained, the RIVM Chronic Disease Model (CDM) was used 9. The CDM is a tool to describe the morbidity and mortality effects of risk factors for chronic diseases, such as smoking and overweight, and has been used for projections of risk factor and disease prevalence, estimates of health adjusted life expectancy and cost effectiveness analysis 10-13. The model describes the life course of cohorts in terms of changes between risk factor classes and changes between disease states over time. It allows for co morbidity and includes data on most important chronic diseases and their risk factors. Risk factors and diseases are linked through relative risks on disease incidence. The model relates the risk factor alcohol use to the following diseases: coronary heart disease, stroke, esophagus cancer, breast cancer, oral cavity cancer and larynx cancer. Alcohol classes distinguished in the CDM are abstinence (no alcohol consumption), moderate alcohol consumption (1-3 alcohol consumptions per day), excessive alcohol consumption (4 to 5 alcohol consumptions per day) and dangerous alcohol consumption (more than 5 alcohol consumptions per day). Table 2.1 displays the relative risks for the diseases related to alcohol consumption and all cause mortality employed in the CDM which are all derived from meta-analyses 14.
Table 2.1: Relative risks on disease incidence and all cause mortality, both for men (upper row) and women (lower row)
Abstinence Moderate Excessive Dangerous
coronary heart disease 1
1 0.82 0.82 0.84 0.84 0.88 0.88 stroke 1 1 0.60 0.58 0.92 0.48 1.79 7.96 esophagus cancer 1 1 1.80 1.80 2.37 2.37 4.26 4.26 breast cancer 1 1 1 1.09 1 1.31 1 1.68 larynx cancer 1 1 1.83 1.83 3.90 3.90 4.93 4.93
oral cavity cancer 1
1 1.45 1.45 1.85 1.85 5.39 5.39
all cause mortality 1
1 0.91 0.96 1.15 1.35 1.35 1.49
From Table 2.1, it can be seen that alcohol consumption has a positive influence on coronary heart disease and stroke (with the exception of dangerous drinking), but a negative influence on the incidence of several types of cancers. Dangerous levels of alcohol consumption are also negatively related to stroke incidence. Table 2.1 immediately shows the challenge and the difficulties of alcohol prevention policies, as moderate and even excessive consumption of alcohol not only have negative public health effects, but positive effects as well. It should be noted that esophagus, larynx and oral cavity cancers have a low incidence compared to CVD, stroke and breast cancer. On balance, excessive and dangerous levels of alcohol consumption have shown to have an elevated mortality risk 7. To capture the
influence of increased mortality caused by alcohol through causes of death not explicitly modeled in the CDM a relative risk on other causes of death is employed in the CDM 15. In this way, the influence
of alcohol on the mortality caused for instance by traffic injuries and/or liver cirrhosis is taken into account.
2.2.2
Scenarios
To evaluate the long term effects of alcohol tax increases, the following two intervention scenarios were compared to the current practice scenario (excise taxes as implemented in 2007):
• ‘Dutch scenario’: in this scenario health effects and cost effectiveness of the tax increase as
currently planned for 2009 are estimated. The government has planned a tax increase on beer of 2.7 cent per bottle of beer (content 0.3 l). As currently planned, excise taxes for wine and spirits will remain unchanged compared to the current practice scenario. It is assumed that producers fully pass on the tax increase to consumers;
• ‘Swedish scenario’: in this scenario, health effects and cost effectiveness of a tax increase are
estimated, assuming that tax levels are increased to the same level as in Sweden, which is the EU country with the highest alcohol taxes. Again, it is assumed that producers do not adapt their prices. This would imply that beer taxes would be increased with €0.18 per bottle of beer, wine with € 1.34 per 75cl and spirits with € 9.51 per 70cl 16. In this scenario it is also assumed that producers fully pass on the tax increase to consumers;
In the current practice scenario, we made projections with the CDM of QALYs and health care costs using the distribution of alcohol consumption. This distribution was estimated using data from the annual POLS survey from Statistics Netherlands 2. These were then compared to the intervention scenarios, in which we estimated the alcohol consumption distribution which has been altered due to the alcohol tax increases using the price elasticity estimates published by Clements, Yang and Zheng 6. This was done by first subtracting the average decrease in alcohol consumption due to the tax increase for every individual on the raw POLS data. Then, the alcohol consumption distribution was re-estimated. To calculate the average relative decrease in alcohol consumption due to absolute tax increases for the different types of alcohol the absolute price increase had to be transformed in a relative price increase. To do this, data on the market shares and prices of beer, wine and spirits were needed. Market shares of the different types of alcohol were taken from the Health for All database 17 and a range for selling prices was taken using supermarket prices as a minimum and catering industry prices as a maximum.
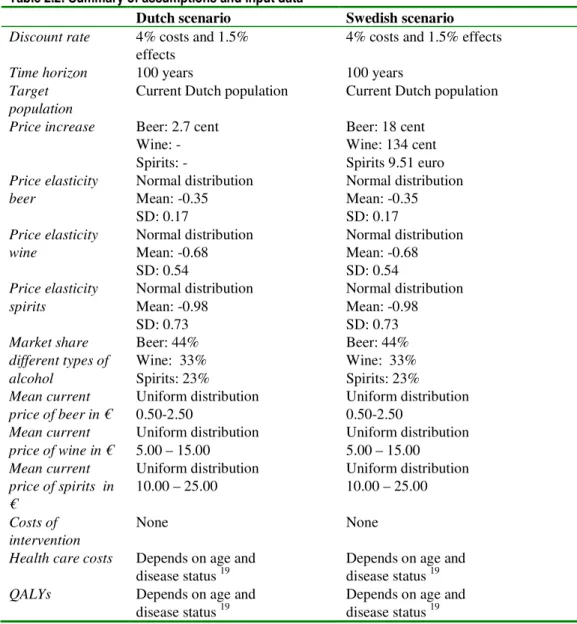
To find cost-effectiveness ratios, yearly differences in model outcomes between intervention and current practice scenarios were discounted and added over the time horizon to find net present values for incremental life years gained, QALYs gained, and health care costs 9. Future costs and effects were discounted at the Dutch standard annual percentages of 4% for costs and 1.5% for effects 18. The time horizon was 100 years since by then the cohorts that experienced the price increase have become extinct. All cost data were presented in euro, for the price level of 2003. With Probabilistic Sensitivity Analysis (PSA) uncertainty in the input parameters is addressed and reflected in the model output (the ICER). In the PSA we used the uncertainty estimates for all relative risk values 14, values of the price elasticity 6 and mean selling prices of the different types of alcohol needed to calculate the relative price increase. Table 2.2 summarizes the assumptions in the scenarios.
Table 2.2: Summary of assumptions and input data
Dutch scenario Swedish scenario
Discount rate 4% costs and 1.5%
effects 4% costs and 1.5% effects
Time horizon 100 years 100 years
Target
population Current Dutch population Current Dutch population Price increase Beer: 2.7 cent
Wine: - Spirits: -Beer: 18 cent Wine: 134 cent Spirits 9.51 euro Price elasticity
beer Normal distribution Mean: -0.35 SD: 0.17
Normal distribution Mean: -0.35 SD: 0.17
Price elasticity
wine Normal distribution Mean: -0.68 SD: 0.54
Normal distribution Mean: -0.68 SD: 0.54
Price elasticity
spirits Normal distribution Mean: -0.98 SD: 0.73 Normal distribution Mean: -0.98 SD: 0.73 Market share different types of alcohol Beer: 44% Wine: 33% Spirits: 23% Beer: 44% Wine: 33% Spirits: 23% Mean current
price of beer in € Uniform distribution 0.50-2.50 Uniform distribution 0.50-2.50
Mean current
price of wine in € Uniform distribution 5.00 – 15.00 Uniform distribution 5.00 – 15.00
Mean current price of spirits in € Uniform distribution 10.00 – 25.00 Uniform distribution 10.00 – 25.00 Costs of
intervention None None Health care costs Depends on age and
disease status 19 Depends on age and disease status 19
QALYs Depends on age and
disease status 19 Depends on age and disease status 19
2.3
Results
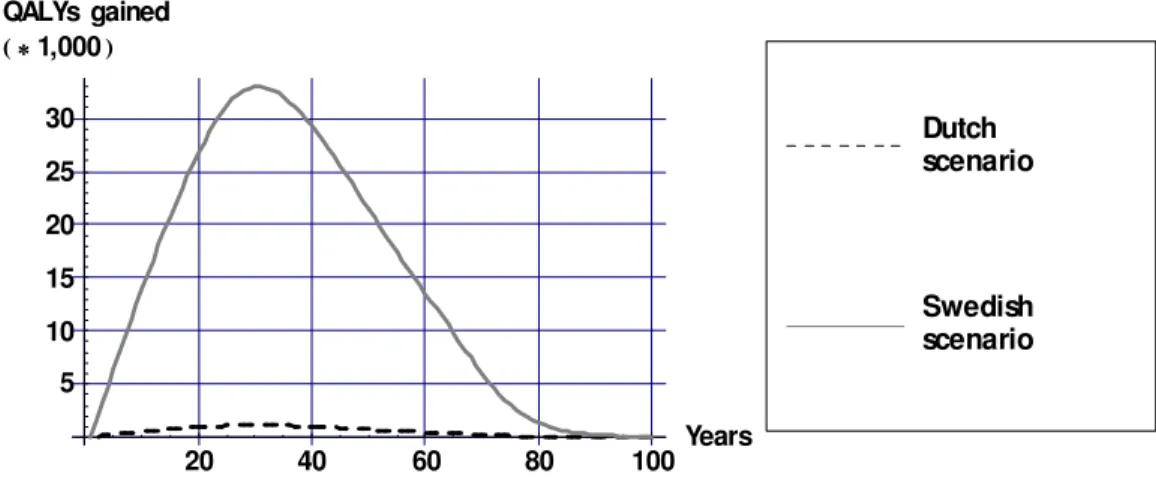
In the Dutch scenario alcohol consumption decreases on average by 0.3% and in the Swedish scenario alcohol consumption decreases on average by 18.3%. The effects on these decreases in alcohol
consumption on health are displayed in Figures 2.1, 2.2 and 2.3 for mean values of the input parameters as displayed in Table 2.1. The decrease in alcohol consumption results in a decrease in the incidence of alcohol related diseases which causes a gain in life years and QALYs compared to current practice. The largest effects occur some 30 years after the tax increase when the population that experienced the price increase becomes middle aged. The health gains approach zero as these cohorts become extinct. Figure 2.1 illustrates the large difference in health gains between the Dutch and Swedish scenario.
20 40 60 80 100Years 5 10 15 20 25 30 QALYs gained 1,000 Swedish scenario Dutch scenario
Figure 2.1: QALYs gained over time due to alcohol tax increases (undiscounted)
To zoom in on the health gains Figure 2.2 displays life years and QALYs for the Dutch scenario. Since not all life years gained are lived in full health, the amount of QALYs gained is lower than the amount of life years gained.
20 40 60 80 100Years 0.25 0.5 0.75 1 1.25 1.5 1.75 Dutch scenario Health gains 1,000 QALYs Lifeyears
Figure 2.2: Life years and QALYs gained over time due to alcohol tax increases in the Dutch scenario (undiscounted)
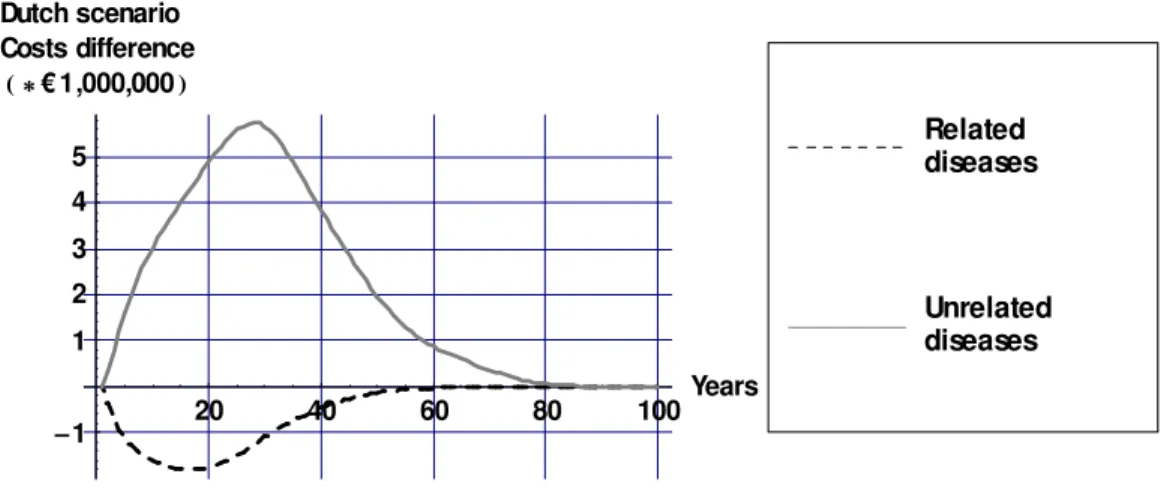
To understand the effects of alcohol tax increases on health care costs, Figure 2.3 displays differences in health care costs between the Dutch and Swedish scenario compared to the current practice scenario for mean values of the input parameters as displayed in Table 2.1. The decrease in the incidence of diseases causally related to alcohol results in a decrease in health care costs of those diseases. However, the gain in life years causes an increase in the prevalence of all diseases unrelated to alcohol. From Figure 2.3, it can be seen that the savings in health care costs of alcohol related diseases are outweighed
by increases in the health care costs of diseases not related to alcohol in life years gained. 20 40 60 80 100Years 1 1 2 3 4 5 Dutch scenario Costs difference €1,000,000 Unrelated diseases Related diseases
Figure 2.3: Costs differences over time due to alcohol tax increases in the Dutch scenario (discounted with 4%)
Figure 2.4 displays cumulative differences in costs and effects (both discounted) of the two alcohol tax scenarios compared to no tax increase over a period of 100 years for different values of the input parameters. 500 500 1000 1500 QALYs 1,000 2000 2000 4000 6000 8000 Costs in € 1,000,000 Swedisch scenario Dutch scenario
Figure 2.4: Incremental costs and effects for the two different alcohol scenarios for all values of the input parameters
Figure 2.4 illustrates the strong correlation between health gains and health care costs. This is due to the fact that the additional health care costs are solely the result of increases in life expectancy from a reduction in alcohol consumption. Thus, the more QALYs gained the more additional health care costs. The health gains in the Swedish scenario are much larger than in the Dutch scenario because the price
increases are much higher in the Swedish scenario. To zoom in on this phenomenon, Figure 2.5 displays QALYs gained as a function the relative decrease in the demand for alcohol.
10 10 20 30 40 50 % decrease alcohol demand 500 500 1000 1500 QALYs 1,000 Swedisch scenario Dutch scenario
Figure 2.5: QALYs gained plotted against relative decrease in demand for alcohol for all values of the input parameters
What can be seen from Figure 2.5 is that the marginal increase in QALYs decreases slightly for higher values of the decrease in alcohol consumption. However, costs per QALY are approximately the same in both scenarios. This is made clear from Table 2.3 which displays cumulative differences: health gains, cost differences and incremental cost effectiveness ratios.
Table 2.3: Incremental cost effectiveness ratios (ICER) and cumulative differences resulting of alcohol tax increases Life years gaineda (*1,000) QALYs gaineda (*1,000) Costs differences
(* € 1,000,000) b € per per life year gainedc € per QALY gainedc Dutch
scenario (0 / 57) 19 (0 / 39) 13 (-1 / 191) 65 3,500 5,100
Swedish
scenario (-11 / 1909) 930 (-7 / 1291) 624 (-41 / 6836) 3319 3,600 5,300
aDiscounted with 1.5% bDiscounted with 4%
cQALYs and life years gained discounted with 1.5% and costs discounted with 4%
Costs per QALY are higher than costs per life year gained in both scenarios. In the Dutch scenario the cost effectiveness ratios are approximately equal to those in the Swedish scenario. Figure 2.6 displays the Cost-Effectiveness Acceptability Curves (CEAC) for the alcohol tax increases. A CEAC displays the probability that an intervention is cost effective for different values of the threshold i.e. for different monetary values placed on a QALY
2000 4000 6000 8000 10000 Threshold € per QALY
0.2 0.4 0.6 0.8 1 P ts oc evi tc eff e dl oh ser ht Swedisch scenario Dutch scenario
Figure 2.6: Cost Effectiveness Acceptability Curves for the two different alcohol scenarios
What can be derived from Figure 2.6 is that, if QALYs are for instance valued at € 5,000, a tax increase is cost effective with a probability of 0.5. However, if society is willing to pay € 10,000 per QALY, a tax increase is cost effective with a probability of almost one.
2.4
Conclusion and discussion
Focusing on health care costs and health consequences for drinkers an alcohol tax increase is a cost effective policy instrument. From a health care perspective, costs per QALY of the planned Dutch alcohol tax increase amounted on average to € 5,100 per QALY gained and, thus, can be considered cost effective. A further alcohol tax increase, as is currently implemented in Sweden, can result in even more health gains and remain cost effective. However, additional health gains decrease for further price increases. Thus, tax increases alone are not sufficient to reduce the burden of disease caused by excessive alcohol consumption. Besides policy measures at the population level such as taxation, a more targeted approach for alcohol prevention policy is needed. Although in theory an alcohol tax increase can be implemented by legislation alone, some administrative costs and possible costs of law enforcement to keep smuggling to a minimum have to be made to successfully implement a tax increase. These costs, as well additional tax revenues, are usually carried by sectors outside the health care sector. Therefore, for an alcohol tax increase, taking the health care perspective effectively illustrated the advantages compared to interventions whose intervention costs traditionally fall inside the health sector like treatment of alcohol addiction or curative treatments in a hospital setting. Previous research investigating the cost effectiveness of a reduction of excessive alcohol consumption only took into account health effects in heavy drinkers 7 8. However, since alcohol taxes cannot be targeted at this specific group of drinkers, health effects in the entire population need to be considered. Another difference with respect to the WHO-CHOICE study is how health effects were modeled. In the WHO approach, alcohol itself was modeled with direct effect on mortality and quality of life. In our study, we modeled effects on quality of life and mortality through effects of alcohol on alcohol related diseases and all cause mortality. We focused on the dynamic effects of alcohol tax increases on health
effects in drinkers themselves and their associated health care costs. To estimate the cost effectiveness within this perspective we made the following assumptions:
• Price elasticity is the same for moderate, excessive and dangerous drinkers. If for instance
dangerous drinkers react less to price changes than moderate drinkers, health effects of tax
increases may be smaller than we estimated. However, empirical findings on this issue are lacking ;
• All tax increases were translated into price increases. We did not take into account the possibility
that producers do not pass on the tax increase to consumers, resulting in a decrease of their profit margin. However, if producers do not fully pass on the tax increase to consumers, this will only decrease health gains but not influence the cost effectiveness;
• The effects of a tax increase on the alcohol consumption will be sustained in the long run. This
assumption is built on studies that argue that, since alcohol consumption is addictive, the long-run price elasticity is significantly higher than the short-run elasticity 16;
• The price elasticity is the same for high as small price increases. This due to the fact that estimates
price elasticity’s are estimated on time series with mainly small price variations over time . Again, this assumption is probably more important for the estimation for the amount of health gains than for the estimate of the cost effectiveness ratio.
In the Comparative Quantification of Health Risks study health effects of average alcohol consumption and patterns of drinking were estimated separately20. In this study we have limited ourselves to the
effects of a tax increase on average alcohol consumption. This was done, since the CDM models average drinking and the demand elasticity estimates for alcohol refer to average alcohol drinking. Data on the influence of patterns of drinking are less available than data on overall consumption, but evidence is accumulating that patterns of drinking affect the link between alcohol and disease and mortality 20. For example, the same overall average volume of alcohol can be consumed in small quantities regularly with meals (e.g. two drinks a day with meals) or in large quantities on few
occasions (e.g. two bottles of wine on a single occasion every Friday). This also implies that we did not model the effects of a tax increase on alcohol dependence which is a disorder in itself. The simulation model we employed did not model all diseases considered to be related to be alcohol consumption separately. Some were only modeled indirectly through an elevated mortality risk. This means that we may have underestimated the impact of alcohol consumption on quality of life and health care costs and have overestimated the cost effectiveness ratio. Furthermore, the relative risks employed in the CDM are not based on the most recent meta-analyses. However, the study by Holman was the only study that included relative risk estimates for the alcohol categories employed in the CDM for both diseases and mortality 14. Moreover, recent meta-analyses of relative risks on all cause mortality also yielded similar estimates 21.
Taking the health care perspective implies that we have focused here solely on health care costs, ignoring broader costs and consequences of alcohol abuse to society. It is likely, however, that this broader societal impact will be substantial. For instance, reduced morbidity in people of working ages may improve productivity and thus result in considerable productivity gains in society. Moreover, from a societal perspective, other costs and consequences, such as those related to informal care, the damage due to violence and accidents induced by binge drinking or the reduced well-being of family members due to morbidity and premature death, need to be considered and may very well be substantial. Since the price increase is not outweighed by the decrease in consumption, this also implies that tax revenues will increase if taxes are increased. Thus, as a politically interesting side-effect, tax increases result in lower consumption and increased tax revenues at the same time. However, it should be noted that from a societal perspective, tax revenues are transfer payments which means that they do not increase production but simply that money flows from one place to the other. Therefore, in cost effectiveness analyses from a societal perspective they should be left out. However, if alcohol taxes are seen as a
health policy instrument, a portion of the additional tax revenues could be added to the health care budget. However, it can be argued that in this case (part of) the administrative and costs of law enforcement associated with tax increases should also be taken into account. However, we expect an alcohol tax increase to be even more cost-effective when a broader societal perspective is taken. This emphasizes the influence that the perspective taken in economic analyses has on the conclusions. From a welfare economic perspective, the societal perspective is the most relevant perspective, although in practice many evaluations take a more narrow perspective, which more closely conforms to the perspective most relevant to the decision maker they are trying to inform.
3.
Cost-effectiveness of depression prevention
3.1
Background
Depression ranks fourth on the burden of disease list in The Netherlands 3. Each year almost 290,000 adults ( 3 % of the adult population) develop a major depression for the first time 22. As a result, effective prevention of major depression has the potential to reduce the burden of disease considerably. Therefore, in this section the cost effectiveness of an intervention that has been proven to successfully prevent major depression is investigated 23. The intervention discussed is minimal-contact
psychotherapy (MCP) for depression which is targeted at persons with a so-called sub-threshold depression. Sub-threshold depression (sometimes also termed minor depression) is present if persons have clinical clinically relevant depressive symptoms, without meeting criteria for a full-blown major depressive disorder 24. Besides the negative effects of sub-threshold depression on quality of life 25 and health services use 26, people with sub-threshold depression have an increased risk of developing major depression compared to persons not meeting the criteria of sub-threshold depression 24. In the Dutch trial of the MCP intervention, the incidence rate of major depression was 0.12 (13/107) for the MCP condition and 0.18 (20/109) for the usual care condition, at 12 months. 23 This resulted in an incidence rate ratio of 0.66 (95% CI 0.40–1.09). Although the cost effectiveness of MCP has been investigated 27, the outcome measure was not expressed in QALYs but in avoided major depression incidence.
Furthermore, the time horizon was limited to one year and some of the costs of screening for eligible participants were not included. In this study we estimate the cost effectiveness of MCP expressed in euros per QALY from a health care perspective. To do this, the depression model presented in our previous report 28 has been extended to include sub-threshold depression.
3.2
Methods
3.2.1
Intervention and target population
The MCP intervention has been proven to be effective for persons diagnosed with sub-threshold depression. It consisted of a self-help manual with instructions on cognitive–behavioral self-help in mood management skills 23. The manual contained registration exercises and homework assignments. Before the participant started reading the manual, a brief face-to-face interview with a prevention specialist or a clinician from a community mental health centre took place. Thereafter, six short telephone calls (maximum 15 min each) were made to support the participants in working through the manual. The first five telephone calls were made once every two weeks, and the sixth call was made two months later. Costs of the manual, the interview and the telephones were all included in our analyses.
To find persons eligible for the MCP intervention, i.e. person with sub-threshold depression, people in the trial were recruited from nineteen general practices in the Netherlands 23. In this modeling study, the target population consists of all people between age 20 and 65 that visit the GP yearly, which according to Statistics Netherlands (CBS) 29, is approximately 7.2 million. First, everybody in the target population was approached by a research assistant when they were in the waiting room during a regular GP visit i.e. not specifically for depressive symptoms. People who gave informed consistent were then screened for sub-threshold depression. This first step in the recruitment cost about €5,- per person that
was screened. Then, in a second step, all screen-positive patients who were willing to participate in the trial were further screened to check whether they met all the inclusion criteria (most importantly: screening was done to make sure that people with major depression were excluded from the
intervention). This second step in the recruitment cost about €119 per person that was screened. For the persons eligible for randomization, we used a Markov model to estimate health effects and costs in case they would receive the MCP intervention or in case they would not receive the MCP intervention (care as usual).
3.2.2
Depression Markov Model
In our previous report, a Markov model was presented describing the course of major depression 28. To estimate the cost effectiveness of MCP, this model was extended to incorporate sub-threshold
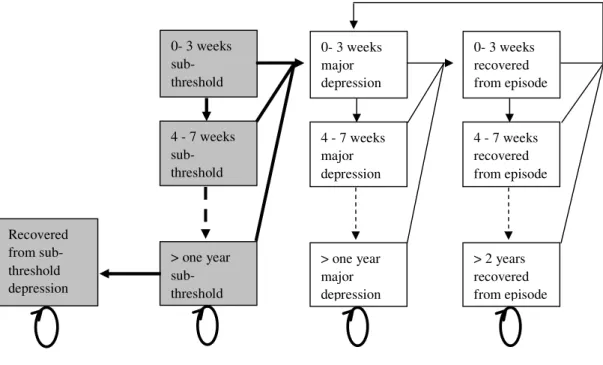
depression. Figure 3.1 displays the structure of the extended depression model.
Figure 3.1: Schematic representation of the depression Markov model including sub threshold depression
The grey shaded boxes and the thick lines and arrows indicate the addition of the sub-threshold states and new transitions in the model. The Markov model allows simulating a cohort of people diagnosed with threshold depression over time in cycles of four weeks. In every cycle, a person with sub-threshold has a probability of developing a major depression. Once a person is in a major depressive episode, every cycle this person probability to either recover or to remain depressed. Once recovered, persons have a probability to relapse into a major depression. Once in a depressed episode, the probability to recover declines as the length of the episode increases. Vice versa: once recovered, probabilities to relapse decrease as time elapses. Probabilities for persons with sub-threshold depression to develop a major depression do not depend on the time spent in state but only whether they receive an intervention or not and are derived from the MCP intervention.
0- 3 weeks sub-threshold 4 - 7 weeks sub-threshold > one year sub-threshold 0- 3 weeks major depression 4 - 7 weeks major depression > one year major depression 0- 3 weeks recovered from episode 4 - 7 weeks recovered from episode > 2 years recovered from episode Recovered from sub-threshold depression
3.2.3
Scenarios
To estimate the impact of MCP, the model as displayed in Figure 3.1 has been run repeatedly for two different scenarios:
− All persons in the target population that are screened and have sub-threshold depression receive the
MCP intervention;
− All persons in the target population that are screened and have sub-threshold depression do not
receive the MCP intervention and do not receive any care for their depressive symptoms.
In both scenarios it is assumed that if persons do develop a major depression disorder, they receive the care that is usual in the Netherlands in the GP setting that is: 80% receives anti-depressives and the other 20% do not receive care. However, in the MCP scenario it is assumed that there is no lag to treatment if persons develop major depression i.e. if persons with sub-threshold depression develop a major depression, they will contact the GP immediately in the MCP condition. Furthermore, the effects of the MCP on major depression incidence and health care utilization are assumed to last only during one year. After one year, persons with sub-threshold depression use the same amount of health services and have the same probability to develop major depression in both scenarios. Since there is no
disability weight defined for sub-threshold depression, we assumed that the quality of life of persons with sub-threshold depression lies between 1 and 1 minus the disability weight for mild depression and equals those of persons recovered from a major depressive episode. These disability weights were derived from the Dutch disability weights study 30. Furthermore, since data on recovery from sub-threshold depression were lacking, we calculated cost and effects in two different scenarios:
− All persons who did not develop a major depressive episode after one year do not recover from
sub-threshold depression and remain at risk for major depression. Incidence rates to develop major depression equal those of persons in the control group in the MCP trial;
− All persons who did not develop a major depressive episode after one year do recover from
sub-threshold depression and are not at risk for major depression anymore. It is assumed that recovery of sub-threshold depression results in a perfect quality of life and no health care use.
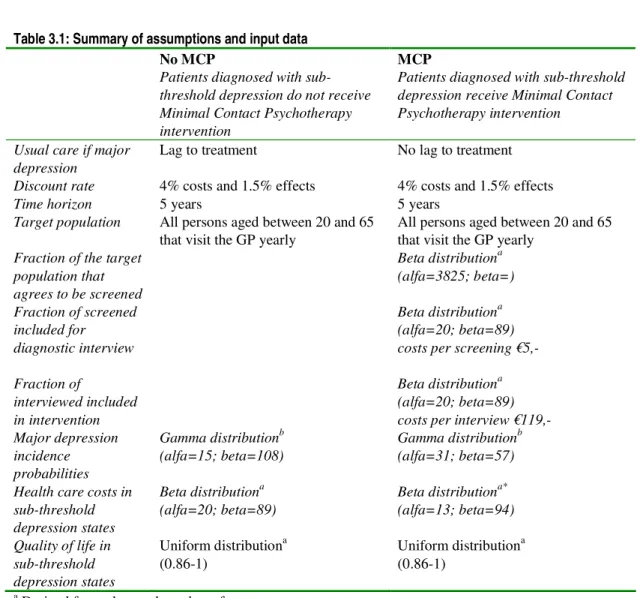
Incremental cost effectiveness ratios (ICER) were expressed in euro per QALYs gained. Costs were discounted at 4% and effects at 1.5%. Furthermore, we calculated ICERs with and without costs of the recruitment process. With Probabilistic Sensitivity Analysis (PSA), uncertainty in the input parameters was addressed and reflected in the model output (the ICER). In Table 3.1 the distributions used in the PSA as well as the values of the fixed parameters, are displayed. For the values of the parameters in the major depression model, we refer to our previous work 28.
Table 3.1: Summary of assumptions and input data No MCP
Patients diagnosed with sub-threshold depression do not receive Minimal Contact Psychotherapy intervention
MCP
Patients diagnosed with sub-threshold depression receive Minimal Contact Psychotherapy intervention
Usual care if major
depression Lag to treatment No lag to treatment Discount rate 4% costs and 1.5% effects 4% costs and 1.5% effects
Time horizon 5 years 5 years
Target population All persons aged between 20 and 65
that visit the GP yearly All persons aged between 20 and 65 that visit the GP yearly
Fraction of the target population that agrees to be screened Beta distributiona (alfa=3825; beta=) Fraction of screened included for diagnostic interview Beta distributiona (alfa=20; beta=89) costs per screening €5,- Fraction of
interviewed included in intervention
Beta distributiona (alfa=20; beta=89) costs per interview €119,-Major depression
incidence probabilities
Gamma distributionb
(alfa=15; beta=108) Gamma distribution b (alfa=31; beta=57) Health care costs in
sub-threshold depression states
Beta distributiona
(alfa=20; beta=89) Beta distribution a* (alfa=13; beta=94) Quality of life in sub-threshold depression states Uniform distributiona (0.86-1) Uniform distribution a (0.86-1)
a Derived from observed number of events b Fitted using method of moments c Used because of lack of data
* Costs include costs of the manual, the interview and the telephones.
3.3
Results
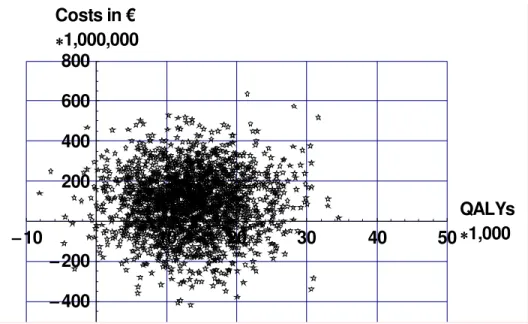
On average 296,000 persons receive the MCP intervention (roughly 4% of the target population). Figure 3.2 displays cumulative differences in costs and effects (both discounted) of MCP compared to no MCP for the target population for different values of the input parameters for over a period of five years.
10
10
20
30
40
50
QALYs
1,000
400
200
200
400
600
800
Costs in €
1,000,000
Figure 3.2: Incremental costs and effects for the target population assuming that persons with sub- threshold depression do not recover
Figure 3.2 shows that MCP can result in cost savings, additional costs, health gains and health losses. On average a person receiving MCP gains about 0.045 QALY over a period of five years at an additional cost of about € 300 resulting in an average cost effectiveness ratio of € 6,800 per QALY gained. If costs of the recruitment process were excluded, the incremental cost effectiveness ratio’ decreases to € 3,100 per QALY gained. Table 3.2 displays estimates of total incremental costs and effects of MCP in the target population. If it is assumed that all persons with sub-threshold depression who do not develop a major depression within a year fully recover, health gains increase and costs per QALY go down with approximately € 1,000.
Table 3.2: Estimates of total incremental costs and effects of MCP compared to usual care in the target population and their 95% confidence interval (between brackets)
Minimal contact psychotherapy (MCP) No recovery of
sub-threshold depression
After one year everyone recovers from
sub-threshold depression
Costs recruitment process (* € 1,000,000) b 51 (47- 55) 51 (47 – 55)
All other health care costs (* € 1,000,000) b 42 (-273 / 342) 40 (-289 / 337)
Total health care costs (* € 1,000,000) b 93 (-222 / 392) 90 (-241 /387)
QALYs (* 1,000)a 13 (2 / 26) 16 (-5 / 39 )
€ per QALY gained c 6,800 5,500
€ per QALY gainedc (excluding costs of recruitment) 3,100 2,400
aDiscounted with 1.5% bDiscounted with 4%
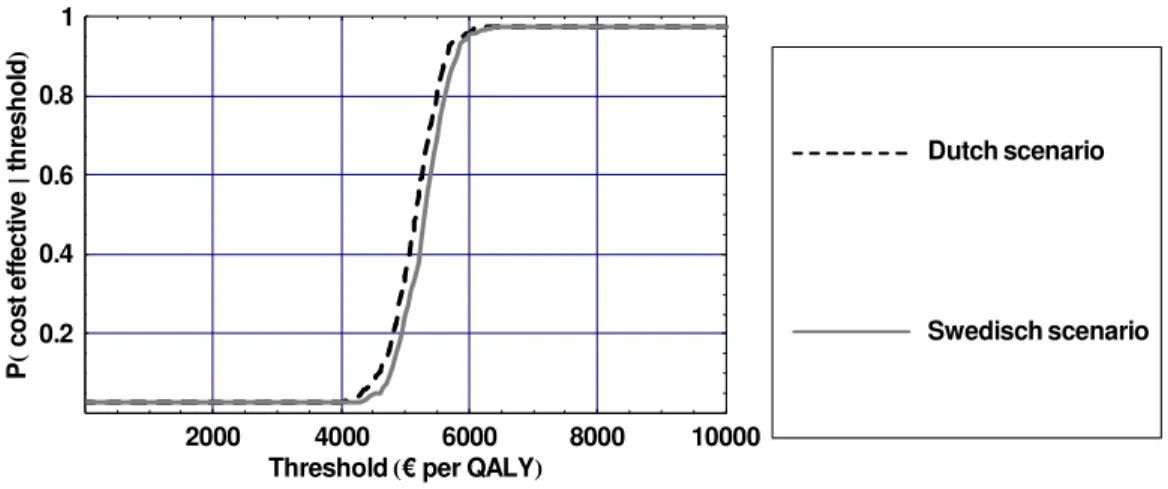
Figure 3.3 displays the Cost-Effectiveness Acceptability Curves (CEAC) for MCP. A CEAC displays the probability that an intervention is cost effective for values of the threshold i.e. monetary value placed on a QALY.
10000 20000 30000 40000 50000
Threshold € per QALY 0.2 0.4 0.6 0.8 1 P ts oc evi tc eff e dl oh ser ht MCP No MCP
Figure 3.3: Cost effectiveness acceptability curve for MCP compared to No MCP
What can be derived from Figure 3.4, is that the probability that even if QALYs are not valued at all (threshold equals) MCP is more cost effective than usual care with a probability of almost 0.3. This can be explained by the fact that in roughly 30% of the cases MCP results in cost savings. Furthermore, the probability that MCP is cost effective increases as the threshold increases. However, since in some instances there are health losses, this probability will never equal one. If we would take the threshold of € 20,000 per QALY, as often used in the Netherlands, MCP would have a probability of approximately 0.8 to be cost effective.
3.4
Conclusion and discussion
Our modeling study showed that from a health care perspective health gains can be achieved at a low cost if case finding for sub-threshold depression in combination with MCP is implemented in a GP setting. Compared to the Smit study, we demonstrated that if health gains would be expressed in QALYs, instead of depressive episodes avoided, the cost effectiveness would be favorable.
Furthermore, this analysis included the costs of initial screening of the persons that were waiting in the waiting room of the GP. We found that MCP is cost-effective, even if we take these screening costs into account. If these screening costs would be excluded, the incremental cost effectiveness ratio’ would decrease to € 3,100 per QALY gained.
As in any modeling study, we made some simplifying assumptions that deserve further research. Most importantly, we assumed that the effectiveness of the intervention would last for only one year and that persons with sub-threshold depression who do not develop a major depression within a year would remain at risk for major depression. Therefore, more research should be devoted to clinical course of threshold depression. Furthermore, we assumed that the quality of life of persons with sub-threshold depression equals those of persons recovered from major depression. Within the Burden of Disease studies, no disability weights have been developed for sub-threshold depression. It deserves
recommendation to investigate the cost effectiveness for depression targeted interventions utilizing other measurement instruments of quality of life. Moreover, although we did take into account uncertainty around a lot of model parameters, uncertainty around some crucial parameters could not be assessed. Additional uncertainty may influence both estimates of the mean cost effectiveness ratio and the decision uncertainty as displayed in the cost effectiveness acceptability curves. It therefore deserves recommendation to carry out further research with respect to the input parameters of the model. More importantly, for a good comparison of preventive and curative interventions, the distinction between major and sub-threshold depression is probably too rough and more categories should be modeled (i.e. a distinction between mild and severe major depression).
Compared to our previous report that focused on cognitive behavioral therapy for persons diagnosed with major depression approximately the same amount of total health gains can be achieved at somewhat lower costs. However, the target population that needs to be screened is very large.
Fortunately, case finding is relatively cheap since patients are already in the waiting room of the GP. The MCP intervention was based on an actual program carried out in the Netherlands, which included a control situation. In this relatively small-scale setting it was found to be a feasible type of intervention with a positive effect on incidence of major depression. Although, in principle, such a type of
intervention could be extended to include the major part of the population, the actual implementation would probably involve a major effort with a dynamics that might have unpredictable characteristics. Furthermore, costs of scaling up the MCP intervention were not included. An alternative manner to reach persons with sub-threshold depression would be the internet.
For depression, which has a high impact on health care costs, our modeling exercise revealed that even within the health care perspective ignoring several important costs outside the health care setting, prevention of major depression appears to be cost effective. However, it deserves recommendation to carry out further research into this intervention focusing on costs and consequences outside the health care sector. This, in turn, would suggest a societal perspective to be used in cost effectiveness analysis, to demonstrate the broader societal costs and benefits from tax increases. Such a broader perspective is normally advocated in economic evaluations, since it gives a complete picture of welfare changes in society associated with certain interventions.
References
1. Ezzati M, Lopez AD, Rodgers A, Vander Hoorn S, Murray CJ. Selected major risk factors and global and regional burden of disease. Lancet 2002; 360(9343):1347-60.
2. Statistics Netherlands . Statline [online database] [Web Page]. (Accessed 14 October 2003). 3. Cnossen S. Alcohol Taxation and Regulation in the European Union. 2006; CPB Discussion
Paper No 76.
4. Meijer SA, Smit F, Schoemaker CG, Cuijpers P. Gezond verstand. Evidence-based preventie van psychische stoornissen. 2006. RIVM Rapport 270672001
5. Murray CJ, Lopez AD, Wibulpolprasert S. Monitoring global health: time for new solutions. BMJ 2004; 329(7474):1096-100.
6. Clements KW, Yang W, Zheng SW. Is utility additive? The case of alcohol. Applied Economics 1997; 29(9):1163-7 .
7. Chisholm D, Doran C, Shibuya K, Rehm J. Comparative cost-effectiveness of policy instruments for reducing the global burden of alcohol, tobacco and illicit drug use. Drug Alcohol Rev 2006; 25(6):553-65.
8. Chisholm D, Rehm J, Van Ommeren M, Monteiro M. Reducing the global burden of hazardous alcohol use: a comparative cost-effectiveness analysis. J Stud Alcohol 2004; 65(6):782-93.
9. Hoogenveen RT , de Hollander AEM, van Genugten MLL. The chronic disease modelling approach. 1998; RIVM Rapport 266750001.
10. Bemelmans W, van Baal P, Wendel-Vos W et al. The costs, effects and cost-effectiveness of counteracting overweight on a population level. A scientific base for policy targets for the Dutch national plan for action. Prev Med 2007.
11. van Baal PH, Brouwer WB, Hoogenveen RT, Feenstra TL. Increasing tobacco taxes: a cheap tool to increase public health. Health Policy 2007; 82(2):142-52.
12. Struijs JN, van Genugten ML, Evers SM, Ament AJ, Baan CA, van den Bos GA. Modeling the future burden of stroke in The Netherlands: impact of aging, smoking, and hypertension. Stroke 2005; 36(8):1648-55.
13. Feenstra TL, van Baal PHM, Hoogenveen RT, Vijgen SMC, Stolk E, Bemelmans WJE. Cost-effectiveness of interventions to reduce tobacco smoking in the Netherlands. An application of the RIVM Chronic Disease Model . 2006; RIVM Rapport 260601003. 14. Holman CD, English DR, Milne E, Winter MG. Meta-analysis of alcohol and all-cause
15. van Baal PH, Hoogenveen RT, de Wit GA, Boshuizen HC. Estimating health-adjusted life expectancy conditional on risk factors: results for smoking and obesity. Popul Health Metr 2006; 4:14.
16. Culyer AJ, Newhouse JP. Handbook of Health Economics. Elsevier.2000 17. WHO. Health for All database [Web Page]. (Accessed 2007).
18. CVZ. Richtlijnen voor farmaco-economisch onderzoek: evaluatie en actualisatie. Amstelveen: College Voor Zorgverzekeringen 2005.
19. van Baal PHM , Feenstra TL, Hoogenveen RT, de Wit GA, Brouwer W.B.F. Unrelated medical care in life years gained an the cost utility of primary prevention: In search of a 'perfect' cost utility ratio. Health Econ In press.
20. Ezzati M, Lopez AD, Rodgers A, Murray CJ. Comparative Quantification of Health Risks: Global and Regional Burden of Disease Attributable to Selected Major Risk Factors. Geneva: WHO.
21. Di Castelnuovo A, Costanzo S, Bagnardi V, Donati MB, Iacoviello L, de Gaetano G. Alcohol dosing and total mortality in men and women: an updated meta-analysis of 34 prospective studies. Arch Intern Med 2006; 166(22):2437-45.
22. RIVM. The National Public Health Compass. 2005.
23. Willemse GR, Smit F, Cuijpers P, Tiemens BG. Minimal-contact psychotherapy for sub-threshold depression in primary care. Randomised trial. Br J Psychiatry 2004; 185:416-21.
24. Cuijpers P, Smit F. Subthreshold depression as a risk indicator for major depressive disorder: a systematic review of prospective studies. Acta Psychiatr Scand 2004; 109(5):325-31. 25. Wells KB, Burnam MA, Rogers W, Hays R, Camp P. The course of depression in adult
outpatients. Results from the Medical Outcomes Study. Arch Gen Psychiatry 1992; 49(10):788-94.
26. Cuijpers P, Smit F, Oostenbrink J, de Graaf R, Ten Have M, Beekman A. Economic costs of minor depression: a population-based study. Acta Psychiatr Scand 2007; 115(3):229-36. 27. Smit F, Willemse G, Koopmanschap M, Onrust S, Cuijpers P, Beekman A. Cost-effectiveness of preventing depression in primary care patients: randomised trial. Br J Psychiatry 2006; 188:330-6.
28. de Wit GA, Verweij A, van Baal PHM et al. Economic evaluation of prevention: further evidence . 2006; RIVM Rapport 270091004 .
29. CBS Statline . Gerapporteerde gezondheid en leefstijl. 2003.
30. Stouthard MEA, Essink-Bot ML, Bonsel GJ et al. Disability Weights for Diseases in The Netherlands. Department of Public Health. Erasmus University Rotterdam 1997.
RIVM
National Institute for Public Health and the Environment P.O. Box 1
3720 BA Bilthoven the Netherlands www.rivm.com
Economic evaluation of prevention
Modelling the cost-effectiveness of increasing alcohol
taxes and of prevention of major depression
Report 270091006/2008 P.H.M. van Baal et al.