Probabilistic assessment factors for human health risk assessment - A practical guide | RIVM
29
0
0
Hele tekst
(2) RIVM report 601516 005. page 2 of 29. Abstract This practical guide was written for the application of probabilistic distributions of default assessment factors in human health risk assessments. RIVM, the National Institute of Public Health and the Environment and TNO, the Netherlands Organisation for Applied Scientific Research developed the use of probabilistic assessment factors as a first step towards further national and international harmonisation. Consensus was reached on the nature of distributions of several human assessment factors. The proposed distributions will be applied in risk assessments of new and existing substances and pesticides prepared at RIVM and TNO. A format for this type of probabilistic risk assessment is also presented in this document..
(3) RIVM report 601516 005. page 3 of 29. Samenvatting Dit rapport is een praktische gids voor de toepassing van probabilistische verdelingen van default assessment factoren in de risicobeoordeling van stoffen voor de mens. In de standaard procedure voor de afleiding van Humane Limietwaarden (HLVs), zoals de ‘Acceptable Daily Intake’ (ADI), wordt de ‘No-Observed-Adverse-Effect Level’ (NOAEL) uit dierstudies of humane gegevens gedeeld door een aantal assessment factoren. Deze factoren beogen de onzekerheid aan te geven in de extrapolatie van proefdier naar mens. Deze onzekerheid betreft met name inter- en intraspecies verschillen en verschillen in blootstellingduur. Indien stofspecifieke gegevens in onvoldoende mate beschikbaar zijn, worden default waarden toegepast. Hoewel deze afleiding van HLVs als conservatief beschouwd wordt, ontbreekt veelal een wetenschappelijke rechtvaardiging voor de gekozen defaultwaarden. In dit rapport wordt uitgegaan van onzekerheid in zowel de kritische effectdoseringen als de assessmentfactoren. Deze parameters kunnen daarom worden beschreven door lognormale verdelingen. Dit concept is door RIVM en TNO geoperationaliseerd. Besloten is om de toepassing van probabilistische verdelingen van assessment factoren verder te ontwikkelen. Dit is een eerste stap op weg naar nationale en internationale harmonisatie. RIVM en TNO zijn het eens geworden over de aard van de verdelingen van de volgende humane assessment factoren: de interspecies factor voor de extrapolatie van proefdier naar de gemiddelde mens, de intraspecies factor voor de extrapolatie van de gemiddelde mens (van de algemene bevolking en van de populatie werknemers) naar de gevoelige mens en de factor voor de extrapolatie van een studie met een kortere duur naar een studie van langere duur. Ofschoon verfijning en verbetering van deze verdelingen moeten doorgaan, worden de gepresenteerde verdelingen, voor dit moment, als voldoende onderbouwd beschouwd voor toepassing in risicobeoordelingen. De voorgestelde verdelingen zullen toegepast gaan worden in de RIVM- en TNO-risicobeoordelingen van nieuwe en bestaande stoffen en bestrijdingsmiddelen. De gecombineerde probabilistische assessment factor zal gebruikt worden voor: 1. De interpretatie van de ‘Margin Of Safety’ (MOS). De MOS is de marge tussen de NOAEL of LOAEL en de verwachte humane blootstelling. The MOS wordt bijvoorbeeld afgeleid in de EU risicobeoordelingen voor nieuwe en bestaande stoffen. 2. De vergelijking met de gecombineerde assessment factor zoals toegepast in de huidige, algemeen geaccepteerde werkwijze, bijvoorbeeld in de afleiding van een ADI voor bestrijdingsmiddelen. Deze analyse zal in een aparte bijlage van de risicobeoordelingen van RIVM en TNO worden opgenomen. Dit rapport bevat een voorbeeld van een dergelijke probabilistische risicobeoordeling..
(4) RIVM report 601516 005. page 4 of 29. Summary This practical guide was written for the application of probabilistic distributions of default assessment factors in human health risk assessments In the standard procedure for deriving Human Limit Values (HLVs) such as the Acceptable Daily Intake (ADI) from animal study data or human data, the No-Observed-Adverse-Effect Level (NOAEL) or Lowest-Observed-Adverse-Effect Level (LOAEL) is divided by a number of assessment factors. The assessment factors are meant to account for uncertainties in extrapolating from experimental data with laboratory animals or epidemiological data to the sensitive human being. These uncertainties pertain to inter- and intraspecies differences, differences in exposure time scale and others. In the absence of many substance-specific data, default assessment factors are applied. Though the derivation of the HLV is considered conservative, a scientific justification for the size of these defaults is often lacking. In this report the uncertainty in both the critical effect doses and the assessment factors is acknowledged. These parameters can best be described by lognormal distributions. This concept was further operationalised by RIVM and TNO and it was decided to develop the use of probabilistic assessment factors as a first step towards further national and international harmonisation. RIVM and TNO reached consensus on the nature of the distribution of several human assessment factors: the interspecies factor for the extrapolation from the experimental animal to the average human being, the intraspecies factor for the extrapolation from the average human being (from the general population and from the population of workers) to the sensitive human being and the exposure duration factor for the extrapolation from an experimental study of short duration to an experimental study of longer duration. Although further refinement and improvement of these distributions are continuous activities, the distributions presented are, as yet, considered sufficiently solid for application in risk assessment. The proposed distributions will be applied in risk assessments of new and existing substances and pesticides, produced at RIVM and TNO. The overall probabilistic assessment factor derived will be used for: 1. The interpretation of the Margin Of Safety (MOS). The MOS is the margin between the NOAEL or LOAEL and the expected human exposure. The MOS is, for instance, derived in the EU risk assessments for new and existing substances. 2. The comparison to the overall assessment factor as derived according to currently accepted methods. An overall assessment factor is used explicitly in the derivation of an ADI for pesticides. This analysis will be performed in a separate Annex to the risk assessments produced by RIVM and TNO. A format for this type of probabilistic risk assessment is presented in this report..
(5) RIVM report 601516 005. page 5 of 29. Contents Samenvatting. 3. Summary. 4. 1.. Introduction and problem formulation. 6. 2.. Probabilistic distributions of assessment factors. 8. 2.1 The interspecies factor 2.1.1 Interspecies1 2.1.2 Interspecies2. 8 8 8. 2.2 The intraspecies factor 2.2.1 General Population 2.2.2 Workers. 9 9 11. 2.3 The exposure duration factor 2.3.1 Semi-chronic to chronic exposure duration factor 2.3.2 Subacute to chronic exposure duration factor 2.3.3 Subacute to semi-chronic exposure duration factor. 11 11 12 12. 2.4. Combining of factors. 12. 2.5. Limitations. 13. 3.. Conclusions and RIVM/TNO strategy. 14. 4.. Example. 16. References. 19. Annexes. 21 21. Annex I : Formulae Annex IIa : Model for the risk assessment of new and existing substances on the basis of probabilistic assessment factors Annex IIb : Model for the risk assessment of pesticides on the basis of probabilistic assessment factors. 22 25.
(6) RIVM report 601516 005. 1.. page 6 of 29. Introduction and problem formulation. In the standard procedure for deriving Human Limit Values (HLVs), such as the Acceptable Daily Intake (ADI), Tolerable Daily Intake (TDI), Reference Dose (RfD), or Health-Based Occupational Reference Value (HBORV) from animal study data or human data, the NOAEL is divided by a number of assessment factors according to the following equation: ADI , TDI , RfD =. NOAEL AF1 . AF2 . AF3 ....... The NOAEL (No-Observed-Adverse-Effect Level) is defined as the highest concentration or amount of a substance, found by experiment or observation, which causes no detectable adverse alteration of morphology, functional capacity, growth, development, or life span of the target organisms under defined conditions of exposure. The assessment factors (AFs) are meant to account for uncertainties in extrapolating from experimental data with laboratory animals or epidemiological data to the sensitive human being. These uncertainties pertain to inter- and intraspecies differences, differences in exposure time scale and others. In the absence of many substance-specific data, default assessment factors are applied. A scientific justification for the size of these defaults is often lacking. However, the choice of such factors should be explained as transparently as possible. The assessment factors are assumed to be independent from each other. Because of the multiplication, the standard method for deriving HLVs is generally considered to be conservative. Indeed, when each individual assessment factor by itself is regarded to reflect a worst case situation, their product, i.e. the overall assessment factor, will tend to be overly conservative. However, the degree of conservatism in the HLV in any particular assessment is unknown. In addition, the uncertainty in the numerator, the NOAEL as an estimate of the "true" NoAdverse-Effect Level (NAELtrue) in the animal is completely ignored. Depending on the study design, the NOAEL might be a poor estimate for this true (but unknown) dose below which the substance does not evoke any adverse effects. The potential deviation of the NOAEL from the NAELtrue cannot be quantified. The latter uncertainty may be substantial and ignoring it may introduce an anti-conservative element in the derivation of HLVs (Slob and Pieters, 1998). Slob and Pieters (1998) proposed a conceptual framework in which it is acknowledged that both the effect parameter and the assessment factors are uncertain and can best be described by lognormal distributions. The effect parameter would be a Critical Effect Dose (Benchmark Dose) derived from the dose-response data by regression analysis. This Critical Effect Dose is defined as the dose at which the average animal shows the (postulated) Critical Effect Size for a particular endpoint, below which there is no reason for concern. The distribution of the Critical Effect Dose can probabilistically be combined with distributions of assessment factors. This concept was further operationalised by RIVM and TNO (Vermeire et al., 1999). Distributions for default assessment factors for a wide range of substances can be approached by distributions of NOAEL-ratios derived from comprehensive toxicological databases. This report will concentrate on the quantification of default distributions of the following human assessment factors:.
(7) RIVM report 601516 005. • • •. page 7 of 29. Interspecies factor for the extrapolation from the average experimental animal to the average human being; Intraspecies factor for the extrapolation from the average human being to the sensitive human being. Since this factor may depend on the population concerned, we will discuss factors for ‘the general population’ and for ‘workers’. Exposure duration factor for the extrapolation from an experimental study of short duration to an experimental study of longer duration (semi-chronic to chronic, subacute to chronic, subacute to semi-chronic).. Based on the distributions selected, choices will be made for their application in day-to-day risk assessment of, at first, new and existing substances, and pesticides. The individual distributions of default assessment factors will be combined to a distribution for the overall default factor. This distribution of the overall default assessment factor will be used for: 3. The interpretation of the Margin Of Safety (MOS). The MOS is the margin between the NOAEL as derived from experimental or human studies and the expected human exposure. The MOS is, for instance, derived in the EU risk assessments for new and existing substances. 4. The comparison to the overall assessment factor as derived according to currently accepted methods. An overall assessment factor is used explicitly in the derivation of an ADI for pesticides..
(8) RIVM report 601516 005. page 8 of 29. 2.. Probabilistic distributions of assessment factors. 2.1. The interspecies factor. The interspecies factor is composed of two subfactors: 1. A default factor (Interspecies1) accounting for systemic differences between species caused by differences in body size and related differences in basal metabolic rate. 2. A default distribution (Interspecies2) accounting for variability in specific toxicokinetics and toxicodynamics.. 2.1.1. Interspecies1. Allometric scaling based on caloric demands is recommended to account for systemic differences between species after oral and dermal exposure (Hakkert et al., 1996; Health Council, 1985; Kalberlah et al., 1998; Vermeire, 1999). Allometric scaling based on caloric demands is performed by assuming that doses scale with body weight to the power 0.75. This means that the laboratory animal dose rate (mg dose/ kg body weight) should be divided by an interspecies factor which is equal to (70/body weight animal in kg)0.25. In this way the dose rate for the average person (70 kg), expressed as mg dose/ kg body weight is obtained. An overview of the scaling factors for different laboratory species is presented in 2.4 (Combination of factors, Table 8). Please note: • In the case of inhalatory exposure (in mg.m-3) and dietary exposure (in mg.kgfood) the scaling factor equals unity (1) since ventilation rate and food intake can be assumed to scale with the basal metabolic rate. Therefore, in the conversion from the exposure metric of rats (mg.m-3 or mg.kgfeed-1) to the same exposure metric of humans the difference in metabolic rate is already accounted for. • If the HLV is derived from a diet study by recalculating the concentration in feed to a animal daily dose in mg.kgbw-1.d-1, the extrapolation should incorporate a correction for basal metabolic rate. • Allometric scaling should not be applied if the effects are independent of metabolic rate, e.g. in the case of local effects.. 2.1.2. Interspecies2. To account for the variability in toxicokinetics and toxicodynamics a default distribution is used. Ideally the default distribution should be based on a comparison of toxicity data in experimental animals and toxicity data in humans. Since data in humans are not available, a surrogate distribution based on historical analyses of 63 rat-dog NOAEL-ratios, 67 mouse-rat NOAEL ratios and 40 mouse-dog NOAEL ratios is proposed (Vermeire et al., 1999). Prior to analysis the NOAELs were adjusted by allometric scaling. Each interspecies comparison of NOAELs (rat vs. dog, mouse vs. rat and mouse vs. dog) resulted in a distribution with a geometric mean (GM) around unity. This agrees with the fundamental biological assumption that species are, on average, equally sensitive. Deviations for the mean are caused by differences in sensitivity towards individual substances as a consequence of specific kinetics and dynamics. For oral exposure, a default lognormal distribution with a GM of 1 and/or a.
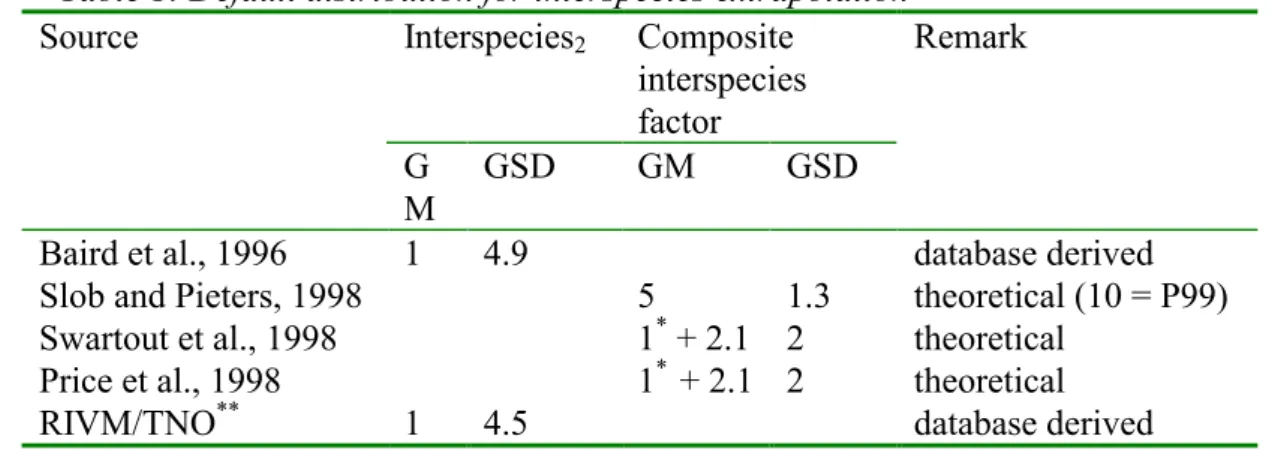
(9) RIVM report 601516 005. page 9 of 29. geometric standard deviation (GSD) of 6 has been proposed for interspecies2 (Vermeire et al., 1999). Based on reanalysis and an extension of this database (Rennen et al., 1999) it was concluded that the GSD could be lowered to 4.5. It was also noted that the geometric mean of the available mouse-rat ratios differed statistically significantly from one. However, a GM of 1 seems at present to be most plausible. Limited inhalatory data available suggest that this distribution may also be applied in the case of inhalatory exposure (Rennen et al., 1999). In the literature other interspecies distributions have been proposed (Table 1). Baird et al. (1998) proposed a distribution of interspecies2 based on an analysis which is comparable to the one above (GM=1). Price et al. (1998), Swartout et al. (1998) and Slob and Pieters (1998) proposed theoretical distributions of the composite interspecies factor considered to be consistent with the current use of the factor 10. They assumed this factor 10 to be conservative. Table 1: Default distribution for interspecies extrapolation Source Interspecies2 Composite Remark interspecies factor G GSD GM GSD M Baird et al., 1996 1 4.9 database derived 5 Slob and Pieters, 1998 1.3 theoretical (10 = P99) Swartout et al., 1998 1* + 2.1 2 theoretical * Price et al., 1998 1 + 2.1 2 theoretical RIVM/TNO** 1 4.5 database derived * The whole distribution is increased by one (shifted to the right) by these authors, as they believe that the interspecies factor should not be smaller than unity ** Based on Vermeire et al. (1999) and Rennen et al. (1999). 2.2. The intraspecies factor. 2.2.1. General Population. Intraspecies variation between humans is due to a number of biological factors, such as age, sex, genetic composition and nutritional status. For decades a default factor of 10 for the extrapolation from the average to the sensitive human being has been used to derive human limit values (HLV). Calabrese (1985) who argued that a factor of 10 would be sufficient to protect the majority (up to 80-95%) of the human population against adverse health effects supported the default factor of 10. A few attempts have been made to investigate the human interindividual variation by data analysis. Hattis et al. (1987) investigated the total variation in pharmacokinetic behaviour of 49 pharmaceuticals in healthy adults and concluded that a tenfold difference in the pharmacokinetic parameters would correspond to 2.5-9 standard deviations in populations of normal healthy adults. Reanalysis of the data of Hattis et al. showed that for the plasma half-life time the variation between individuals was quite small. Defining the intraspecies factor as the ratio of the P50 and P05 resulted in a factor of 1.4 (Schaddelee, 1997)..
(10) RIVM report 601516 005. page 10 of 29. Although from the above analysis it appears that a factor of 10 will be sufficient for pharmacokinetic variation, the real median to sensitive human variability is underestimated, since one should take into account that (i) variation also exist in pharmacodynamics and (ii) that only data from healthy volunteers were available. Renwick (1993a,b) analysed interindividual differences of healthy volunteers and patients by comparing the maximum and mean values of pharmacokinetic parameters and the minimum and mean values of pharmacodynamic parameters. Based on this analysis he proposed to subdivide the factor of 10 into a factor of 4 for pharmacokinetic differences and a factor of 2.5 for pharmacodynamic differences. Re-analysis of the Renwick data by using distributions instead of ratios max/mean and min/mean gave comparable results (Schaddelee, 1997). The results of Renwick’s analysis have been adopted by the IPCS (IPCS, 1994). Based on an analysis of the available human data, Kalberlah et al. (1997) proposed an intraspecies factor of 25 for the general population, composed of a factor of 8 accounting for toxicokinetic variation and enzyme polymorphism’s, and a factor of 3 accounting for toxicodynamic variation. For workers they considered a total factor of 5 to account for both inter and intraspecies variation (after adjustment for differences in metabolic size). However, the combined factor for workers accounting for both inter and intraspecies variation was not adequately explained. Several probabilistic distributions have been proposed (Table 2). Baird et al. (1996) proposed a distribution on the basis of acute toxicity data on heterogeneity in rats and on the basis of assumptions on the unknown difference in heterogeneity between rats and humans (GM = 2.7 and GSD = 2.3 with rats and humans equally heterogeneous and GM = 5.3 and GSD = 2.1 with humans 1.5 more heterogeneous than rats). This approach is considered invalid: heterogeneity in inbred rat strains is considered not relevant for humans and the quantal response a poor and crude measure. Price et al. (1997), Swartout et al., (1998) and Slob and Pieters (1998) proposed distributions considered to be consistent with the current use of the default factor of 10. They assumed this factor 10 to be conservative. It is concluded that currently no adequate proposal for a database-derived distribution of the intraspecies factor can be made. Therefore, for the time being, a distribution consistent with the default value of 10 as proposed by Slob and Pieters (1998) will be used. Table 2: Default distribution for intraspecies extrapolation for the general population Source GM GSD Remark * Slob and Pieters, 1998 1 + 3 1.6 theoretical Baird et al., 1996 2.7 2.3 database derived** Swartout et al., 1998 1* + 2.1 2 theoretical Price et al., 1998 1* + 2.1 2 theoretical *** * RIVM/TNO 1 +3 1.6 theoretical *. The whole distribution is increased by one (shifted to the right) since by definition the intraspecies factor cannot be smaller than unity ** Assumes equal heterogeneity in rats and humans *** Based on Slob and Pieters (1998).
(11) RIVM report 601516 005. 2.2.2. page 11 of 29. Workers. No adequate proposal for a database-derived distribution of the intraspecies factor can be made for workers. Therefore, for the time being, a distribution consistent with the default value for workers of 3 - considered to be conservative - is proposed in parallel with the approach of Slob and Pieters (1998). This distribution is characterised by a GM of 1+1.4 and a GSD of 1.2, resulting in a P1 of 1 and a P99 of 3 (Table 3). Table 3: Default distribution for intraspecies extrapolationfor workers Source GM GSD Remark * RIVM/TNO 1 + 1.4 1.2 theoretical * The whole distribution is increased by one (shifted to the right) since by definition the intraspecies factor cannot be smaller than unity. 2.3. The exposure duration factor. In general, the proposed distributions of the exposure duration factors are based on historical analyses of ratios of oral NOAELs (e.g. the ratio of a semi-chronic NOAELrat and the chronic NOAELrat). It is assumed that although the distributions are derived from oral data, they can also be applied to systemic effects caused by inhalatory or dermal exposure, after estimation of the systemic dose.. 2.3.1. Semi-chronic to chronic exposure duration factor. Based on a review of published data sets with 9-149 pairs of NOAELs, a default lognormal distribution with a GM of 2 and a GSD of 4 has been proposed (Vermeire et al., 1999). Taking into account another, detailed study with 70 pairs of NOAELs (Groeneveld et al., 1998), the GSD is adjusted to 3.5, the GM remaining 2. Other distributions have been proposed. Baird et al. (1996) proposed a distribution based on two pooled data sets of both oral and inhalation studies (GM = 2.1 and GSD = 2.1). Swartout et al. (1998), Price et al., (1998) and Slob and Pieters (1998) assumed distributions considered to be consistent with the current use of the default factor of 10 (Table 4). They assumed this factor 10 to be conservative. Table 4: Default distributions for the semi-chronic to chronic exposure duration factor Source GM GSD Remark Baird et al., 1996 2 2.1 database derived Slob and Pieters, 1998 1.5 2.3 database/theoretical (P99) * Swartout et al., 1998 1 + 2.1 2 theoretical 1* + 2.1 2 Price et al., 1998 theoretical ** RIVM/TNO 2 3.5 database derived * The whole distribution is increased by one (shifted to the right) by these authors as they believe that the exposure duration factor should not be smaller than unity ** Based on Vermeire et al. (1999) and Groeneveld et al. (1998).
(12) RIVM report 601516 005. 2.3.2. page 12 of 29. Subacute to chronic exposure duration factor. Vermeire et al. (1999) concluded to a default lognormal distribution with a GM of 4 and a GSD of 4 from a modest number of 3 data sets with 20-71 pairs of NOAELs each. Based on yet another, detailed study with 35 pairs of NOAELs (Groeneveld et al., 1998), it was concluded to adjust the GM to 5 and the GSD to 3.5 (Table 5). No other distributions have been proposed in the scientific literature. Table 5: Default distribution for the subacute to chronic exposure duration factor Source GM GSD Remark * RIVM/TNO 5 3.5 database derived * Based on Vermeire et al. (1999) and Groeneveld et al. (1998). 2.3.3. Subacute to semi-chronic exposure duration factor. This factor is applied in occupational risk assessments. Vermeire et al. (1999) concluded to a default lognormal distribution with a GM of 2 and a GSD of 4 from one study with a data set of 35 pairs of NOAELs (Groeneveld et al., 1998). No other distributions have been proposed in the scientific literature. Table 6: Default distribution for the subacute to semi-chronic exposure duration factor Source GM GSD Remark * RIVM/TNO 2 4 theoretical * Based on Vermeire et al. (1999) and Groeneveld et al. (1998). 2.4. Combining of factors. In the standard procedure for deriving HLVs, various assessment factors are multiplied to obtain an overall assessment factor. However, multiplication of assessment factors implies a piling up of worst case assumptions: the probability of simultaneous occurrence of worst case situations for the same chemical will be smaller than that of a single worst case situation to occur. Therefore, the more extrapolation steps are taken into account, the higher the level of conservatism. The piling-up of worst-case assumptions can be avoided by using probability distributions. In this method each assessment factor is considered uncertain and characterised as a random variable with a distribution. Propagation of the uncertainty can be evaluated using Monte Carlo simulation yielding a distribution of the overall assessment factor. This method requires characterisation of the distribution of each assessment factor (see previous chapters). As a first approach it is assumed that all factors are independent. Combining the distributions as proposed for the individual assessment factors using Monte Carlo simulation yields the following lognormal overall distributions:.
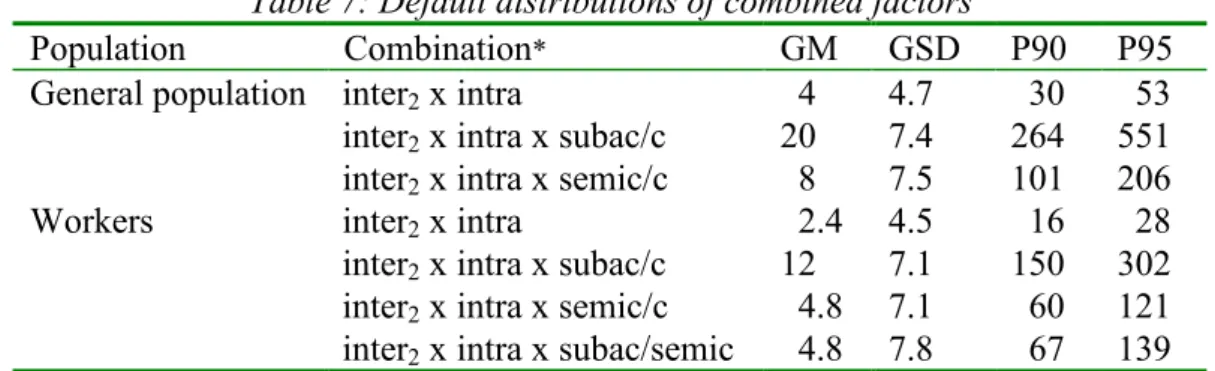
(13) RIVM report 601516 005. Table 7: Default distributions of combined factors Population Combination* GM GSD General population inter2 x intra 4 4.7 inter2 x intra x subac/c 20 7.4 inter2 x intra x semic/c 8 7.5 Workers inter2 x intra 2.4 4.5 inter2 x intra x subac/c 12 7.1 inter2 x intra x semic/c 4.8 7.1 inter2 x intra x subac/semic 4.8 7.8. page 13 of 29. P90 30 264 101 16 150 60 67. P95 53 551 206 28 302 121 139. * inter2 = interspecies2; intra = intraspecies; subac = subacute; semic = semi-chronic; c = chronic. Please note that these distributions have not yet been multiplied with the allometric scaling factor Interspecies1 (Table 8), which is species dependent. Table 8: Scaling factor (Interspecies1) based on caloric demands (i.e. BW0.75) Species Body weight (kg) Interspecies1* mouse 0.025 7.3 rat 0.100 5.1 rat 0.250 4.1 guinea pig 0.750 3.1 rabbit 2 2.4 monkey 5 1.9 dog 15 1.5 * Calculated according to the formula: (70/body weight animal in kg)0.25. The final combination of the assessment factors for the different species is presented in 3 (Conclusion and RIVM/TNO strategy).. 2.5. Limitations. It should be recognised that all distributions proposed are based on analyses of historical data, i.e. NOAEL ratios. The use of these data has the following shortcomings: 1. The criteria used by constructing databases are not always transparent and NOAEL-ratios may have been assessed without knowing the quality of the underlying data. 2. The uncertainty in the NOAEL as an estimate of the NAEL is unknown. If ratios of NAELs would have been used, the distributions would have been less wide (i.e. smaller GSD). 3. Although the proposed default distributions are considered sufficiently founded to justify their application in human risk assessment, further research on the basis of larger databases is still considered necessary, especially with regard to the intraspecies distribution. 4. In the derivation of an interspecies assessment factor from NOAEL-ratios, it is assumed that variability between laboratory animals represents animal-human variability..
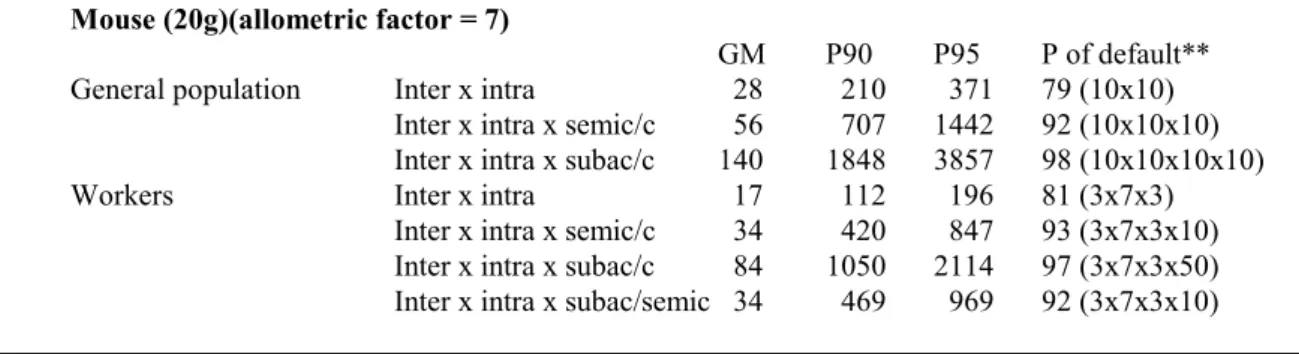
(14) RIVM report 601516 005. 3.. page 14 of 29. Conclusions and RIVM/TNO strategy. The present human risk characterisation for new and existing substances is based on a comparison between an estimated or measured human exposure value and the NOAEL or LOAEL, resulting in a Margin Of Safety. This MOS needs interpretation on the basis of assessment factors. Alternatively, for pesticides the human exposure value is compared to the HLV, in this case the ADI, derived from the NOAEL (LOAEL) using assessment factors. Slob and Pieters (1998) proposed a conceptual framework in which it is acknowledged that both the effect parameter and the assessment factors are uncertain and can best be described by lognormal distributions. This concept was further operationalised by RIVM and TNO and it was decided to develop the use of probabilistic assessment factors as a first step towards further national and international harmonisation (Vermeire et al., 1999). RIVM and TNO decided on the nature of the distribution of several assessment factors. To facilitate international consensus on the assessment factors and probabilistic risk assessment methodology, the proposed distributions will be applied in risk assessments produced at RIVM or TNO. The overall probabilistic assessment factor derived will be compared to the assessment factors currently used in the interpretation of the MOS and in the derivation of an HLV. This analysis will be performed in a separate Annex to the risk assessments produced in the RIVM and TNO Institutes. A format of the risk assessment to be published in an Annex is presented in Annex 2 of this fact sheet. The default distributions for each species can be derived from the distributions in Table 7 and the allometric scaling factors in Table 8. Table 9 summarises the results of these calculations. If, besides the allometric scaling factor, additional point estimates are involved, e.g. a factor for the quality of the database, the numbers in columns 3, 4, and 5 should be multiplied accordingly and the numbers in the last column should be estimated using the formulae in Annex I. It should be noted that for new chemical substances and existing substances the maximum default value has been set at 1000. In the calculations below this deviation has not been taken into account. Table 9: Default distributions of the overall assessment factors for the general population and for workers* Mouse (20g)(allometric factor = 7) General population Workers. GM Inter x intra 28 Inter x intra x semic/c 56 Inter x intra x subac/c 140 Inter x intra 17 Inter x intra x semic/c 34 Inter x intra x subac/c 84 Inter x intra x subac/semic 34. P90 210 707 1848 112 420 1050 469. P95 371 1442 3857 196 847 2114 969. P of default** 79 (10x10) 92 (10x10x10) 98 (10x10x10x10) 81 (3x7x3) 93 (3x7x3x10) 97 (3x7x3x50) 92 (3x7x3x10).
(15) RIVM report 601516 005. page 15 of 29. Table 9 (continued) Rat (250 g) (allometric factor = 4) General population Workers. GM Inter x intra: 16 Inter x intra x semic/c 32 Inter x intra x subac/c 80 Inter x intra 10 Inter x intra x semic/c 19 Inter x intra x subac/c 48 Inter x intra x subac/semic 19. P90 120 404 1056 64 240 600 268. P95 212 824 2204 112 484 1208 556. P of default** 88 (10x10) 99 (10x10x10) 99 (10x10x10x10) 80 (3x4x3) 93 (3x4x3x10) 95 (3x4x3x50) 92 (3x4x3x10). P90 90 303 792 48 180 450 201. P95 159 618 1653 84 363 906 417. P of default** 92 (10x10) 97 (10x10x10) 99 (10x10x10x10) 81 (3x3x3) 94 (3x3x3x10) 95 (3x3x3x50) 92 (3x3x3x10). P90 72 242 634 38 144 360 161. P95 127 494 1322 67 290 725 334. P of default** 93 (10x10) 98 (10x10x10) 99 (10x10x10x10) 80 (3x2.4x3) 94 (3x2.4x3x10) 95 (3x2.4x3x50) 92 (3x2.4x3x10). P90 60 202 528 32 120 300 134. P95 106 412 1102 56 242 604 278. P of default** 95 (10x10) 99 (10x10x10) 99 (10x10x10x10) 80 (3x2x3) 93 (3x2x3x10) 95 (3x2x3x50) 92 (3x2x3x10). P90 42 141 370 22 84 210 94. P95 74 288 771 39 169 423 195. P of default** 97 (10x10) 99 (10x10x10) 99 (10x10x10x10) 83 (3x1.4x3) 93 (3x1.4x3x10) 95 (3x1.4x3x50) 92 (3x1.4x3x10). Guinea pig (750 g) (allometric factor = 3) General population Workers. GM Inter x intra: 12 Inter x intra x semic/c 24 Inter x intra x subac/c 60 Inter x intra 7 Inter x intra x semic/c 14 Inter x intra x subac/c 36 Inter x intra x subac/semic 14. Rabbit (2 kg) (allometric factor = 2.4) General population Workers. GM Inter x intra: 10 Inter x intra x semic/c 19 Inter x intra x subac/c 48 Inter x intra 6 Inter x intra x semic/c 11 Inter x intra x subac/c 29 Inter x intra x subac/semic 11. Monkey (5 kg)(allometric factor = 2) General population Workers. GM Inter x intra: 8 Inter x intra x semic/c 16 Inter x intra x subac/c 40 Inter x intra 5 Inter x intra x semic/c 10 Inter x intra x subac/c 24 Inter x intra x subac/semic 10. Dog (15 kg) (allometric factor = 1.4) General population Workers. GM Inter x intra: 5.6 Inter x intra x semic/c 11.2 Inter x intra x subac/c 28 Inter x intra 3 Inter x intra x semic/c 7 Inter x intra x subac/c 17 Inter x intra x subac/semic 7. * inter = inter1 x inter2; intra = intraspecies; subac = subacute; semic = semi-chronic; c = chronic ** ‘P of default’ is the percentile of the defaults currently used at the RIVM for the general population and by TNO for workers; these current default values are shown between brackets. Note that these percentiles have been estimated using the formulae in Annex I, though these formulae actually only apply to lognormal distributions whereas the intraspecies distribution is a shifted lognormal..
(16) RIVM report 601516 005. 4.. page 16 of 29. Example. Risk assessment of Substance X (general population and workers) Critical study NOAEL Species Exposure duration: Exposure route. : 4 mg.kgbw-1.d-1 : rat : semi-chronic : oral. Exposure of Human target population (general population) Estimated exposure : 20 µg.kgbw-1.d-1 (applying EUSES) Exposure duration : chronic Exposure route : oral Exposure of Human target population (workers) Estimated exposure1 : 1400 µg.kgbw-1.d-1 (applying EASE: based on a body weight of 70 kg, a concentration of 50 µg/cm2, and an exposed surface area of 2000 cm2) Exposure duration: : chronic Exposure route : dermal Estimated exposure 2 : 4 µg.kgbw-1.d-1 (applying EASE: based on a concentration of 29 µg/m3, a ventilation rate of 10 m3/day, and a body weight of 70 kg) Exposure duration: : chronic Exposure route : inhalation Extrapolation steps Interspecies* Intraspecies* Exposure period* LOAEL to NOAEL Route-to-route extrapolation. : rat-human (including allometric scaling factor) : to sensitive general population/workers : semi-chronic to chronic : no : yes for workers (oral to dermal and inhalation). These extrapolation steps are incorporated in the combined default distributions. Point estimates are to be used for the other extrapolation steps. *. 1. Extrapolation by using current default assessment factors In this approach the minimal MOS is equal to the overall assessment factor. The NOAEL divided by the overall assessment factor can be considered as an HLV to be used in risk assessment. General population Applying the current assessment factors of 10 for interspecies differences, 10 for intraspecies differences and 10 for the extrapolation from a semi-chronic NOAEL to a chronic NOAEL the minimal MOS should be 1000..
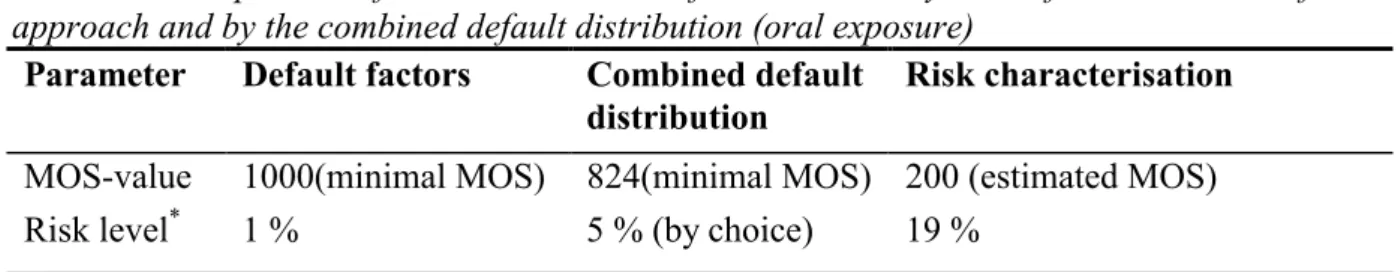
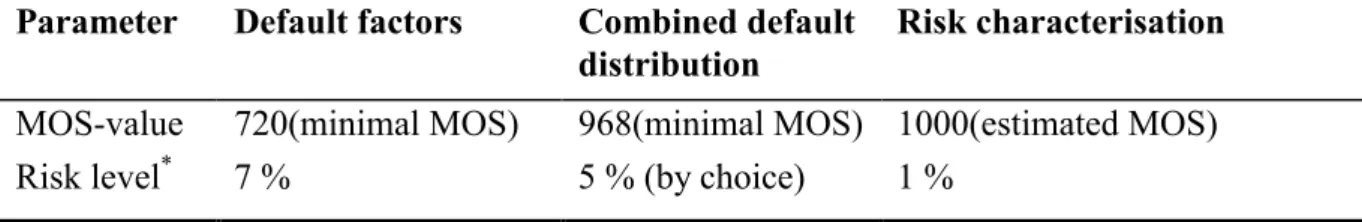
(17) RIVM report 601516 005. page 17 of 29. Workers Applying the current assessment factors of 3x4 for interspecies differences, 3 for intraspecies differences, 10 for the extrapolation from a semi-chronic NOAEL to a chronic NOAEL, and 2 for route to route extrapolation (based on an oral absorption of 50% and a dermal and inhalatory absorption of 100%) the minimal MOS should be 720. 2. Extrapolation by using the combined default distribution In this approach the minimal MOS is, by choice, equal to the 95th percentile of the combined default distribution (if applicable combined with point estimates for additional uncertainty factors). The ratio of the NOAEL (or LOAEL) and the 95th percentile can be considered as an HLV to be used in risk assessment. General population Based on the distribution for: • the interspecies variability, including the allometric scaling factor of 4 (point estimate) for a 250 g rat; • the intraspecies variability; • the extrapolation from the semi-chronic to the chronic time scale; the minimal MOS should be 824 (see Table 9). Workers Based on the distribution for: • the interspecies variability, including the allometric scaling factor of 4 (point estimate) for a 250 g rat; • the intraspecies variability; • the extrapolation from the semi-chronic to the chronic time scale; • a factor of 2 (point estimate) for route-to-route extrapolation, The minimal MOS should be 968 (see Table 9) 3. Risk characterisation General population The estimated MOS can be calculated as the ratio of the NOAEL and the estimated actual exposure, and equals to 200. The outcome of the above mentioned three approaches are summarised in Table 10. Table 10: Comparison of a risk assessment of substance X by the default assessment factor approach and by the combined default distribution (oral exposure) Parameter Default factors Combined default Risk characterisation distribution MOS-value Risk level*. 1000(minimal MOS) 1%. 824(minimal MOS) 200 (estimated MOS) 5 % (by choice) 19 %. * The probability that adverse effects occur at the HLV (for the default assessment factor and the combined default distribution approach) or at the estimated actual exposure (in the risk characterisation) assuming that no adverse effects occur at the NOAEL chosen. Risk level for defaults: see Table 9 (default factor of 1000 is at P99). Risk level for the risk characterisation: use GMs of Table 9, the GSDs of Table 7, and the Formularium of Annex I..
(18) RIVM report 601516 005. page 18 of 29. On the basis of Table 10 a risk characterisation for substance X can be made either by an assessment factor approach or by evaluation of the estimated MOS. The outcome of the risk assessment using the current default assessment factor approach can be compared with the combined default distribution approach by comparing the risk levels in the respective columns. The probability is maximally 19% that adverse effects occur in a sensitive part of the population at the estimated actual exposure to substance X. Workers The estimated MOS can be calculated as the ratio of the NOAEL and the estimated actual exposure, and equals to 2.8 for dermal exposure and 1000 for inhalation exposure. The outcome of the above mentioned three approaches are summarised in Table 11 for dermal exposure and 12 for inhalation exposure. Table 11: Comparison of a risk assessment of substance X by the default assessment factor approach and by the combined default distribution (dermal exposure) Parameter Default factors Combined default Risk characterisation distribution MOS-value Risk level*. 720(minimal MOS) 7%. 968(minimal MOS) 2.8 (estimated MOS) 5 % (by choice) 60 %. * The probability that adverse effects occur at the HLV (for the default assessment factor and the combined default distribution approach) or at the estimated actual exposure (in the risk characterisation) assuming that no adverse effects occur at the NOAEL chosen. Risk level for defaults: see Table 9 (the minimal MOS, i.e. the default factor of 360, combined with factor of 2 for route-to-route extrapolation, is at P93). The minimal MOS for the combined default distribution is 484 (Table 9), combined with the same factor 2. Risk level for the risk characterisation: use GMs of Table 9, the GSDs of Table 7, and the Formularium of Annex I.. Table 12: Comparison of a risk assessment of substance X by the default assessment factor approach and by the combined default distribution (inhalation exposure) Parameter Default factors Combined default Risk characterisation distribution MOS-value Risk level*. 720(minimal MOS) 7%. 968(minimal MOS) 1000(estimated MOS) 5 % (by choice) 1%. * The probability that adverse effects occur at the HLV (for the default assessment factor and the combined default distribution approach) or at the estimated actual exposure (in the risk characterisation) assuming that no adverse effects occur at the NOAEL chosen. Risk level for defaults: see Table 9 (the minimal MOS, i.e. the default factor of 360, combined with factor of 2 for route-to-route extrapolation, is at P93). The minimal MOS for the combined default distribution is 484 (Table 9), combined with the same factor 2. Risk level for the risk characterisation: use GMs of Table 9, the GSDs of Table 7, and the Formularium of Annex I.. On the basis of Tables 11 and 12 a risk characterisation for substance X can be made either by an assessment factor approach or by evaluation of the estimated MOS. The outcome of the risk assessment using the current default assessment factor approach can be compared with the combined default distribution approach by comparing the risk levels in the respective columns. For dermal exposure, the probability is 60% that adverse effects occur in a sensitive part of the population at the estimated actual exposure to substance.This probability is negligible for inhalation..
(19) RIVM report 601516 005. page 19 of 29. References Baird, S.J.S., Cohen, J.T., Graham, J.D., Shlyakhter, A.L. and Evans, J.S. (1996) Noncancer risk assessment: a probabilistic alternative to current practice. Hum. Ecol. Risk Assessment 2: 79-102. Calabrese, E.J. (1985) Uncertainty factors and interindividual variation. Regulat. Toxicol. Pharmacol. 5: 190-196 Groenveld, C.N., Paulussen, J.J.G., Houben, G.F. and Hakkert, B.C. (1998) Extrapolation for exposure duration in oral toxicity. Zeist, The Netherlands, TNO Nutrition and Food Research Institute. TNO report V98.276. Hakkert, B.C., Stevenson, H., Bos, P.M.J. and van Hemmen, J.J. (1996) Methods for the establishment of Health-Based Recommended Occupational Exposure Limits for existing substances. Zeist, The Netherlands, TNO Nutrition and Food Research, TNO report V96.463. Hattis, D., Erdreich, L. and Ballew, M. (1987) Human variability and susceptability to toxic chemicals - a preliminary analysis of pharmacokinetics data from normal volunteers, Risk Analysis 7: 414-426. Health Council (1985) Advies inzake uitgangspunten voor normstelling; De inzichtelijke opbouw van advieswaarden voor niet-mutagene, niet-carcinogene en niet-immunotoxische stoffen. The Hague, The Netherlands, Health Council Report, nr. 31 (in dutch). IPCS (1994) Assessing human health risks of chemicals: derivation of guidance values for health-based exposure limits. Geneva, Switzerland, International Programme on Chemical Safety, WHO/UNEP/ILO, Environmental Health Criteria no.170. Jager, T., den Hollander, H.A., Janssen G.B., van der Poel, P., Rikken, M.G.. and Vermeire, T.G. (2000) Probabilistic risk assessment for new and existing chemicals: sample calculations. Bilthoven, National Institute of Public Health and the Environment (RIVM), Report no. 679102049. Kalberlah, F. and Schneider, K. (1998) Quantification of extrapolation factors. Final report of the research project No. 116 06 113 of the Federal Environmental Agency, Schriftenreihe der Bundesanstalt für Arbeitsschutz un Arbeitsmedizin – Forschung – FB 797. Price, P.S., Keenan, R.E., Swartout, J.C., Gillis, C.A., Carlson-Lynch, H. and Dourson, M.L. (1997) An approach for modeling noncancer dose responses with an emphasis on uncertainty, Risk Analysis 17: 427 - 437. Rennen, M.A.J., Hakkert, B.C., Stevenson, H., Bos, P.M.J. (1999). Interspecies extrapolation: A quantitative analysis of historical toxicity data. Zeist, The Netherlands, TNO Nutrition and Food Research Institute. TNO-report No. V99.210 (accepted for publication in: Comments on Toxicology. Special issue on NoncancerHealth Risk Assessment in the 21st Century)..
(20) RIVM report 601516 005. page 20 of 29. Renwick, A.G. (1993a) Data-derived safety factors for the evaluation of food additives and environmental contaminants. Food Add. Contam. 10: 275-305. Renwick, A.G.(1993b) An analysis of the risk of exceeding the acceptable or tolerable daily intake. Regulat. Toxicol. Pharmacol. 18: 463-480. Renwick, A.G. (1999) Subdivision of uncertainty factors to allow for toxicokinetics and toxicodynamics. Hum. Ecol. Risk Assessment 5: 1035-1050. Schaddelee, M. (1997) Interspecies en intraspecies variabiliteit. Bilthoven, RIVM, Trainee report (in dutch) Slob, W. and Pieters, M.N. (1998) A probabilistic approach for deriving acceptable human intake limits and human risks from toxicological studies: general framework, Risk Analysis 18: 787-798. Swartout, J.C., Price, P.S., Dourson, M.L., Carlson-Lynch, H.L. and Keenan, R.E. (1998) A probabilistic framework for the Reference Dose (Probabilistit RfD), Risk Analysis 18: 271-282. Vermeire, T.G., Stevenson, H., Pieters, M.N., Rennen, M., Slob, W. and Hakkert, B.C. (1999) Assessment factors for human health risk assessment: a discussion paper. Crit. Reviews Toxicol. 29(5): 439-490..
(21) RIVM report 601516 005. page 21 of 29. Annex I: Formulae •. Lognormal distributions are characterised by a dispersion factor (k) defined such that e.g. 95% of the values of a stochastic variable (X) is within a factor of k from the median, M(X) pæç è. M( X ) > X > kM ( X )ö÷ = 0.95 ø k. and. k = exp(1.96s ln X ) •. Geometric mean of the lognormal distribution GM = exp(. •. Sample variance of log-entities sln2 X =. •. 1 n å ln Xi )) n i=1. 1 n 2 å (ln Xi − ln GM ) n − 1 i =1. Geometric standard deviation GSD = exp(sln X ). •. 95th percentile P0.95 for a lognormal distribution P0.95 = GM ⋅ GSD z0 . 95 and z0.95 = ln k / ln(slnX). M: GM: k: n: Xi: slnX : z0.95:. median geometric mean dispersion factor number of observations lognormally distributed ith observation (e.g. NOAEL) sample standard deviation of lognormally distributed X 95th percentile of the standard normal distribution.
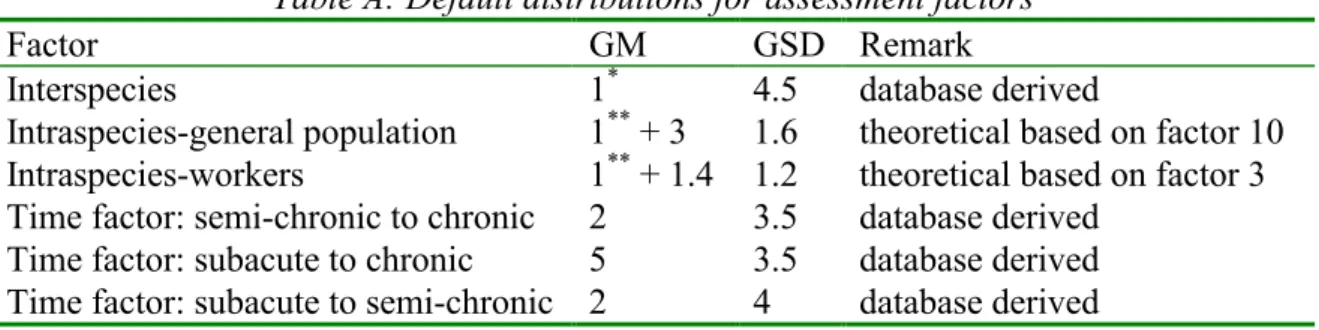
(22) RIVM report 601516 005. page 22 of 29. Annex IIa: Model for the risk assessment of new and existing substances on the basis of probabilistic assessment factors The present human risk characterisation is based on a comparison between an estimated or measured human exposure value and the NOAEL, resulting in a Margin Of Safety. This MOS needs interpretation on the basis of assessment factors. In the application of assessment factors all variability and uncertainty involved in the extrapolation from experimental data to a limit value for the sensitive human should be considered. Two approaches prevail: 1. Application of substance-specific assessment factors, and in the absence of sufficient substance specific data: 2. Application of default assessment factors. The default factors currently used in the latter method have been subject to research into their validity, which has resulted in estimations of the default distributions for the interspecies factor, the intraspecies factor and the factor for the extrapolation from an experimental study of short duration to one of longer duration (Vermeire et al., 1999; Rennen et al., 1999). These distributions can be used to explore further the interpretation of the MOS or the overall assessment factor used in extrapolation procedures (Slob and Pieters, 1998). The following risk characterisation of Substance X is based on the distributions in Table A. Table A: Default distributions for assessment factors Factor GM GSD Remark * database derived 1 4.5 Interspecies ** theoretical based on factor 10 1.6 Intraspecies-general population 1 +3 theoretical based on factor 3 Intraspecies-workers 1** + 1.4 1.2 database derived 3.5 Time factor: semi-chronic to chronic 2 database derived 3.5 Time factor: subacute to chronic 5 database derived 4 Time factor: subacute to semi-chronic 2 * This factor needs to be multiplied by an allometric scaling factor based on differences in caloric demand (mouse 7; rat 4; guinea pig 3; rabbit 2.4; monkey 1.9; dog 1.5) ** The whole distribution is increased by one (shifted to the right) since by definition the intraspecies factor cannot be smaller than unity. It is noted that some uncertainty factors (e.g. route-to-route extrapolation, extrapolation from a LOAEL to a NOAEL) are not incorporated in the combined default distribution. For these factors, if applicable, point estimates will be used. For all factors holds that a substance-specific point estimate is preferred to a default distribution or point estimate..
(23) RIVM report 601516 005. page 23 of 29. Risk assessment of Substance X (general population/workers) Critical study NOAEL (or LOAEL) Species Exposure duration: Exposure route. : … mg.kgbw-1.d-1 or mg/m3 :… :… : oral/dermal/inhalatory. Exposure of Human target population (workers/general population) Estimated exposure : ... mg.kgbw-1.d-1 or mg/m3 Exposure duration :… Exposure route : oral/dermal/inhalation (more than one possible) Extrapolation steps. Interspecies* Intraspecies* Exposure period* LOAEL to NOAEL Route-to-route extrapolation. : species-human (in/excluding allometric scaling factor) : to sensitive general population/worker : subacute/semi-chronic to semi-chronic/chronic : yes/no : yes/no (correction for absorption: …). These extrapolation steps are incorporated in the combined default distributions. Point estimates are to be used for the other extrapolation steps.. *. 1. Extrapolation by using current default assessment factors. In this approach the minimal MOS is equal to the overall assessment factor. The NOAEL divided by the overall assessment factor can be considered as an HLV to be used in risk assessment. Applying the current assessment factors of ... for interspecies differences, ... for intraspecies differences, ... for the extrapolation from a subacute/semi-chronic NOAEL to a semichronic/chronic NOAEL, and … for other uncertainties (e.g. route-to-route extrapolation, extrapolation from a LOAEL to a NOAEL) the minimal MOS should be .... 2. Extrapolation by using the combined default distribution. In this approach the minimal MOS is, by choice, equal to the 95th percentile of the combined default distribution (if applicable combined with point estimates for additional uncertainty factors). The ratio of the NOAEL and the 95th percentile can be considered as an HLV to be used in risk assessment. Based on the distribution for: • the interspecies variability, including the allometric scaling factor of ... (point estimate) for a ... g rat/mouse/dog/monkey/guinea pig/rabbit; • the intraspecies variability; • the extrapolation from the subacute/semi-chronic to the semi-chronic/chronic time scale; • a factor of .. (point estimate) for … (other factors (see above) + explanation) the minimal MOS should be ... (see Table 9)..
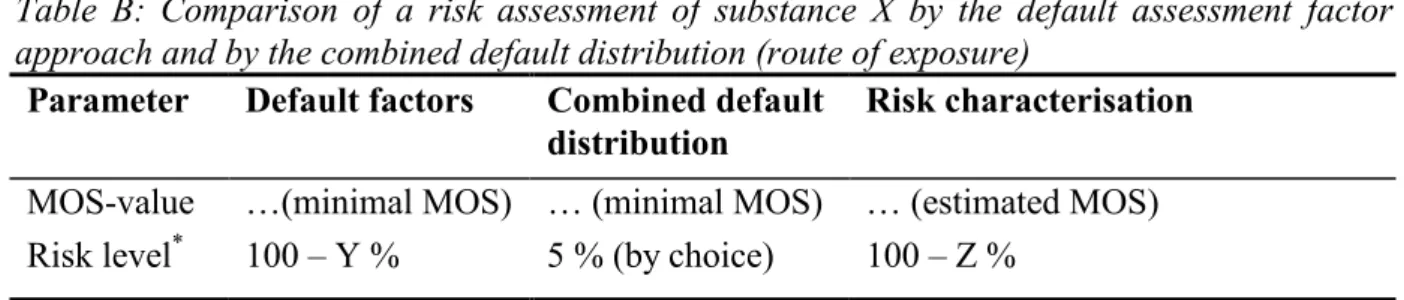
(24) RIVM report 601516 005. page 24 of 29. 3. Risk characterisation. The estimated MOS can be calculated as the ratio of the NOAEL (or LOAEL) and the estimated actual exposure, and equals to … The outcome of the above mentioned three approaches are summarised in Table B. Table B: Comparison of a risk assessment of substance X by the default assessment factor approach and by the combined default distribution (route of exposure) Parameter Default factors Combined default Risk characterisation distribution. MOS-value Risk level*. …(minimal MOS) … (minimal MOS) 100 – Y % 5 % (by choice). … (estimated MOS) 100 – Z %. * The probability that adverse effects occur at the given exposure (i.e. HLV for the default assessment factor and the combined default distribution approach, or the estimated actual exposure in the risk characterisation) assuming that no adverse effects occur at the NOAEL chosen. Risk level for defaults: see Table 9 (the minimal MOS i.e. the default factor of …., [combined with a factor of .. for ..,] is at P..). Risk level for the risk characterisation: use GMs of Table 9, the GSDs of Table 7, and the Formularium of Annex I in RIVM report 601516005/TNO report V3489.. On the basis of Table B a risk characterisation for substance X can be made either by an assessment factor approach or by evaluation of the estimated MOS. The outcome of the risk assessment by the traditional default assessment factor approach can be compared with the combined default distribution approach by comparing the risk levels in the respective columns. The probability is maximally 100-Z% that adverse effects occur in a sensitive part of the population at the estimated actual exposure to substance X. Key References. Rennen, M.A.J., Hakkert, B.C., Stevenson, H., Bos, P.M.J. (1999). Interspecies extrapolation: A quantitative analysis of historical toxicity data. Zeist, The Netherlands, TNO Nutrition and Food Research Institute. TNO-report No. V99.210 (accepted for publication in: Comments on Toxicology. Special issue on NoncancerHealth Risk Assessment in the 21st Century). Slob, W. and Pieters, M.N. (1998) A probabilistic approach for deriving acceptable human intake limits and human risks from toxicological studies: general framework, Risk Analysis18: 787-798. Vermeire, T.G., Stevenson, H., Pieters, M.N., Rennen, M., Slob, W. and Hakkert, B.C. (1999) Assessment factors for human health risk assessment: a discussion paper. Crit. Reviews Toxicol. 29(5): 439-490.
(25) RIVM report 601516 005. page 25 of 29. Annex IIb: Model for the risk assessment of pesticides on the basis of probabilistic assessment factors The present human risk characterisation is based on a comparison between the human exposure value and the HLV, in this case the ADI or AOEL (Acceptable Operator Exposure Limit), derived from the NOAEL using assessment factors. In the application of assessment factors all variability and uncertainty involved in the extrapolation from experimental data to a limit value for the sensitive human should be considered. Two approaches prevail: 1. Application of substance-specific assessment factors, and in the absence of sufficient substance specific data: 2. Application of default assessment factors. The default factors currently used in the latter method have been subject to research into their validity, which has resulted in estimations of the default distributions for the interspecies factor, the intraspecies factor and the factor for the extrapolation from an experimental study of short duration to one of longer duration (Vermeire et al., 1999; Rennen et al., 1999). These distributions can be used to explore further the interpretation of the overall assessment factor used in extrapolation procedures (Slob and Pieters, 1998). The following risk characterisation of Substance X is based on the distributions in Table A. Table A: Default distributions for assessment factors Factor GM GSD Remark * database derived 1 4.5 Interspecies theoretical based on factor 10 1.6 Intraspecies-general population 1** + 3 ** theoretical based on factor 3 Intraspecies-workers 1 + 1.4 1.2 database derived 3.5 Time factor: semi-chronic to chronic 2 database derived 3.5 Time factor: subacute to chronic 5 database derived 4 Time factor: subacute to semi-chronic 2 * This factor needs to be multiplied by an allometric scaling factor based on differences in caloric demand (mouse 7; rat 4; guinea pig 3; rabbit 2.4; monkey 1.9; dog 1.5) ** The whole distribution is increased by one (shifted to the right) since by definition the intraspecies factor cannot be smaller than unity. It is noted that some uncertainty factors (e.g. route-to-route extrapolation, extrapolation from a LOAEL to a NOAEL) are not incorporated in the combined default distribution. For these factors, if applicable, point estimates will be used. For all factors holds that a substance-specific point estimate is preferred to a default distribution or point estimate..
(26) RIVM report 601516 005. page 26 of 29. Risk assessment of Substance X (general population/workers) Critical study NOAEL (or LOAEL) Species Exposure duration: Exposure route. : … mg.kgbw-1.d-1 or mg/m3 :… :… : oral/dermal/inhalatory. Exposure of Human target population (workers/general population) Estimated exposure : ... mg.kgbw-1.d-1 or mg/m3 Exposure duration :… Exposure route : oral/dermal/inhalation (more than one possible) Extrapolation steps. Interspecies* Intraspecies* Exposure period* LOAEL to NOAEL Route-to-route extrapolation. : species-human (in/excluding allometric scaling factor) : to sensitive general population/worker : subacute/semi-chronic to semi-chronic/chronic : yes/no : yes/no (correction for absorption: …). These extrapolation steps are incorporated in the combined default distributions. Point estimates are to be used for the other extrapolation steps.. *. 1. Extrapolation by using current default assessment factors. The NOAEL divided by the overall assessment factor can be considered as the ADI/AOEL, to be used in risk assessment. Applying the current assessment factors of ... for interspecies differences, ... for intraspecies differences, ... for the extrapolation from a subacute/semi-chronic NOAEL to a semichronic/chronic NOAEL, and … for other uncertainties (e.g. route-to-route extrapolation, extrapolation from a LOAEL to a NOAEL) the ADI/AOEL should be .... 2. Extrapolation by using the combined default distribution. The ratio of the NOAEL and, by choice, the 95th percentile can be considered as the ADI/AOEL to be used in risk assessment. Based on the distribution for: • the interspecies variability, including the allometric scaling factor of ... (point estimate) for a ... g rat/mouse/dog/monkey/guinea pig/rabbit; • the intraspecies variability; • the extrapolation from the subacute/semi-chronic to the semi-chronic/chronic time scale; • a factor of .. (point estimate) for … (other factors (see above) + explanation) the ADI/AOEL should be ... (see Table 9). 3. Risk characterisation. The ratio of the NOAEL (or LOAEL) and the estimated actual exposure is ….
(27) RIVM report 601516 005. page 27 of 29. The outcome of the above mentioned three approaches are summarised in Table B. Table B: Comparison of a risk assessment of substance X by the default assessment factor approach and by the combined default distribution (route of exposure) Parameter Default factors Combined default Risk characterisation distribution. Overall factor Risk level*. …. …. …. 100 – Y %. 5 % (by choice). 100 – Z %. * The probability that adverse effects occur at the given exposure (i.e. ADI/AOEL for the default assessment factor and the combined default distribution approach, or the estimated actual exposure in the risk characterisation) assuming that no adverse effects occur at the NOAEL chosen. Risk level for defaults: see Table 9 (the minimal MOS i.e. the default factor of …., [combined with a factor of .. for ..,] is at P..). Risk level for the risk characterisation: use GMs of Table 9, the GSDs of Table 7, and the Formularium of Annex I in RIVM report 601516005/TNO report V3489.. On the basis of Table B a risk characterisation for substance X can be made. The outcome of the risk assessment by the traditional default assessment factor approach can be compared with the combined default distribution approach by comparing the risk levels in the respective columns. The probability is maximally 100-Z% that adverse effects occur in a sensitive part of the population at the estimated actual exposure to substance X. Key References. Rennen, M.A.J., Hakkert, B.C., Stevenson, H., Bos, P.M.J. (1999) Interspecies extrapolation: A quantitative analysis of historical toxicity data. Zeist, The Netherlands, TNO Nutrition and Food Research Institute. TNO-report No. V99.210 (accepted for publication in: Comments on Toxicology. Special issue on NoncancerHealth Risk Assessment in the 21st Century). Slob, W. and Pieters, M.N. (1998) A probabilistic approach for deriving acceptable human intake limits and human risks from toxicological studies: general framework, Risk Analysis18: 787-798. Vermeire, T.G., Stevenson, H., Pieters, M.N., Rennen, M., Slob, W. and Hakkert, B.C. (1999) Assessment factors for human health risk assessment: a discussion paper. Crit. Reviews Toxicol. 29(5): 439-490.
(28) RIVM report 601516 005. page 28 of 29. Annex III: Mailing list 1-. 5. 6 7 8 9 10 11 12 13 14 15 16 - 23 24 25 26 27 28 29 30 31 32 33 34 35 36 37 38 39 40 39 40 41 42 43 44 45 46 47 48 49 50 51 52 53. Ministerie van Sociale Zaken en Werkgelegenheid, t.a.v. Dr. C.L. Maas, Hoofd A&O, afdeling Onderzoek Directie RIVM Dr. Ir. P.C. Bragt, VWS/HIGB Dr. C. Cuypers, VWS/GZB Dr. W. van Eck, VWS/GZB Dr. H. Roelfzema, VWS/GZB Dr. J. de Stoppelaar, VWS/GZB Mr. J.A.M. Whyte, VWS/GZB Dr. D.W.G. Jung, DGM/SAS Dr. J. van Zorge, DGM/SAS Dr. W.F. ten Berge, DSM, Heerlen Prof.Dr. J.S.M. Boleij, CTB, Wageningen Dr. J. Bridges, CSTEE, Brussels, België Dr. F.M. Carpanini, ECETOC, Brussel, België Dr. J. Costa-David, CSTEE, Brussels, België Dr. J.I. Delic, HSE, Bootle, UK Dr. C. DeRosa, ATSDR, Atlanta, USA Dr. M.L. Dourson, TERA, Cincinnati, USA Dr. H.E. Falke, CTB, Wageningen Dr. R. Fielder, Department of Health, Londen, UK Dr. J. Gift, EPA-NCEA, Washington, USA Prof. Dr. U. Gundert-Remy, BGVV, Berlijn, Duitsland Dr. S. Hanai, JCIA, Tokyo, Japan Dr. B. Hansen, ECB, Ispra, Italië Prof.Dr. P.T. Henderson, RUL, Maastricht Dr. R.F. Hertel, BGVV, Berlijn, Duitsland Dr. J. Herman, IPCS, Genève, Zwitserland Dr. A. Jarabek, EPA-NCEA, Washington, USA Dr. F. Kalberlah, FoBiG, Freiburg, Duitsland Prof.Dr. I. Rietjens, LUW, Wageningen Prof.Dr. R. Kroes, RITOX, Utrecht Dr. C. Lally, P&G, Strombeek-Bever, België Dr. E. Löser, Bayer, Duitsland Dr. B. Meek, Health Canada, Ottawa, Canada Dr. G. Moore, KEMI, Solna, Zweden Dr. S. Munn, ECB, Ispra, Italië Dr. E.V. Ohanian, OST, EPA, Washington, USA Dr. W.F. Passchier, Gezondheidsraad, Den Haag Dr. H.R. Pohl, ATSDR, Atlanta, USA Dr. A.G. Renwick, University of Southampton, UK Dr. M. Reynier, INRS, Parijs, Frankrijk Prof.Dr. W. Seinen, RITOX, Utrecht Dr. Y. Sekizawa, NIHS, Tokyo, Japan Dr. C. Sonich-Mullin, IPCS, Cincinnati, USA.
(29) RIVM report 601516 005. 54 Dr. R. Tomerlin, NoviGen Sciences, Washington, USA 55 Dr.H.G. Verschuuren, Dow Europe, Horgen, Zwitserland 56 Dr. E. van Vliet, Gezondheidsraad, Den Haag 57 Dr. V. Vu, NCEA, EPA, Washington, USA 58 Dr. A.A.E Wibowo, Coronel Laboratorium, Amsterdam 59 Dr. A. Wagner, DHSH, Canberra, Australië 60 Dr. A. Wilson, HSE, Bootle, UK 61 RIVM: Sectordirecteur Risico's, Milieu en Gezondheid 62 RIVM: Sectordirecteur Volksgezondheidsonderzoek 63 RIVM: Hoofd Laboratorium voor Blootstellingsonderzoek 64 RIVM: Hoofd Centrum voor Stoffen en Risicobeoordeling 65 RIVM: Hoofd Laboratorium voor Effectenonderzoek 66 RIVM: Hoofd Afdeling Voorlichting en Public Relations 67 - 76 RIVM: Beoordelingsgroepen H en H/M d.t.v. Drs.A.G.A.C. Knaap 77 - 78 RIVM: Centrum voor Stoffen en Risicobeoordeling 79 Directie TNO 80 TNO: Hoofd Divisie Toxicologie 81 TNO: Hoofd Afdeling Toxicologische Risicobeoordeling 82 - 90 TNO: Afdeling Toxicologische Risicobeoordeling 91 -110 TNO: intern 111 Prof.dr. W. Slob, RIVM/LEO 112 Dr. J.-D. te Biesebeek, RIVM/LEO 113-116 Auteurs 117 Bureau Rapportenregistratie RIVM 118 Bibliotheek RIVM 119 Bibliotheek TNO 120-140 Bureau Rapportenbeheer 141-150 Reserve exemplaren 151 Depot Nederlandse Publicaties and Nederlandse Bibliografie 152 SBD/Voorlichting & Public Relations. page 29 of 29.
(30)
Afbeelding
+5

GERELATEERDE DOCUMENTEN
Purpose: To test the hypothesis that delineation of swallowing organs at risk (SWOARs) based on different guidelines results in differences in dose–volume parameters and
Since Chenoweth’s account is derived from more general social mobilization theory, the very first step in the causal process ultimately leading towards the proliferation
Simi- larly, phagocytosis induction upon treatment with CD20 antibody rituximab alone or in combination with CD47 antibody does not correlate with, nor requires, cancer cell
nasal intermittent positive pressure versus nasal continuous positive airway pressure in preterm infants after extubation. The Journal of Maternal-Fetal &
Op basis van de landelijke studie naar klachten en aandoeningen van het bewegingsapparaat (de KAB-studie ) is een analyse gemaakt van prevalenties, consequenties en risicogroepen
Verschil in gemiddelde scores met 95%-betrouwbaarheidsinterval tussen personen met COPD en personen zonder COPD voor elke dimensie van kwaliteit van leven voor respondenten van
− Zelfverwijzers die niet gewond (T0) of slechts lichtgewond (T3) zijn (maar mogelijk wel besmet met radioactief materiaal) kunnen op een andere locatie op besmetting worden
