Standpunt signaleren van
taalachterstanden door
de jeugdgezondheidszorg max 3 regels
Standpunt signaleren van taalachterstanden door
de jeugdgezondheidszorg max 2 regels
Rapport 295001006/2009A.E. Boekholt | A.M. Later | A.B. Hofmann | A.N. Kennis
Evaluation of the Dutch QRA directives
for storage and transportation of
flammable liquids
RIVM Report 620550001/2010E.S. Kooi | M.B. Spoelstra | P.A.M. Uijt de Haag
RIVM
National Institute for Public Health and the Environment P.O. Box 1
3720 BA Bilthoven The Netherlands www.rivm.com
RIVM Report 620550001/2010
Evaluation of the Dutch QRA directives for storage
and transportation of flammable liquids
E.S. Kooi M.B. Spoelstra P.A.M. Uijt de Haag
Contact: E.S. Kooi
Centrum Externe Veiligheid eelke.kooi@rivm.nl
This investigation has been performed by order and for the account of VROM, within the framework of Advisering en ondersteuning beleid EV
RIVM, P.O. Box 1, 3720 BA Bilthoven, the Netherlands Tel +31 30 274 91 11 www.rivm.nl
© RIVM 2010
Parts of this publication may be reproduced, provided acknowledgement is given to the 'National Institute for Public Health and the Environment', along with the title and year of publication.
Abstract
Evaluation of the Dutch QRA directives for storage and transportation of flammable liquids
According to Dutch legislation, the possibility of incidents with human casualties has to be determined for storage and transportation of flammable petroleum products. Part of the assessment is the calculation of the size and location of the area wherein people may die. For this risk assessment a methodology is prescribed. The possibility of an explosion at a flammable liquid storage facility turns out to be sufficiently accounted for in the methodology. However, some improvements in the methodology are desired. This is established by RIVM research that was commissioned by the Dutch Ministry of VROM. The study was initiated by an unexpectedly large explosion at a flammable liquids storage facility at Hemel Hempstead, England, in 2005.
A good risk calculation methodology is desirable because safety distances for buildings in the vicinity of such companies are determined from the calculated risks. These safety distances prevent that vulnerable destinations, such as homes and schools, are built at locations where the probability of death from such accidents is high.
It is recommended to better specify in the risk assessment methodology how consequences of releases of mixtures should be calculated. Additionally, some recommendations have been done for specific parts of the consequence models.
Besides the accident in Hemel Hempstead, other incident with storage and transportation of flammable petroleum products have been taken into account as well.
Key words:
third party risk, Quantitative Risk Assessment, flammable liquids, atmospheric storage tanks, transportation
Rapport in het kort
Evaluatie van de Nederlandse QRA-voorschriften voor opslag en transport van brandbare vloeistoffen
Voor opslag en transport van brandbare aardolieproducten moet volgens de Nederlandse wetgeving worden bepaald of er ongevallen kunnen optreden waarbij dodelijke slachtoffers kunnen vallen. Als onderdeel hiervan moet ook de grootte en de ligging worden vastgesteld van het gebied waarbinnen mensen kunnen overlijden in geval van een ernstig ongeval. Voor deze risicobeoordeling is een methodiek vastgesteld. In deze methodiek blijkt de mogelijkheid van een explosie bij activiteiten met brandbare aardolieproducten voldoende te zijn verdisconteerd. Wel zijn enkele verbeteringen in de methodiek gewenst. Dit blijkt uit onderzoek van het RIVM in opdracht van het ministerie van VROM. Aanleiding voor het onderzoek was een onverwacht grote explosie bij een opslagfaciliteit van aardolieproducten in Hemel Hempstead, Engeland, in 2005. Een goede rekenmethodiek is gewenst omdat op basis van de berekende risico’s veiligheids-afstanden worden vastgesteld voor bebouwing in de omgeving van dergelijke bedrijven. Met dergelijke veiligheidsafstanden wordt voorkomen dat kwetsbare bestemmingen, zoals woningen en scholen, op locaties staan waar de kans op overlijden door dergelijke ongelukken groot is. Aanbevolen wordt om in de rekenmethodiek beter te specificeren hoe de effecten van vrijkomende mengsels moeten worden berekend. Ook zijn verbeteringsvoorstellen gedaan voor enkele specifieke modelonderdelen.
In de evaluatie zijn naast het genoemde ongeval in Hemel Hempstead, ook andere ongevallen bij opslag en transport van brandbare aardolieproducten meegenomen.
Trefwoorden:
externe veiligheid, kwantitatieve risicoanalyse, brandbare vloeistoffen, atmosferische opslagtanks, transport
Contents
List of tables and figures 9
Glossary 13
Samenvatting 15
Summary and conclusions 19
1 Introduction 23
2 Dutch QRA guidelines and corresponding outcomes 25
2.1 Introduction 25
2.2 Storage installations at SEVESO II establishments 26 2.3 Loading and unloading activities 33 2.4 Road transportation 38 2.5 Rail transportation 40 2.6 Inland waterway transport 42 2.7 Pipeline transport (underground) 43 2.8 Various modelling aspects 45
2.9 Conclusions 46
3 Analysis of existing QRA calculations 49
3.1 Introduction 49
3.2 Selected companies 49
3.3 Set-up 49
3.4 Results 50
3.5 Conclusions 51
4 Analysis of reported LOC events and consequences 53
4.1 Introduction 53
4.2 Set-up 53
4.3 Results 53
4.4 Conclusions 56
5 Literature and accident database review 57
5.1 Introduction 57
5.2 Accident database analysis 57
5.2.1 Introduction 57
5.2.2 MARS database 57
5.2.3 FACTS 2008 database 59 5.3 Literature review 60
5.3.1 Sources 60
5.3.2 Literature and database survey for storage tanks and pipework 60 5.3.3 Literature and database survey for transport units 63 5.4 Overall discussion of scenarios relevant for third party risk 67 5.5 Summary and conclusions of the literature and database survey 69
6 Recommendations 71
References 77
Appendix A - Sensitivity study for SAFETI-NL outcomes 79 Appendix B - Pure components versus mixtures 89 Appendix C - Detailed results from MARS database analysis 93 Appendix D - Summary of most relevant literature 97 Appendix E - Description of the Buncefield incident 105 Appendix F - Members of the Advisory Committee 107
List of tables and figures
Tables
Table 1 Release scenarios and frequencies for a single containment atmospheric storage tank 26 Table 2 Ignition probabilities for a release of class 1 flammable liquids from a single
containment atmospheric storage tank 28 Table 3 Additional risk parameters (single containment atmospheric storage tank
containing class 1 flammable liquids) 28 Table 4 QRA results for single containment atmospheric storage tanks containing class 1
flammable liquids (current methodology) 29 Table 5 Ignition probabilities for a release of class 2 flammable liquids (storage
temperature below the flash point) from a single containment atmospheric
storage tank 30
Table 6 Additional risk parameters (single containment atmospheric storage tank
containing class 2 flammable liquids) 31 Table 7 QRA results for single containment atmospheric storage tanks containing class 2
flammable liquids (current methodology) 32 Table 8 Release scenarios and frequencies for loading activities 33 Table 9 Release scenarios and frequencies for on site transport units 33 Table 10 Additional parameters needed for risk calculations for loading activities 34 Table 11 QRA results for unloading from ships or loading to ships (class 1 flammable
liquids) 36 Table 12 QRA results for unloading from ships or loading to ships (class 2 flammable
liquids) 37 Table 13 Release scenarios and frequencies for a road tanker (transportation risk) 38 Table 14 Ignition probabilities for a release of LF1 and LF2 flammable liquids from a
road tanker 39
Table 15 Consequence distances for a release of LF1 and LF2 flammable liquids from a
road tanker 40
Table 16 Release scenarios and frequencies for a rail tanker (transportation risk) 40 Table 17 Ignition probabilities for a release of C3 flammable liquids from a rail tanker 41 Table 18 Consequence distances for a release of C3 flammable liquids from a rail tanker 41 Table 19 Release scenarios and frequencies for a single hull liquid tanker 42 Table 20 Ignition probabilities for inland waterway transport 42 Table 21 Consequence distances for a release of LF1 and LF2 flammable liquids from a
single hull vessel 42 Table 22 Release scenarios and frequencies for an underground pipeline 43 Table 23 Ignition probabilities for an underground pipeline 44 Table 24 Consequence and risk data for underground pipelines 45 Table 25 Selected facilities for QRA inventory 49 Table 26 General results for highly flammable liquids (class 1 and class 2) 50 Table 27 Other results from QRA survey 51 Table 28 List of installation scenarios per category 54 Table 29 Reported installation scenarios and their consequences (based on three safety
reports) 55 Table 30 Cause, consequences and damage for storage-related incidents (MARS data) 58 Table 31 Cause, consequence and damage for incidents near transfer point (MARS data) 59
Table 32 Causes and consequences for on site incidents with possible off site damage
(excluding transport units) 62 Table 33 Cause, consequence and damage for incidents with road and rail tankers (highly
flammable liquids) 66 Table 34 Cause, consequence and damage for incidents with tanker ships (highly
flammable liquids) 66 Table 35 Summary for on site incidents with possible off site damage (class 1 flammable
liquids) 67 Table 36 Examples of consequences and (heavy) damage (class 1 flammable liquids) 68 Table 37 Consequence and risk outcomes for single containment atmospheric storage
tanks containing class 1 flammable liquids (using recommendations) 73 Table 38 Consequence and risk outcomes for single containment atmospheric storage
tanks containing class 2 flammable liquids (using recommendations) 75 Table A.1 Influence of the tank head for the 10000 m3 tank filled with class 1 flammable
liquids (site boundary at 50 m) 83 Table A.2 Influence of the tank head for the 10,000 m3 tank filled with class 2 flammable
liquids (site boundary at 50 m) 84 Table A.3 Impact of different proposals on distances for storage tanks with class 1
flammable liquids 85 Table A.4 Detailed results for loading/unloading class 1 flammable liquids to ships (500
m3/hr, site boundary at 50 m) 86 Table A.5 Impact of the pool size on distances for transfer of class 1 flammable liquids (site
boundary at 50 m) 87 Table B.1 Consequence results for the mixture in PC and Hybrid approach and pure
components n-hexane and n-pentane (weather = D5) 90 Table B.2 Saturated vapour pressure of various hydrocarbon products 91 Table C.1 Details for incidents with storage tanks or on site pipework (selection of 24 cases
sorted by cause) 93 Table C.2 Details for incidents related to transfer (selection) 96 Table D.1 Summary of incidents reported in [18] 99 Table E.1 Pressure – distance pairs reported in [42] 106
Figures
Figure 1 Event tree for an instantaneous release of class 1 flammable liquids from a single containment atmospheric storage tank 27 Figure 2 Event tree for a continuous release of class 1 flammable liquids from a single
containment atmospheric storage tank 27 Figure 3 Event tree for an instantaneous release of class 2 flammable liquids (storage
temperature below the flash point) from a single containment atmospheric
storage tank 30 Figure 4 Event tree for a continuous release of class 2 flammable liquids (storage
temperature below the flash point) from a single containment atmospheric
storage tank 31 Figure 5 Event tree for a significant release of flammable liquids from a road tanker 38 Figure 6 Event tree for a significant release of flammable liquids from a rail tanker 41 Figure 7 Event tree for a release of flammable liquids from a single hull vessel 43 Figure 8 Event tree for a significant release of flammable liquids from a pipeline 44 Figure 9 Occurrence of consequences in safety reports 54 Figure 10 Transect of Individual Risk for the storage of class 1 flammable liquids (using
recommendations) with site boundary at 50 m 74 Figure 11 Transect of Individual Risk for the storage of class 1 flammable liquids (using
recommendations) with site boundary at 150 m 74 Figure 12 Transect of Individual Risk for the storage of class 2 flammable liquids (using
recommendations) 76 Figure A.1 Instantaneous release of 10,000 m3 hexane (UFL in orange, LFL in blue) with
tank head 13.7 m. Time of frames: 1st row: 0s- 5s-10s, 2nd row: 15s-20s-50s,
3rd row: 60s-80s. 80 Figure A.2 Instantaneous release of 10,000 m3 hexane (UFL in orange, LFL in blue) with
tank head 0 m. Time of frames: 1st row: 0s- 1s-6s, 2nd row: 10s-30. 81 Figure A.3 Continuous release of 10,000 m3 hexane (UFL in orange, LFL in blue) with tank
head 13.7 m. Time of frames: 1st row: 0s- 6s-20s, 2nd row: 30s-605s-620s. 82 Figure E.1 Overpressure versus distance pairs reported in [42] 106
Glossary
C3 liquids A category of flammable liquids used for Dutch rail transportation QRAs. It concerns mostly (highly) flammable liquids with a flash point below 23 °C and is defined by a specific set of UN numbers.
Class 1 (K1) flammable liquids Highly flammable liquids as defined in the EU Seveso II directive, Annex I, part 2, category 7a/b. Also known as ‘class 1 liquids’ (‘klasse 1 vloeistoffen’ in Dutch).
Class 2 (K2) flammable liquids Flammable liquids as defined by the EU Seveso II Directive, Annex 1, part 2, category 6. Also known as ‘class 2 liquids’ (‘klasse 2 vloeistoffen’ in Dutch).
Free field approach Conservative assumption that flammable clouds will always ignite if they move beyond the site boundary. Furthermore, the flammable cloud is assumed to ignite at maximum cloud size. Individual Risk (IR) Probability that during one year an imaginary person that
resides continuously at a specific location dies as a consequence of an incident involving an activity with hazardous substances. Also referred to as Location-based Risk or Locational Risk. LF1 liquids Flammable liquids as defined by ADR regulations for road
transportation; class 3, packing group III.
LF2 liquids (Highly) flammable liquids as defined by ADR regulations for road transportation; class 3, packing group II.
QRA Quantitative Risk Analysis
RBM II Software package recommended by the Dutch Ministry of Transport, Public Works and Water Management for QRA calculations involving transportation of hazardous substances SAFETI-NL Software package prescribed by Dutch legislation for QRA
calculations involving establishments using, storing and/or producing significant amounts of hazardous substances
Societal Risk (SR) Probability that during one year N or more persons die in a single incident involving an activity with hazardous materials
Samenvatting
Een serie van explosies op de ‘Buncefield Oil Storage Depot’ in Hemel Hempstead, Engeland op 11 december 2005, heeft grote bezorgdheid veroorzaakt over de veiligheid van opslagfaciliteiten voor aardolieproducten. In Nederland heeft de overheid de vraag gesteld of de veiligheids-gerelateerde richtlijnen en voorschriften voor de opslag van olieproducten adequaat waren. In het huidige rapport is onderzocht hoe de Nederlandse richtlijnen ([1] en [2]) voor de kwantitatieve risicoanalyse (QRA) van opslag, verlading en transport van vloeibare aardolieproducten zich verhouden tot de incidenten die zich hebben voorgedaan. Een analyse van incidentendatabases en een literatuuronderzoek zijn uitgevoerd om te bepalen welke typen incidenten zich kunnen voordoen en welke gevolgen ze kunnen hebben. De nadruk lag op incidenten die van belang zijn voor de externe veiligheid, dat wil zeggen incidenten die dodelijke gevolgen kunnen hebben buiten de inrichting.
Een belangrijke conclusie is dat de explosie bij Hemel Hempstead niet uniek was. Soortgelijke incidenten zijn gevonden in de literatuur. Een andere belangrijke conclusie is dat de mogelijkheid van een explosie reeds is opgenomen in de vigerende Nederlandse richtlijnen voor de QRA. Dit onderzoek heeft geen betrekking op kwantificering van frequenties voor uitstroomscenario’s. Voor de vaststelling van deze frequenties zijn gedetailleerde gegevens nodig over het aantal incidenten, het aantal tankopslagjaren en de gebruikte apparatuur. Een dergelijke gedetailleerde analyse viel buiten de doelstellingen voor het huidige onderzoek. Als gevolg daarvan kon niet worden geconcludeerd of de berekende risicoafstanden realistisch zijn, of optimistisch of pessimistisch.
De analyse heeft niet geleid tot een nauwkeurige kwantificering van effectafstanden, omdat de incidentbeschrijvingen veelal niet gedetailleerd genoeg waren om de overdrukwaarden op verschillende afstanden te bepalen. In plaats daarvan is de grootteorde van effectafstanden geraamd voor de verschillende scenario’s. De resultaten zijn als volgt:
Opslag en verlading van K1-vloeistoffen (vlampunt lager dan 21 ºC)
Het berekende risico van opslagtanks wordt voor een groot deel bepaald door het scenario instantaan vrijkomen van de volledige tankinhoud. Echter, in het incidentdatabase- en literatuur-onderzoek zijn geen incidenten gevonden waarbij de volledige inhoud vrijwel instantaan vrijkwam en die aanzienlijke schade buiten het terrein tot gevolg hadden. Tankexplosies en het breken of uitscheuren van een tank treedt op, maar de optredende effecten zijn aanzienlijk kleiner dan de berekende effecten voor het scenario instantaan vrijkomen van de volledige tankinhoud. Daarom wordt voorgesteld de modellering van het instantane scenario zodanig te wijzigen dat de effecten van het instantane scenario overeenkomen met de waarnemingen.
Volgens de literatuur en incidentdatabases, zijn de grootste effectafstanden voor opslagtanks het gevolg van incidenten waarbij de tank wordt overvuld en de gaswolk met vertraging ontsteekt. De effectafstand van overvullen blijkt vergelijkbaar met de berekende gevolgen van het
release scenario. Daarom wordt volgens de huidige zienswijze het scenario vrijkomen van de volledige inhoud in tien minuten representatief geacht voor overvulincidenten.
Breuk van de laadarm is het dominante scenario voor het totale risico van verlading van K1-producten van of naar schepen. Volgens de berekeningen kunnen de wolkbrand en de explosie dodelijke gevolgen hebben op afstanden tot 500 m. Voor het scenario met 3000 m3/uur overdracht ligt de PR 10-6/jaar contour op 460 m afstand. Deze afstanden worden aanzienlijk verminderd als inbloksystemen en een realistische plasomvang worden meegenomen. In het incidentdatabase- en literatuuronderzoek zijn explosies van een scheepscompartiment, overvullen van scheepscompartimenten, breuken van laadarmen en het vrijkomen van brandbare vloeistof uit open kleppen geïdentificeerd als gebeurtenissen die grote effecten kunnen hebben. Scheepsexplosies veroorzaken geen schade in een mate die relevant is voor een QRA. Breuk van de laadarm is al opgenomen als QRA-scenario. Dit scenario wordt ook geacht het vrijkomen vanuit open kleppen en het overvullen van scheepscompartimenten te representeren.
Opslag en verlading van K2-vloeistoffen (vlampunt tussen 21 en 55 ºC)
De berekende effectafstanden voor K2-vloeistoffen zijn aanzienlijk kleiner dan de effectafstanden voor K1-vloeistoffen. Bovendien is de kans op directe ontsteking beduidend lager en wordt vertraagde ontsteking niet meegenomen. Voor een enkele opslagtank wordt geen PR 10-6/jaar contour berekend. Het restrisico wordt bepaald door de effectafstand van de plasbrand.
Transport van brandbare vloeistoffen (LF1, LF2, C3)
Voor het vervoer van brandbare vloeistoffen houdt de QRA-richtlijn alleen rekening met de mogelijkheid van een plasbrand. Effectberekeningen laten zien dat bij het volledig falen van een tankauto of spoorketelwagen bij atmosferische druk en temperatuur een brandbare wolk gevormd kan worden met een doorsnede van 25 m. Deze wolkomvang is vergelijkbaar met de straal van de vloeistofplas. Als een spoorketelwagen faalt in een plasbrand dan is uit casuïstiek gebleken dat er een vuurbal kan optreden, wat gepaard kan gaan met relevante overdrukeffecten. Als brandbare vloeistoffen naar een riool- of drainagesysteem lekken, dan kunnen er explosies optreden als de dampen ontsteken.
De effecten die optreden bij ongevallen in tunnels zijn in dit rapport niet beschouwd.
Modelleringsaspecten
De modeluitkomsten van het scenario instantaan vrijkomen van de volledige tankinhoud, dat volgens het voorschrift moet worden berekend op basis van de maximale hoogte van de vloeistofkolom, worden niet fysisch realistisch geacht. Daarom wordt aanbevolen om dit onderdeel van het voorschrift aan te passen en uit te gaan van een vloeistofkolom van 0 meter hoogte.
De effect- en risicoberekeningen zijn uitgevoerd met n-hexaan. Deze pure stof werd representatief geacht voor brandbare vloeistofmengsels (K1), waaronder benzine. Een oriënterende berekening met de nog in ontwikkeling zijnde ‘multi-component’ optie in SAFETI-Professional geeft aan dat de berekende effect- en de risicoafstanden van een mengsel zoals (winter-)benzine groter kunnen
zijn dan die van zuiver n-hexaan. Deze ‘multi-component’ optie is op dit moment nog niet beschikbaar in SAFETI-NL.
Huidige Veiligheidsrapporten:
In de veiligheidsrapporten van de grootste Nederlandse inrichtingen met vloeibare aardolieproducten, wordt bij de installatiescenario’s het overvullen van een tank regelmatig genoemd als mogelijk uitstroomscenario. Daarbij wordt verwacht dat een overvulincident kan leiden tot een wolkbrand of een plasbrand. De meerderheid van de gerapporteerde uitstroomscenario’s betreffen lekkages zonder ontsteking. Lekkages gevolgd door een brand worden minder vaak gerapporteerd. De QRA’s toonden grote verschillen in uitkomsten, hetgeen overeenstemt met eerder uitgevoerde benchmark-studies voor de Nederlandse QRA-berekeningen (zoals [3]).
Summary and conclusions
A set of explosions at the Buncefield Oil Storage Depot in Hemel Hempstead, England on 11 December 2005, caused considerable concern about the safety of flammable liquid storage facilities. In the Netherlands public authorities wondered if the safety related guidelines for the storage of petroleum products were adequate. In the current report it was investigated how the Dutch guidelines ([1] and [2]) for quantitative risk assessment (QRA) of storage, transfer and transportation of liquid petroleum products compare to the incidents that have occurred. An incident database review and an analysis of literature were carried out to determine which types of incidents may occur and what consequences they may have. The focus was on incidents that are relevant for third party risk, that is incidents that may have lethal consequences outside the establishment.
An important conclusion is that the explosion in Hemel Hempstead was not unique, as similar incidents have been found in literature. Another important conclusion is that the possibility of an explosion is already included in the prevailing Dutch guidelines for QRA.
This study did not involve a quantification of frequencies for different release scenarios. In order to determine these frequencies, detailed data on the number of incidents, tank storage years and used equipment is needed. Such a detailed analysis was not the scope of the current project. As a result, it could not be concluded whether the calculated risk distances are realistic, pessimistic or optimistic.
The analysis did not lead to an accurate quantification of consequence distances because the incident descriptions were not detailed enough to determine the overpressure levels at different distances. Instead, the order of magnitude of the consequence distances has been estimated for different scenarios. The results are as follows:
Storage and transfer of class 1 (K1) flammable liquids (flash point below 21 ºC)
The calculated risk of storage tanks is to a large extent determined by the instantaneous release scenario. However, the databases and literature review did not reveal incidents with substantial damage off site caused by (near-)instantaneous releases. Tank explosions and ruptures and fissures of tanks occur, but the reported consequences are significantly less severe than the calculated consequences for the instantaneous release scenario. Therefore, it is proposed to alter the way in which the instantaneous scenario is modelled in such a way that the effects of the scenario will correspond to the observations.
According to literature and incident databases, the largest consequence distances dealing with storage tanks are the result of overfill incidents followed by late ignition. The consequence distance for overfilling turns out to be comparable to the calculated consequences of the ten minute release scenario. Therefore, the ten minute release scenario is considered to be representative for overfill events.
Rupture of the loading arm is the dominant scenario for the overall risks of the transfer of class 1 flammable liquids to or from ships. According to the calculations the flash fire and explosion may have lethal consequences at distances up to 500 m. For the scenario with 3000 m3/hr transfer, the IR 10-6/yr contour is located at 460 m distance. These distances are considerably reduced if blocking systems and a realistic pool size are taken into account. The accident database and literature review identified explosions of ship compartments, overfilling of ship compartments, ruptures of the loading arm and releases from open valves as events that may have large consequences. Tanker ship explosions do not cause damage to an extent that is relevant for a QRA. Rupture of the loading arm is already taken into account as a QRA scenario. This scenario is also expected to represent releases from open valves and overfilling of a ship.
Storage and transfer of class 2 (K2) flammable liquids (flash point between 21 and 55 ºC)
The calculated consequence distances for K2 liquids are considerably smaller than consequence distances for class 1 flammable liquids. Furthermore, the probability of immediate ignition is significantly lower and delayed ignition is not considered. No IR 10-6 contour is obtained for a single storage tank. Lower risk levels are determined by the consequences of the pool fire.
Transportation of flammable liquids (LF1, LF2, C3)
For the transportation of flammable liquids, the guideline only considers the possibility of a pool fire. Consequence calculations show that a catastrophic rupture of a road or rail tanker at atmospheric temperature and pressure may produce a flammable cloud with a diameter of 25 m. The size of this cloud is comparable to the radius of the pool. If a rail tanker ruptures in a pool fire, case history has shown that a fireball may occur, possibly coupled with relevant overpressure effects. If flammable liquids leak into a drainage- or sewer system, explosions may occur when the vapours are ignited.
Consequences of incidents in tunnels have not been considered in this study.
Modelling aspects
The model outcomes for the instantaneous release scenario, which according to the directive uses the full tank head, are not expected to be physically realistic. It is recommended to modify this part of the QRA directive by assuming a liquid head of 0 m height.
The consequence and risk calculations were carried out using n-hexane as a representative pure component for (liquid) flammable mixtures including gasoline. A first analysis with the ‘multi-component option in SAFETI-Professional showed that calculated consequence and risk distances may increase if a mixture such as (winter grade) gasoline is used instead of pure n-hexane. This ‘multi-component’ option is currently not available for risk calculations with SAFETI-NL.
Existing Safety Reports:
The installation scenarios in the safety reports of the largest Dutch oil storing companies include overfill as a possible release scenario. It was expected that an overfill may lead to a flash fire or a pool fire. The majority of the reported release scenarios involve leakages without ignition. To a lesser extend leakages followed by a fire are reported. The QRAs showed large differences in
outcomes, which is in accordance with previously performed benchmark studies for Dutch QRA calculations (for example [3]).
1
Introduction
On Sunday 11 December 2005 a number of explosions occurred at the Buncefield Oil Storage Depot in Hemel Hempstead, Hertfordshire, England. These explosions caused severe damage in the surrounding area. The explosion damage included structural damage to buildings located at 100 to 300 m distance from the site boundary of the storage depot. The explosions had the effect of a wake up call amongst the people responsible for the safety of storage facilities for liquid petroleum products. Prior to the incident the general opinion was that an explosion event following a release of gasoline from an atmospheric storage tank would be highly unlikely if not impossible.
During the months following the Buncefield incident Dutch public authorities wondered if the possibility of an explosion - and the corresponding damage effects - were sufficiently taken into account in the QRA calculations for land-use planning. This question was subsequently put in a broader context which may be summarised as follows:
Do the QRA distances for land-use planning around storage facilities for liquid petroleum products - calculated in accordance with prevailing Dutch guidelines for spatial planning - sufficiently reflect the risks that these facilities pose in reality?
This report intends to answer this question by considering the following issues:
1. What consequences are taken into account by present day guidelines for risk calculations? 2. What consequences and damage effects are taken into account in existing safety reports? 3. What are the consequences of incidents that occur at storage facilities for liquid petroleum
products?
4. Do the calculated consequences and damage effects match the consequences and damage effects that have occurred in reality?
These questions are addressed in the following chapters. It is noted that the Dutch land-use planning policy concerns risk, while the current investigation deals with consequences only. The reason is that risk involves frequencies and in order to determine a frequency, quantitative information on both accidents and presence of storage tanks and equipments throughout the years is needed. It was not feasible to retrieve this information within the scope of the current investigation.
The scope of this investigation is not to determine the cause of the Buncefield incident, nor to the determine the mechanism that led to the high overpressure in the main explosion. These questions will hopefully be answered by ongoing research commissioned by the Buncefield Major Incident Investigation Board.
It is further noted that the scope of this investigation is broader than the Buncefield incident alone. Though the Buncefield incident was the direct cause of the current investigation, lessons learned from other incidents should not be disregarded.
2
Dutch QRA guidelines and corresponding
outcomes
2.1
Introduction
The first step in the evaluation of the Dutch QRA directives for storage and transport of flammable liquids, is to analyse the assumptions and outcomes of risk calculations for several installation types, following the relevant guidelines [1] and [2]. The following six activities will be discussed:
1. storage installations inside SEVESO II establishments
2. loading and unloading activities inside SEVESO II establishments 3. road transport
4. rail transport
5. waterway transport (inland) 6. pipeline transport (underground)
Within the scope of this investigation oil and gasoline terminals was considered to be most relevant. Therefore, the risk is calculated for stationary installations (including loading/unloading activities) only. For the transportation of hazardous substances a qualitative study is performed. In this chapter the following results are reported for the following reasons.
− The distance to the individual risk (IR) contour IR 10-6/yr is reported because this corresponds to a limit value for spatial planning in the Dutch legislation [4]. Note: the Dutch definition of
individual risk is location dependent and is sometimes labelled location-based risk or locational risk.
− The distance to the IR 10-8/yr contour is reported because the population that is present in the area between the IR 10-6 and IR 10-8 contours usually determines the height of the societal risk (which needs to be accounted for by the responsible authorities according to [4]).
− The reported consequences follow the damage criteria of the guidelines: for a flash fire the (largest) distance to the LFL is reported, for an explosion the distance to 0.3 bar is reported and for jet- and pool fires the distance to 1% lethality is reported.
In the Netherlands, the software tool SAFETI-NL is prescribed for QRA calculations for land-use planning. Therefore, considerable attention is paid to various model aspects of SAFETI-NL. It is further noted that the scope of this chapter is limited to the outcomes of risk calculations that follow the Dutch risk assessment requirements. These requirements show a trade off between realistic outcomes and simplicity of the instrument (for example a limited number of distinguished installation types and a limited number of scenarios per installation type). A limited set of abstract scenarios is preferred in the generic approach, as long as the outcomes are not too far off from the risks calculated with a more sophisticated method. Whether the risk outcomes for oil and gasoline terminals can be regarded as sufficiently realistic, will be discussed in chapter 5. For the sake of
completeness it is also noted that the Dutch guidelines prescribe generic failure frequencies, presuming ‘current day practice’ facilities. The effect of frequency reducing measures is usually difficult to quantify and therefore it is difficult to take them into account in a QRA.
2.2
Storage installations at SEVESO II establishments
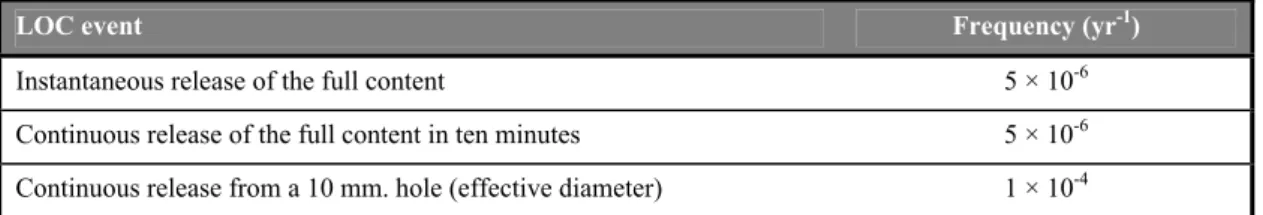
The guidelines for Dutch QRA calculations for stationary installations with hazardous substances are given by the ‘Handleiding Risicoberekeningen BEVI’ [2] (in 2009 version 3.2 of this ‘Reference Manual Bevi Risk Assessments’ was translated into English, see [43]). According to section C.3.6.3 of [2] the following Loss of Containment (LOC) events must be taken into account for a single containment atmospheric storage tank:
Table 1 Release scenarios and frequencies for a single containment atmospheric storage tank
LOC event Frequency (yr-1)
Instantaneous release of the full content 5 × 10⁻⁶
Continuous release of the full content in ten minutes 5 × 10⁻⁶
Continuous release from a 10 mm. hole (effective diameter) 1 × 10⁻⁴
Subsequent inputs for risk calculation, such as the consequence events to be used and the probabilities of immediate and delayed ignition, depend on the volatility of the flammable liquids. Two volatility classes are distinguished:
− Class 1 (K1) flammable liquids: liquids classified as highly flammable (category 7) in part 2 of Annex I of the EU Seveso II directive.
− Class 2 (K2) flammable liquids: liquids classified as flammable (category 6) in part 2 of Annex I of the EU Seveso II directive.
The risk outcomes will be discussed for these two classes separately. Class 1 (K1) flammable liquids
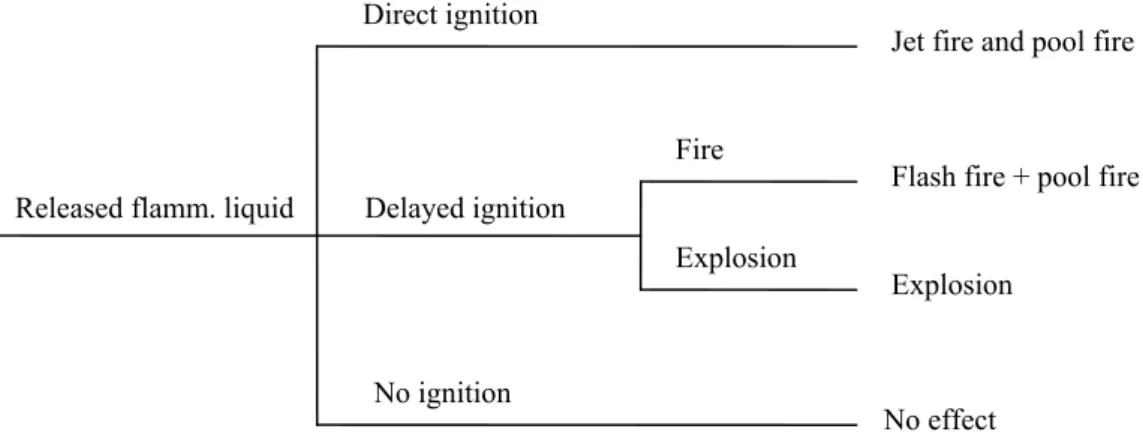
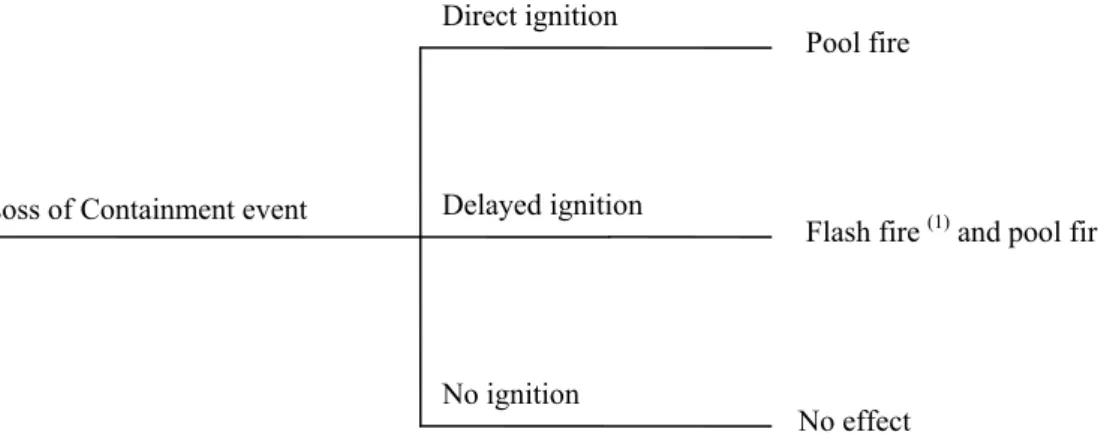
Figure 1 shows the event tree for an instantaneous release of class 1 (K1) flammable liquids from an atmospheric storage tank and Figure 2 shows the event tree for a continuous release. As shown in these figures, the released flammable liquid may ignite immediately, ignite after some delay or may not ignite at all. Direct ignition leads to a pool fire in case of an instantaneous release and to a combination of a pool fire and a jet fire in case of a continuous release. Delayed ignition may either result in a vapour cloud fire (flash fire) or a vapour cloud explosion. If a continuous release is still ongoing, a delayed ignition will also give an ignited liquid jet (jet fire), but this event is not considered in the event tree (Figure 2). The reason is that the distances for the ignited liquid jet will generally be significantly smaller than the distances for the accompanying pool fire.
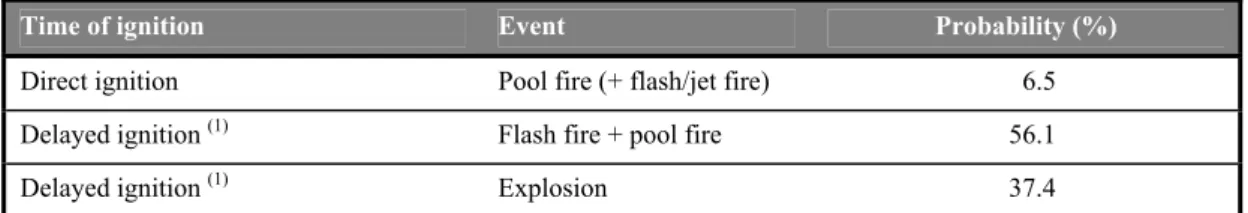
The probabilities corresponding to the routes in Figure 1 and Figure 2 are listed in Table 2. The probability of immediate ignition is 6.5% for class 1 flammable liquids. The probability of delayed ignition depends on the presence of ignition sources within the establishments and on the distance to the site boundary. According to the guidelines, a flammable cloud consisting of K1 vapours will
always ignite if the cloud crosses the site boundary (the ‘free field approach’). If a flammable cloud of K1 vapours does not reach the site boundary, the probability of delayed ignition may be smaller than presented in Table 2 (depending on the presence of ignition sources on site).
Direct ignition Immediate flash + pool fire (1) Delayed ignition Explosion Fire No ignition
Released flamm. liquid Flash fire + pool fire Explosion
No effect
(1) It may be argued that during the release a small fraction of the liquid vaporises. Direct ignition will
then give a small flash fire along with the pool fire. In general, the size of this immediate flash fire is negligible in comparison with the size of the pool fire. Further details are given in Appendix A.
Figure 1 Event tree for an instantaneous release of class 1 flammable liquids from a single containment atmospheric storage tank
Direct ignition
Jet fire and pool fire
Delayed ignition
Explosion Fire
No ignition
Released flamm. liquid Flash fire + pool fire Explosion
No effect
Figure 2 Event tree for a continuous release of class 1 flammable liquids from a single containment atmospheric storage tank
The parameters in Table 2 are prescribed for Dutch risk calculations. Other parameters are site specific and need to be interpreted in order to perform the risk calculations. These parameters as well as their interpretation and proposed values for risk calculations are given in Table 3.
Table 2 Ignition probabilities for a release of class 1 flammable liquids from a single containment atmospheric storage tank
Time of ignition Event Probability (%)
Direct ignition Pool fire (+ flash/jet fire) 6.5
Delayed ignition (1) Flash fire + pool fire 56.1
Delayed ignition (1) Explosion 37.4
(1) The listed probabilities apply when the LFL envelop crosses the site boundary. Otherwise the probability of
delayed ignition (flash fire or explosion) depends on the presence of ignition sources within the site boundary (ultimately no effect).
Table 3 Additional risk parameters (single containment atmospheric storage tank containing class 1 flammable liquids)
Parameter Interpretation
Substance
The risks of class 1 (K1) flammable liquids (for example gasoline) will be calculated with SAFETI-NL 6.53 using n-hexane as a representative substance.
Contents of the tank In this study vessels of 1000 m
3, 10,000 m3 and 50,000 m3 will be used (maximum liquid volume).
Storage conditions Atmospheric storage conditions (temperature 9 °C and absolute pressure 1 bar) are presumed.
Bund size
Bund height
Tank height
Small vessel (1000 m3):
− tank height 10.8 m (corresponding diameter 10.8 m) − bund surface area 2500 m2, bund height 1 m. Medium vessel (10,000 m3):
− tank height 14.7 m (corresponding diameter 29.4 m) − bund surface area 15,000 m2, bund height 2 m. Large vessel (50,000 m3):
− tank height 21.7 m (corresponding diameter 54.2 m) − bund surface area 30,000 m2, bund height 3 m. Distance to site boundary
It is expected that the distance to site boundary is of great importance for the risk outcomes for class 1 (K1) flammable liquids. Therefore two values will be used: 50 m and 150 m.
Surface roughness The Dutch default value of 300 mm is used.
Ignition sources It is assumed that no ignition sources are present within the LFL envelope on site.
Weather Dutch average weathers with uniform distribution over wind directions. (1) Appendix B will discuss to what extend consequence distances change if a mixture is used in the
calculations.
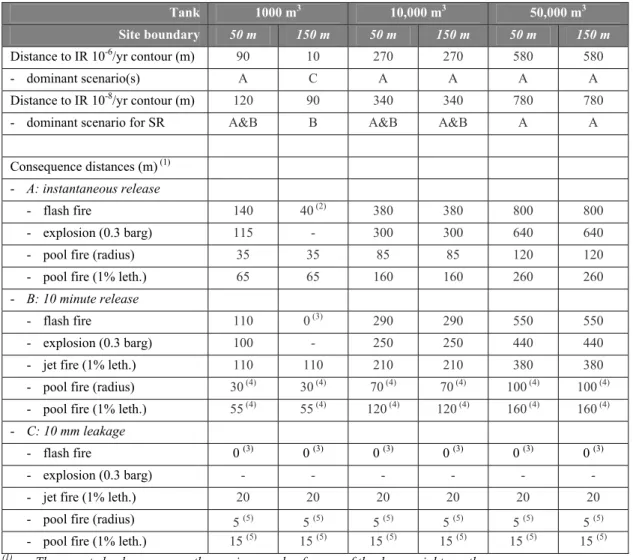
The risk calculation outcomes for the storage of class 1 (K1) flammable liquids are presented in Table 4.
Table 4 QRA results for single containment atmospheric storage tanks containing class 1 flammable liquids (current methodology)
Tank 1000 m3 10,000 m3 50,000 m3
Site boundary 50 m 150 m 50 m 150 m 50 m 150 m
Distance to IR 10-6/yr contour (m) 90 10 270 270 580 580
- dominant scenario(s) A C A A A A
Distance to IR 10-8/yr contour (m) 120 90 340 340 780 780
- dominant scenario for SR A&B B A&B A&B A A
Consequence distances (m) (1) - A: instantaneous release
- flash fire 140 40 (2) 380 380 800 800
- explosion (0.3 barg) 115 - 300 300 640 640
- pool fire (radius) 35 35 85 85 120 120
- pool fire (1% leth.) 65 65 160 160 260 260
- B: 10 minute release
- flash fire 110 0 (3) 290 290 550 550
- explosion (0.3 barg) 100 - 250 250 440 440
- jet fire (1% leth.) 110 110 210 210 380 380
- pool fire (radius) 30 (4) 30 (4) 70 (4) 70 (4) 100 (4) 100 (4)
- pool fire (1% leth.) 55 (4) 55 (4) 120 (4) 120 (4) 160 (4) 160 (4)
- C: 10 mm leakage
- flash fire 0 (3) 0 (3) 0 (3) 0 (3) 0 (3) 0 (3)
- explosion (0.3 barg) - - -
- jet fire (1% leth.) 20 20 20 20 20 20
- pool fire (radius) 5 (5) 5 (5) 5 (5) 5 (5) 5 (5) 5 (5)
- pool fire (1% leth.) 15 (5) 15 (5) 15 (5) 15 (5) 15 (5) 15 (5)
(1) The reported values concern the maximum value for any of the day or night weathers.
(2) Results for the ‘early flash fire’. Delayed ignition of the cloud does not occur in this scenario as the vapour
cloud does not reach the site boundary.
(3) Immediate ignition does not give a flash fire for a continuous scenario. Delayed ignition will not occur
because the cloud does not reach the site boundary and no ignition sources are assumed to be present on site.
(4) The pool radius for the ten minute release is smaller than the pool radius for the instantaneous release. An
instantaneous release is supposed to give bund overtopping. Therefore the pool size is set at 150% of the bund size. For the ten minute release, the (maximum) pool size is supposed to be equal to the bund size. The distance to 1% lethality further depends on the assumed rain out location, which may be significant for the instantaneous release. Further details are given in Appendix A.
(5) Results for the early pool fire. Late ignition of the (full grown) pool does not occur as the vapour cloud does
not reach the site boundary.
Table 4 shows that the instantaneous release scenario determines the location of the IR 10-6/yr contour and the height of the risk in the area outside the IR 10-6/yr contour (relevant for societal risk). Both the location of the IR 10-6 contour and the location of the IR 10-8 contour are largely determined by the delayed ignition of the cloud following an instantaneous release (giving a flash fire and an explosion, see Figure 1). For the 50,000 m3 tank, the size of the flammable cloud
(distance to LFL) is calculated to be 800 m (weather type F1.5). As will be discussed later in this report, this distance is not considered to be realistic.
Table 4 also shows jet fire results ranging from 110 m to 380 m (1% lethality) for the ten minute release. These jet fire distances are not regarded as realistic either for releases from atmospheric storage tanks. Fortunately, the jet fire outcomes turn out to be irrelevant for the location of the IR 10-6 to IR 10-8/yr contours.
More details on various modelling aspects and their influence on consequence and risk outcomes are given in section 2.8 and Appendix A.
Class 2 (K2) flammable liquids
Figure 3 shows the event tree for an instantaneous release of unheated class 2 (K2) flammable liquids from an atmospheric storage tank and Figure 4 shows the event tree for a continuous release. As shown in these figures, only immediate ignition is taken into account for the QRA. This will result in a pool fire and ignition. Ignition of vapours is also considered by the model, but the amount of vapour should be limited for a release of unheated class 2 flammable liquids. The probability of immediate ignition is 1 % (see Table 5).
Figure 3 only applies when class 2 flammable liquids are stored at a temperature below their flash point. If a class 2 flammable liquid is stored above its flash point, the event trees and probabilities of class 1 flammable liquids should be used (see Figure 1, Figure 2 and Table 2).
Pool fire + vapours (1) Direct ignition
(1) It may be argued that during the release a small fraction of the liquid vaporises. Direct ignition will
then give a small flash fire along with the pool fire. In general, the size of this immediate flash fire is negligible in comparison with the size of the pool fire. Further details are provided in Appendix A.
Figure 3 Event tree for an instantaneous release of class 2 flammable liquids (storage temperature below the flash point) from a single containment atmospheric storage tank
Table 5 Ignition probabilities for a release of class 2 flammable liquids (storage temperature below the flash point) from a single containment atmospheric storage tank
Time of ignition Event Probability (%)
Direct ignition Pool fire (+ flash/jet fire) 1
No ignition No effect 99
No effect No ignition
Released flamm. liquid
Direct ignition
Jet fire and pool fire
No ignition Released flamm. liquid
No effect
Figure 4 Event tree for a continuous release of class 2 flammable liquids (storage temperature below the flash point) from a single containment atmospheric storage tank
Table 6 Additional risk parameters (single containment atmospheric storage tank containing class 2 flammable liquids)
Parameter Interpretation
Substance
The risks of class 2 (K2) flammable liquids (for example kerosene) will be calculated using n-nonane.(1) A workaround was used in SAFETI-NL for K2 liquids because a small dissimilarity between SAFETI-NL and the Reference Manual Bevi Risk Assessments was discovered (2).
Contents of the tank In this study vessels of 1000 m
3, 10,000 m3 and 50,000 m3 will be used (maximum liquid volume).
Storage conditions Atmospheric storage conditions (temperature 9 °C and absolute pressure 1 bar(a)) are presumed.
Bund size
Bund height
Tank height
Small vessel (1000 m3):
− tank height 10.8 m (corresponding diameter 10.8 m) − bund surface area 2500 m2, bund height 1 m. Medium vessel (10,000 m3):
− tank height 14.7 m (corresponding diameter 29.4 m) − bund surface area 15,000 m2, bund height 2 m. Large vessel (50,000 m3):
− tank height 21.7 m (corresponding diameter 54.2 m) − bund surface area 30,000 m2, bund height 3 m.
Distance to site boundary The distance to the site boundary is irrelevant for class 2 flammable liquids as delayed ignition is not supposed to occur (see Table 5)
Surface roughness The Dutch default value of 300 mm is used.
Ignition sources It is assumed that no ignition sources are present within the LFL envelope on site.
Weather Dutch average weathers with uniform distribution over wind directions. (1) Appendix B will discuss to what extend consequence distances change if a mixture is used in the
calculations.
(2) According to the Reference Manual, delayed ignition of class 2 flammable liquids with storage temperature
below the flash point will not occur (see Table 5). In SAFETI-NL 6.53 delayed ignition is taken into account if a flammable cloud (concentration above the lower flammable limit) meets an ignition source or crosses site boundary. This dissimilarity was circumvented by reducing the probability of a release by a factor 0.01 (i.e. the probability of immediate ignition) and setting the probability of immediate ignition to 1.
The risk calculation outcomes for the storage of class 2 (K2) flammable liquids are presented in Table 7. An IR 10-6/yr contour does not occur because the probability of ignition is low (1%). The location of the IR 10-8/yr contour depends on the size of the pool fire. On closer inspection, the IR 10-8 contour is almost identical to the 100% lethality contour of the largest pool fire. This largest pool fire occurs for the instantaneous release scenario, due to the assumption of bund overtopping (see Table 6). Significant consequence distances are found for the immediate flash fire (200 m for the 50,000 m3 tank). As will be discussed later in this report, this effect distance is not considered to be realistic.
Table 7 QRA results for single containment atmospheric storage tanks containing class 2 flammable liquids (current methodology)
Tank 1000 m3 10,000 m3 50,000 m3
Distance to IR 10-6/yr contour (m) - - -
- dominant scenario(s) - - -
Distance to IR 10-8/yr contour (m) 40 110 185
- dominant scenario for SR A&B A A
Consequence distances (m) (1) - A: instantaneous release
- flash fire 35 (2) 85 (2) 200 (2)
- explosion (0.3 barg) - - -
- pool fire (radius) 35 85 120
- pool fire (1% leth.) 70 170 290
- B: 10 minute release
- flash fire 0 (3) 0 (3) 0 (3)
- explosion (0.3 barg) - - -
- jet fire (1% leth.) 20 40 70
- pool fire (radius) 30 (4) 70 (4) 100 (4)
- pool fire (1% leth.) 55 (4) 100 (4) 160 (4)
- C: 10 mm leakage
- flash fire 0 (3) 0 (3) 0 (3)
- explosion (0.3 barg) - - -
- jet fire (1% leth.) 5 5 5
- pool fire (radius) 10 10 10
- pool fire (1% leth.) 40 40 40
(1) The reported values concern the maximum value for any of the day or night weathers.
(2) Results for the ‘early flash fire’. Delayed ignition of the cloud is expected not to occur (see Table 5),
presuming no ignition sources are present on site.
(3) Immediate ignition does not give a flash fire for a continuous scenario. Delayed ignition is expected not to
occur (see Table 5), presuming no ignition sources are present on site.
(4) The pool radius for the ten minute release is smaller than the pool radius for the instantaneous release. An
instantaneous release is supposed to give bund overtopping. Therefore the pool size is set at 150% of the bund size. For the ten minute release, the (maximum) pool size is supposed to be equal to the bund size. The distance to 1% lethality further depends on the assumed rain out location, which may be significant for the instantaneous release. Further details are given in Appendix A.
2.3
Loading and unloading activities
The requirements for Dutch QRA calculations for loading and unloading activities are (also) given by [2]. Table 8 lists the LOC events that must be taken into account for loading activities. This table is based on the assumption that the loading/unloading activities use arms instead of hoses and that no blocking systems are present. This is a conservative approach. Table 9 lists the LOC events that apply for the corresponding presence of transport units in the loading area.
The events that may follow a release of flammable liquid, and their relative probabilities, are assumed to be identical to releases from storage tanks (Figure 2 and Table 2 for a continuous release of class 1 (K1) flammable liquids and Figure 4 and Table 5 for a continuous release of unheated class 2 (K2) flammable liquids). Further site specific parameters are listed in Table 10. No calculations are carried out for transfer to or from road and rail tankers. It is assumed that this transfer will generally not be dominant for the IR 10-6/yr contour or societal risk as the quantities involved are significantly lower than the transfer to/from ships.
Table 8 Release scenarios and frequencies for loading activities
LOC event Frequency
Full bore rupture of the loading/unloading arm (1) 3 × 10⁻⁸ /hr
Leak from loading/unloading arm (2) 3 × 10⁻⁷ /hr
Additional event for atmospheric road and rail tankers:
Instant. release due to engulfing fire (resulting in pool fire) 5.8 × 10⁻⁹ /hr (1) It is assumed that the release rate in case of a full bore rupture is 150% of the ordinary pump flow rate. (2) This scenario is modelled as a leak with an effective diameter of 10% of the arm diameter.
Table 9 Release scenarios and frequencies for on site transport units
LOC event Frequency
Atmospheric road / rail tankers:
Instantaneous release of full content 1×10⁻⁵/yr (1)
Continuous release of full content from largest connection 5×10⁻⁷/yr (1)
Single hull vessels:
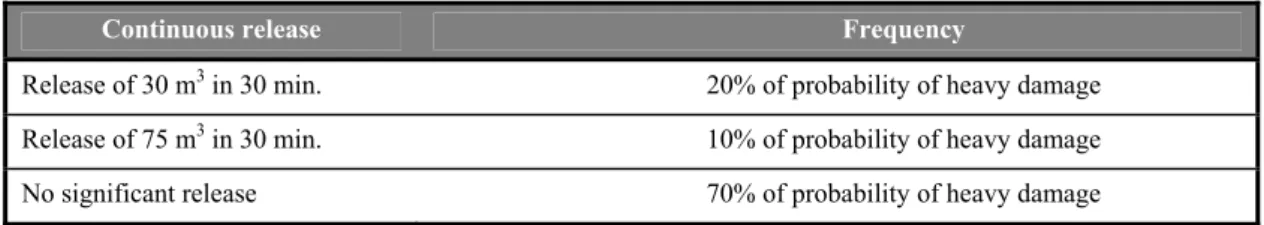
Continuous release of 75 m3 in 1800 s 10% of probability of heavy damage (2) Continuous release of 20 m3 in 1800 s 20% of probability of heavy damage (2)
No significant release 70% of probability of heavy damage (2)
(1) To be multiplied by the time fraction of presence.
(2) The probability of heavy damage can be assessed using a formula from section 3.14.3 of [2] (also [43]).
Table 10 Additional parameters needed for risk calculations for loading activities
Parameter Interpretation
Substance
The risks of class 1 flammable liquids (for example gasoline) will be calculated with SAFETI-NL 6.53 using n-hexane as a representative substance. The risks of class 2 flammable liquids (for example kerosene) will be calculated using n-nonane. A workaround was used in SAFETI-NL for class 2 flammable liquids because a small dissimilarity between SAFETI-NL and the Reference Manual Bevi Risk Assessments was discovered (1).
Pump flow rate
Loading arm diameter
Pump pressure (g)
Pump flow rates for transfer to/from vessels vary from 100 m3/hr to 3000 m3/hr. Loading arm diameters vary from 6” to 36”. The pump pressure may be as high as 10 bar.
Low flow rate (100 m3/hr):
− the flow rate equals 19 kg/s (K1) or 22 kg/s (K2) − a loading arm diameter of 6” (15 cm) is assumed − a pump pressure of 3 bar (gauge) is assumed Average flow rate (500 m3/hr):
− the flow rate equals 97 kg/s (K1) or 111 kg/s (K2) − a loading arm diameter of 10” (25 cm) is assumed − a pump pressure of 3 bar (gauge) is assumed Higher flow rate for gasoline (1500 m3/hr):
− the flow rate equals 291 kg/s (K1) or 333 kg/s (K2) − a loading arm diameter of 12” (30 cm) is assumed − a pump pressure of 3 bar (gauge) is assumed
− two loading arms are used simultaneously (the flow rate is divided between the two and the probability of a spill is doubled)
High flow rate for crude oil (3000 m3/hr): − the flow rate equals 583 kg/s (K1)
− a loading arm diameter of 36” (91 cm) is assumed − a pump pressure of 10 bar (gauge) is assumed Time fraction
In order to put the risks of loading/unloading activities in perspective with the risks of a single storage tank, it is assumed that loading or unloading activities takes place during 10% of the time (that is 876 hours per year).
Location of the jetty It is assumed that the jetty area is separated from the main waterway in such a way that the probability of heavy damage due to a collision is negligible.
Distance to site boundary
It is expected that the distance to site boundary is of great importance for the risk outcomes. Two values will be used: 50 m and 150 m.
Ignition sources It is assumed that no ignition sources are present within the LFL envelope on site. Pool size It is assumed that the size of the pool is not restricted by a bund.
Surface roughness The Dutch default value of 300 mm is used.
Weather Dutch average weathers with uniform distribution over wind directions.
(1) According to the Reference Manual, delayed ignition of class 2 liquids stored at atmospheric temperature
will not occur (see Table 5). In SAFETI-NL 6.53 delayed ignition is taken into account if a flammable cloud (concentration above the lower flammable limit) meets an ignition source or crosses the site boundary. This dissimilarity was circumvented by reducing the probability of a release by a factor 0.01 (i.e. the probability of immediate ignition) and setting the probability of immediate ignition to 1.
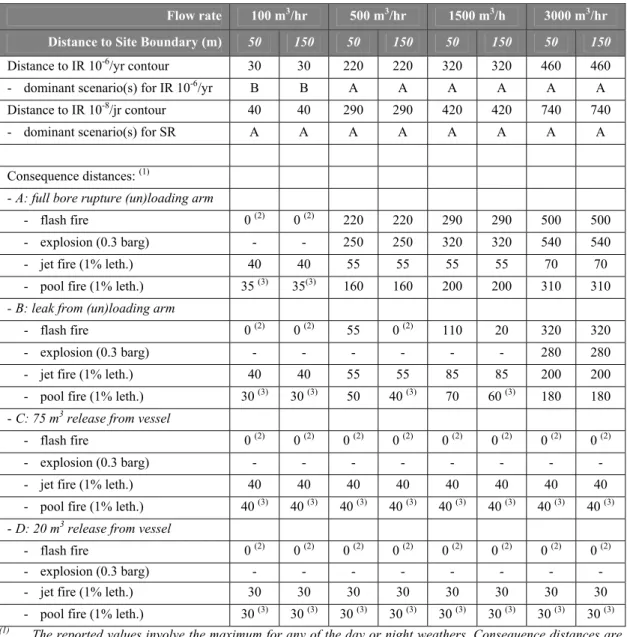
Table 11 shows the results for the loading/unloading of class 1 flammable liquids to or from a ship. The distance to the IR 10-6/yr contour increases from 30 m for a low flow rate to 500 m for a high flow rate. Both the location of the IR 10-6 contour and the location of the IR 10-8 contour are largely determined by the delayed ignition of the cloud following a full bore rupture of the loading arm (giving a flash fire and an explosion, see Figure 2). For the transfer of 3000 m3 crude oil per hour, the size of the flammable cloud (distance to LFL) is calculated to be 500 m.
It needs mentioning that neither limitation of the pool size nor the presence of an automatic blocking system were considered. As a result, the maximum pool diameter was over 500 m (for a flow rate of 3000 m3/hr). This pool size is not expected to be realistic. The effect of a limitation of the pool size is discussed in section 2.8 and Appendix A. It turns out that a reduction of the pool size leads to a considerable decrease of the distance to the IR 10-6 and IR 10-8 contours. The presence of an automatic blocking system will also reduce the size of the pool because the release duration will be limited to 120 seconds, and gives a similar decrease of risk contour distances. For reasons of completeness, it is also mentioned that the reported jet fire effects for the leaks in the loading arm are likely to be overconservative (according to the models, the 3.6″ diameter leak in the 36″ diameter pipeline produces 1% lethality at 200 m distance). As was the case for the storage tanks, the jet fire effects are irrelevant for the location of the 10-6 and 10-8/yr individual risk contours (the likelihood of an immediate ignition with jet fire is only 6.5%).
The consequence distances for the release of 75 m3 and 20 m3 from a single hull vessel are reported for reasons of completeness. As the hazard of heavy damage due to a collision is expected to be negligible (see Table 10), these two scenarios are not included in the risk calculations.
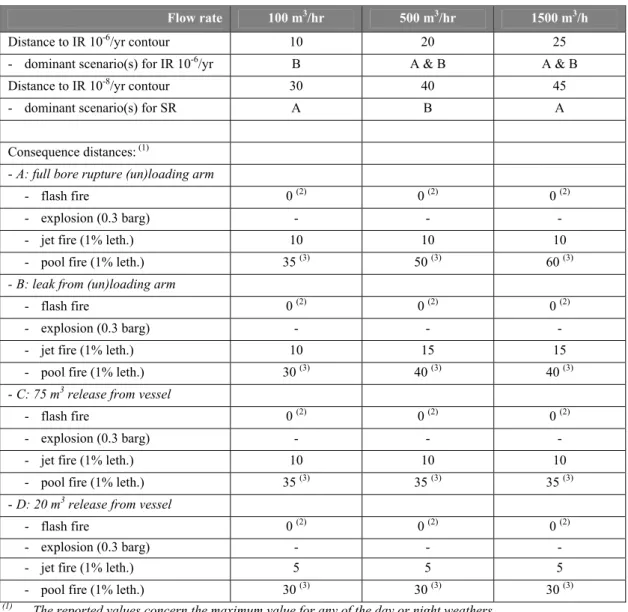
Table 12 shows the results for the loading/unloading of class 2 flammable liquids to or from a ship. The location of the IR 10-6/yr contour is largely determined by the leak scenario and does not exceed 25 m. Rupture of the arm will be more important if transfer activities takes place more than 25% of the time. The IR 10-8/yr contour entirely depends on the rupture scenario and has a maximum distance of 45 m in case of the transfer of 1500 m3 K2 liquids per hour. The pool fire and thereby the size of the pool, are dominant for all risk outcomes.
Table 11 QRA results for unloading from ships or loading to ships (class 1 flammable liquids)
Flow rate 100 m3/hr 500 m3/hr 1500 m3/h 3000 m3/hr
Distance to Site Boundary (m) 50 150 50 150 50 150 50 150
Distance to IR 10-6/yr contour 30 30 220 220 320 320 460 460
- dominant scenario(s) for IR 10-6/yr B B A A A A A A
Distance to IR 10-8/jr contour 40 40 290 290 420 420 740 740
- dominant scenario(s) for SR A A A A A A A A
Consequence distances: (1)
- A: full bore rupture (un)loading arm
- flash fire 0 (2) 0 (2) 220 220 290 290 500 500
- explosion (0.3 barg) - - 250 250 320 320 540 540
- jet fire (1% leth.) 40 40 55 55 55 55 70 70
- pool fire (1% leth.) 35 (3) 35(3) 160 160 200 200 310 310
- B: leak from (un)loading arm
- flash fire 0 (2) 0 (2) 55 0 (2) 110 20 320 320
- explosion (0.3 barg) - - - 280 280
- jet fire (1% leth.) 40 40 55 55 85 85 200 200
- pool fire (1% leth.) 30 (3) 30 (3) 50 40 (3) 70 60 (3) 180 180
- C: 75 m3 release from vessel
- flash fire 0 (2) 0 (2) 0 (2) 0 (2) 0 (2) 0 (2) 0 (2) 0 (2)
- explosion (0.3 barg) - - -
- jet fire (1% leth.) 40 40 40 40 40 40 40 40
- pool fire (1% leth.) 40 (3) 40 (3) 40 (3) 40 (3) 40 (3) 40 (3) 40 (3) 40 (3) - D: 20 m3 release from vessel
- flash fire 0 (2) 0 (2) 0 (2) 0 (2) 0 (2) 0 (2) 0 (2) 0 (2)
- explosion (0.3 barg) - - -
- jet fire (1% leth.) 30 30 30 30 30 30 30 30
- pool fire (1% leth.) 30 (3) 30 (3) 30 (3) 30 (3) 30 (3) 30 (3) 30 (3) 30 (3) (1) The reported values involve the maximum for any of the day or night weathers. Consequence distances are
derived along the downwind axis. The maximum consequence distance may be larger as this can be a diagonal of a downwind and a perpendicular component. This also explains why the distance to the IR 10-8/yr contour can be larger than the largest consequence distance reported in the table.
(2) Immediate ignition does not give a flash fire for a continuous scenario. Delayed ignition will not occur
because the cloud does not reach the site boundary and no ignition sources are assumed to be present on site.
(3) Results for the early pool fire. Late ignition of the (full grown) pool does not occur as the vapour cloud does
not reach the site boundary.
Table 12 QRA results for unloading from ships or loading to ships (class 2 flammable liquids)
Flow rate 100 m3/hr 500 m3/hr 1500 m3/h
Distance to IR 10-6/yr contour 10 20 25
- dominant scenario(s) for IR 10-6/yr B A & B A & B
Distance to IR 10-8/yr contour 30 40 45
- dominant scenario(s) for SR A B A
Consequence distances: (1)
- A: full bore rupture (un)loading arm
- flash fire 0 (2) 0 (2) 0 (2)
- explosion (0.3 barg) - - -
- jet fire (1% leth.) 10 10 10
- pool fire (1% leth.) 35 (3) 50 (3) 60 (3)
- B: leak from (un)loading arm
- flash fire 0 (2) 0 (2) 0 (2)
- explosion (0.3 barg) - - -
- jet fire (1% leth.) 10 15 15
- pool fire (1% leth.) 30 (3) 40 (3) 40 (3)
- C: 75 m3 release from vessel
- flash fire 0 (2) 0 (2) 0 (2)
- explosion (0.3 barg) - - -
- jet fire (1% leth.) 10 10 10
- pool fire (1% leth.) 35 (3) 35 (3) 35 (3)
- D: 20 m3 release from vessel
- flash fire 0 (2) 0 (2) 0 (2)
- explosion (0.3 barg) - - -
- jet fire (1% leth.) 5 5 5
- pool fire (1% leth.) 30 (3) 30 (3) 30 (3)
(1) The reported values concern the maximum value for any of the day or night weathers.
(2) Immediate ignition does not give a flash fire for a continuous scenario. It is assumed that delayed ignition
will not occur (see Table 5).
(3) Results for the early pool fire. It is assumed that late ignition of the (full grown) pool will not occur (see Table 5).
2.4
Road transportation
The risks of road transportation depend linearly on the number of road tanker movements. The requirements for Dutch QRA calculations for road transportation are given in Part 2 of the Purple Book [1] and are calculated with RBM II. The scenarios and consequences are assumed to apply to open situations, influences of objects like tunnels and noise barriers are not taken into account. Guidance on how to use RBM II for these situations is given in [5].
According to section 3.2 of Part 2 of the Purple Book, the following LOC events must be considered for road transportation with atmospheric tankers:
Table 13 Release scenarios and frequencies for a road tanker (transportation risk)
LOC event Frequency
Release of the complete inventory (instantaneous) 15% of base frequency Release of 5 m3 of the inventory (instantaneous) 60% of base frequency Release of 0.5 m3 of the inventory (instantaneous) 25% of base frequency
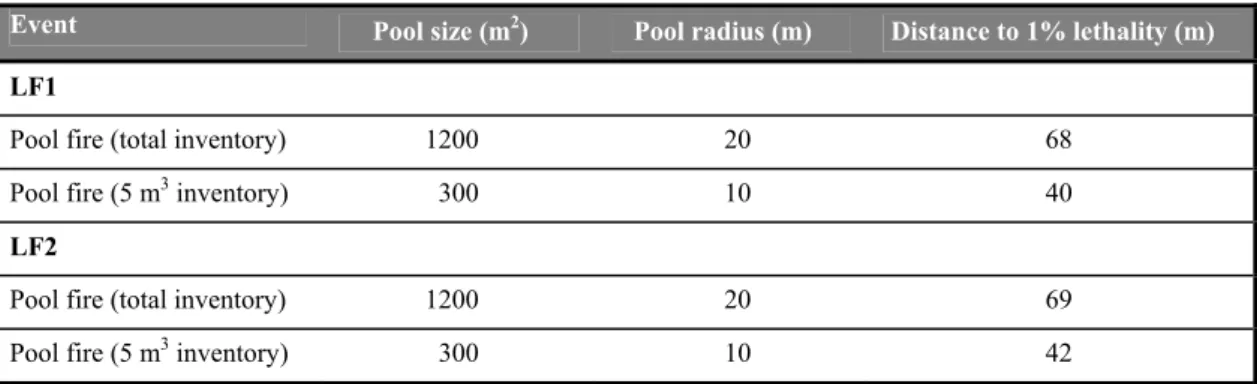
The release of the total inventory of a road tanker is assumed to result in a liquid pool with a surface of 1200 m2. The release of 5 m3 of flammable liquid results in a pool with a surface of 300 m2. These data are reportedly experimentally verified [6].
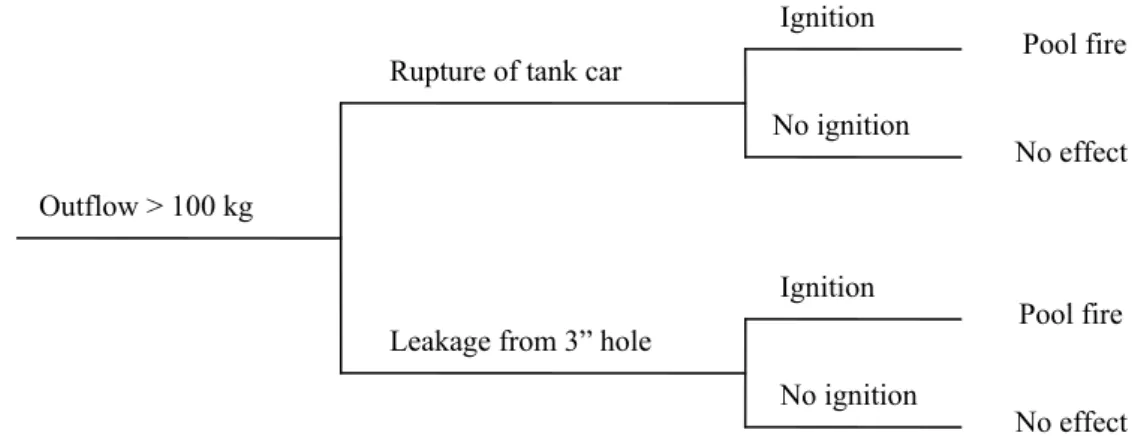
Ignition Pool fire Release of 5 m3 No ignition Ignition No ignition Release of 0.5 m3 Release of total inventory
Outflow > 100 kg
No effect Pool fire No effect
No significant effect
Figure 5 Event tree for a significant release of flammable liquids from a road tanker
Figure 5 shows the event tree for the release of flammable liquids (according to the guidelines). A release of more than 0.5 m3 may ignite and give a pool fire. No other effects are considered.