CHEMICAL ENGINEERING
TRANSACTIONS
VOL. 48, 2016
A publication of
The Italian Association of Chemical Engineering Online at www.aidic.it/cet Guest Editors:Eddy de Rademaeker, Peter Schmelzer
Copyright © 2016, AIDIC Servizi S.r.l.,
ISBN 978-88-95608-39-6; ISSN 2283-9216
Societal Risk and Urban Land Use Planning: Creating Useful
Pro-Active Risk Information
Robert Geerts*
a, Jan Heitink
a, Leendert Gooijer
b, André van Vliet
b, Reinoud
Scheres
a, Dirk-Jan de Boer
caAVIV Institue for Risk Analysis, Land Use Safety and Risk Management, Enschede, Netherlands bRIVM, National Institute for Public Health and the Environment, Bilthoven, Netherlands
CBSafe, Netherlands
r.geerts@aviv.nl
The Netherlands have a long tradition of using a quantitative risk approach in urban land use planning. By law, local authorities have to establish land use plans. These plans hold the rules, conditions and criteria for land use in order to result in proper spatial planning. In the densely populated and industrialized country of the Netherlands this is not an unnecessary luxury. In the process of establishing land use plans or making formal adjustments to these plans, local authorities have to consider the societal risk, associated with these plans explicitly. For this purpose calculation of the so called F,n-curve is demanded by law. The F,n curve is the quantitative expression of the societal risk. There is a widespread misconception about the use of the curve by Dutch local authorities. It is not a statutory quantitative risk acceptance criterion. Instead the F,n-curve is one source of information among others to weigh the benefits of a new development against the risks that come with it. The existing curve is compared with the new F,n-curve that incorporates the new development .
Over the last 10 years, experience has shown that government officials consider the F,n-curve as too abstract a piece of information. Its ability to express safety matters relevant for the decision at hand is considered to be too limited. As a result the F,n-curve does not support transparent decision making and weighing the pros and cons of the spatial developments. The authors propose the use of narrative information, derived from the F,n-curve for decision making. This can be done by decomposing the F,n-F,n-curve and selecting some representative accident scenario's.
In this way concentric zones may be drawn around the risk source (in case of transport routes parallel zones). These zones correspond to a specific physical effect that may occur after the release of the substance. Because the physical effect results in specific damage consequences it also corresponds to the impact on societal risk resulting from a new development. These possible impacts may be ranked according to their relative contribution to the F,n curve. So in addition to the F,n-curve local authorities may use simple geographic map information linked to concrete damage phenomena. The zones, if selected properly, tell the stakeholders what damage consequences may result from their location choices. The zoning tells them where the impact of a new development on societal risk changes from high to medium, to low and finally can be disregarded and why this is the case. Narrative information derived from the F,n-curve can assist in making decisions more transparent. The crux is that a zone-limit marks the transition in the degree of protection a building offers to the exposed person. The current policy development in the Netherlands is inclined towards a more effects-based approach.
1. The way it is done thus far
The use of Quantitative Risk Assessment (QRA) to incorporate societal safety in urban development decision making in the Netherlands goes back to the early eighties of the last century. In the Netherlands planning and managing land use has a long tradition and is regulated legally in a rather sophisticated and complex legislation. This is no surprise. Land for housing, office buildings, recreation and industry is scarce and as a result the population density is among the highest in Europe. This poses a problem when industry, using large
DOI: 10.3303/CET1648160
Please cite this article as: Geerts R., Heitink J., Gooijer L., Van Vliet A., Scheres R., De Boer D., 2016, Societal risk and urban land use planning: creating useful pro-active risk information, Chemical Engineering Transactions, 48, 955-960 DOI:10.3303/CET1648160
amounts of hazardous substances, is developing fast near densely populated areas. The industrial development triggers an increase in transport of hazardous substances through cities. To put the Dutch problem into perspective and in a societal risk context, in the Netherlands on average a ratio of one to five citizens daily work and/or live within the vicinity of an activity with hazardous substances. Here they are exposed to the (very small but nevertheless real) probability of dying due to a disaster with that substance (Geerts, Heitink, 2002, p 163). Until 2014 several office buildings of the ministries in The Hague were located alongside a main traffic road also used for the transport of hazardous substances (most of which are flammable gases like LPG but also flammable liquids). The municipality of The Hague decided to redirect the transport to avoid this road for specific hazardous substances like LPG in order to protect the population alongside the road and the civil servants working in the ministry office building.
The Dutch regulation of legal plans to allow developments for building areas is based on QRA. This concerns housing, office buildings, public buildings etc. exposed to the hazards of industrial activities and of course vice versa where new industrial activities are allowed near existing population. The advantage of setting numeric risks as a legal standard for the personal safety of civilians will be clear. Once the standard has a legal status one can calculate whether the distance drawn on the map to allow land use for e.g. residential areas is
sufficient to meet the personal safety standard. In the Netherlands this standard has been set at 10-6 per year
and is expressed by a risk measure called ‘Plaatsgebonden Risico’ (PR). This measure has the same meaning and function as the widely known concept of individual risk. That is to establish a limit to the probability for the individual to die from some kind of specific risk activity. The PR (translated: location specific risk) is calculated assuming 24/7 presence of a person at any point near the risk source without any protection whatsoever. So in fact only the probability of the occurrence of a lethal effect at some distance from the risk source is calculated. Therefore the PR is always substantially higher than the actual risk of an individual. Besides safeguarding the low individual fatality rate local government also has to deal with the societal risk of land use plans. This means that the low-probability-high-consequence risk of dozens of citizens dying all at once by a hazardous substance calamity requires more and additional considerations for concluding its acceptability than the separate death of individuals. This societal risk (in Dutch: “groepsrisico”) has to be taken into consideration by local government in decisions on new spatial developments.
The law demands a QRA to calculate the impact of new urban projects or new transport routes for dangerous substances by showing the F,n curves of the existing and new situation. Local government has to explain why public responsibility can be taken, from a societal point of view, to accept the risk associated with the proposed development. In contrast with the PR the societal risk has no legal threshold value for its acceptability. Instead a reference value is defined that may be designated as a “calibration value”. This
calibration value is expressed as 10-2/n2 for transport routes and 10-3/n2 for hazardous installations, where n
denotes the calculated number of fatalities. For transport routes the risk considered is per unit length (one kilometer). Where do these expressions stem from? They are based on the results of extensive exploring studies to the consequences of setting a specific reference value for this low-probability-large-consequence societal risk. The studies were assigned by the Dutch Ministry of Housing, Spatial Planning and the Environment in the mid-eighties. Now we can conclude from practice, based on many QRA’s, that few F,n curves exceed the calibration value or as we prefer to name it their ‘high water mark’.
Figure 1 illustrates what information should be used legally in the decision making process. In the example a high pressure natural gas pipeline is the risk source. Figure A denotes the area where the probability of dying -given a major release accident with a hazardous substance- is above 1%. Figure B denotes the demarcation between the area where buildings catch fire (when the pipeline ruptures followed by ignition of the gas resulting in a jet fire) and the area where buildings don’t catch fire. This demarcation relates to fatalities as follows. For the area where buildings will be burning a 100% fatality rate is assumed. The area outside this so called 100% fatality region has no fatality rate for people residing inside a building. People in the street still have a probability of dying from skin burns. Figure C shows the F,n curve: the cumulative probability of at least n fatalities in the area shown in Figure A.
2. The conventional wisdom of the local authorities and policy makers about the F,n curve
Galbraith (1958, 1998) introduced the term conventional wisdom in his famous The Affluent Society. An important feature of Galbraith’s conventional wisdom is that it is not relevant whether what we think about the social reality is true or true knowledge. Instead far more important is whether what we think about the social reality is useful. Conventional wisdom describes very well how local government,-responsible for the decision making on accepting the change in societal risk- expresses its opinion about the usefulness of the F,n curve, i.e. the information presented in figure 1. According to the conventional wisdom of the mayor, the aldermen and the local council the societal risk presented by the F,n curve “doesn’t fit” within the planning and decision process (Haskoning, 2012). Moreover, the Haskoning 2012 study reports, the F,n curve is considered “too
abstract to understand” and to anticipate the changes in the societal risk on realizing new urban projects. So local government has its conventional arguments to avoid the discussion on the acceptability of the (increase in) societal risk. It stops by just presenting the legally required information without further weighing the changes in the risk or the possibilities of reducing it against the societal advantages of the new development. This weighing process is explicitly intended by the legislator.
Local authority focuses on the PR because this risk is drawn on planning maps and thus showing that safety for the civilian is granted. Conceptually it is hard to understand how societal risk may arise as a problem when at the same time one can state that the development meets the legally required safety. The later however concerns the individual and not the community at large where in case of a disaster long term social disruption plays an important role.
In the Netherlands new legal rules on spatial planning and development are being discussed now. Government has decided that the decision making should become more transparent and less complex. New laws are being prepared to realize this challenging task. This has restarted the discussion on the usability of the F,n curve as representing the societal risk.
Figure 1: Risk information used in spatial planning
3. Understanding and anticipating societal risk in urban planning
Our main effort is aimed at a broad understanding by the layman how societal risk is constituted by the build-up areas in the vicinity of a risk source. Understanding societal risk starts by using the narrative approach. It is not very difficult to understand the principle that the sudden release of a dangerous substance comes along with a specific harmful effect. This may be the blast of an explosion, the heat energy of a fire or the toxic concentration in breathing air. The mechanical impact of fragments from bursting vessels is normally not considered as contributing to the F,n curve based on a probability argument.
To understand societal risk we decompose the F,n curve into a some of its most relevant accident scenario’s. For example when calculating the societal risk of a LPG fueling station the analyst has to take into account over ten accident scenario’s. These are related to the LPG-storage tank and the LPG truck. However when picturing societal risk we are only interested in the small-probability-large-consequence risk scenarios. In the Netherlands by convention a large consequence designates ten or more fatalities. So one has to select a proper but small set of scenarios related to the specific installations. In this case the installations are the storage tank and the truck. These installation-scenarios are related to the F,n curve. If selected well the scenarios result in a good enough approximation of the F,n curve. Good enough for the purpose of decision making regarding the uncertainties the risk analyst unavoidably encounters when modelling the risks. This is an important aspect in the communication of the risk to the people who will use the information to plan the building locations in the established risk zones: QRA of small-probability-large-consequence risks is the result of applied science so the models used are approximations of what can happen when dangerous substances are suddenly released (Ale, of applied science so the models used are approximations of what may happen when dangerous substances, 2009).
New development
Societal risk Calibration value (CV)
Frequencies < 10% CV Risk area
Fig. A
Fig. B
Fig. C
Fig. C shows societal risk by the F,n-curve. The
high water mark (CV) is shown. Less than 5% of the curves exceed the CV.
Fig. A shows a new development within a risk area of a pipeline. (Risk area is
grey shaded around pipeline, presented as black line N-S directed)).
Fig. B zooms in to new development and surrounding). Areas and population
present (day and night) are defined for the calculation. (Pipe line presented as dotted line)
Figure 2 shows the distances of seven of the most relevant accident scenarios for an LPG fueling station. The distances represent the transition from severe damage to buildings to moderate damage. In the moderate damage regime people inside buildings are sufficiently protected. Figure 2 shows these distances can be grouped. Notice the relative small differences in distances of some of the scenarios. Accident scenario I encompasses accident scenarios III.1 /III.2 /III.3. This scenario I is the storage vessel rupture followed by an explosion of the unconfined vapour cloud. Scenario I has a higher probability of occurrence than the other scenarios. From calculations it appears that taking 100 meter as the radius of zone one (scenario I) and 155 meter as radius for zone two (scenario II.3 BLEVE of the truck) we get a fair approximation of the F,n curve. To these distances real accident scenarios correspond which can be understood by the layman. No mathematics in communication are required. Using this principle, illustrated by the example of the LPG fueling station, one can visualize the risk sources of dangerous substances on a city map with its corresponding zones. In the Netherlands this information can readily be made available. There is a legal obligation for local authorities to identify all relevant risk sources and make these data public. Besides QRA’s are available of all risk sources so in principle it’s a limited effort to establish the zones in relation to the accident scenarios that determine societal risk.
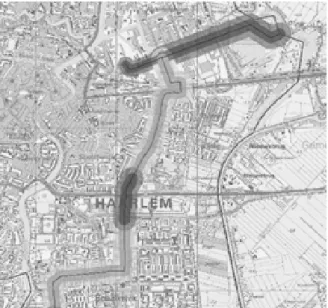
An example of such a map (cut out) is shown in figure 3. The outer border of the relative lighter shaded areas are defined by the criterion of 1% probability of dying given a fatal effect (resulting from the largest release of the hazardous substance). Within this border the zones are drawn (in this example shown by darker shaded areas). The difference between the darker grey and lighter grey shaded areas shown in figure 3 only present
60 80 100 120 140 160 DISTANCE [m] LOCATION
LPG
TRUCK(60
M3)
STORAGE VESSEL(20
M3)
Acc
.
SCE N ARI OIII.1
Acc
.
SCENARIOIII.2
Acc
.
SCENARIOIII.3
Acc
.
SCENARIOI
Acc
.
SCENARIOII.1
Acc
.
SCENARIOII.2
Acc
.
SCENARIOII.3
SMALL
-
PROBABILITY-
LARGE-
CONSEQUENCE RISK SCENARIOSFigure 2: Distances of devastating effects on buildings per accident scenario of a LPG fuel station
the difference in societal risk compared to its calibration value. The dimensions of the risk zones do not differ between these areas, because in this example they are related to the same risk source.
4. A framework of policy guidelines is needed
So local government can acquire its risk areas map with the risk zones drawn for the purpose of decision making on the acceptance of societal risks. But only when policy guidelines are formulated in agreement with societal risk levels and safety goals, established on a community level, urban planning can develop accordingly. This framework should be accomplished by political decision making by the civil administration that is legally appointed to decide on urban planning. The big advantage of establishing this framework for spatial urban planning is its pro-active information base. Private parties wishing to invest in building projects can estimate together by civil servants who prepare the decision what the prospects of the projects are regarding the societal safety aspects. In the discussion on the usefulness of the F,n curve, as an expression of societal risk, local authorities have argued that the drawback of the curve is the lack of its anticipating capability on assessing the changes in risk which will arise by building project concepts as proposed by (private) investment parties.
For example, the policy framework may be based on the risk matrix concept as shown in figure 4. Here, in principle for each risk area, criteria may be given for the possibilities or constraints for future developments. The criteria and/or guidelines for further developments in the areas of the mapped risk zones can for example be given as the maximum total number of people daily present in the specific risk zone. Exceeding this maximum should only be possible when very important advantages are at stake for the local community. Of course other criteria are possible such as the specific function of the buildings like regional hospitals which create an important societal infrastructure. These types of buildings or projects should therefore be considered carefully with respect to their projection in risk areas. These types of considerations may be made by the responsible administration to establish the decision framework. We emphasize the importance of presenting information on the societal risks posed to the community both in a narrative way and by geographical maps of the city. As an example figure 4 shows how this may be realized in relation to the assessment matrix which relates to the corresponding areas on the city map of societal risks.
5. Discussion and conclusion
The method presented here for public policy making on societal risks emerging from urban projects within the risk areas of hazardous substance activities such as railways, highways, cross country pipelines, ports, and industrial areas fits within the existing legal settlement. In fact risk area maps are already in use by several municipalities. But the national government of the Netherlands has set its goal on more effective and efficient decision making on spatial planning together with more responsibility by local government on matters of societal risk control.
QRA’s in the Netherlands are carried out uniformly. This is because there is a legal demand to use the official guidelines for performing the quantitative risk analyses. Establishments and cross country pipelines each have their own guideline and computational modelling for calculating societal risk. The same holds for the transport of dangerous substances via roads, railways and water ways. Therefore the establishment of risk zones can be done on a uniform basis.
We conclude as risk analyst experts that using risk zones based on effects i.e. telling the story of scenarios, is more important than the precise radius of a risk zone as the perception of the societal risk and its acceptance do not depend on the precise border (Slovic, 2010). In fact the precise border is only a matter of consensus between the risk analyst experts of choosing between the uncertainties involved in modelling the physics of the damaging effects that will occur after an accident with a hazardous substance. Uncertainty can play an important role in different ways in the decision making process. See for example (van Asselt, 2000). Not every type of uncertainty is relevant for understanding the risk involved.
The more important societal gain of this narrative based approach of societal risk is its accessibility for the layman. The concept is easy to grasp and correlates with the technical approach as expressed by the current societal risk graph. Buildings offer protection to people from otherwise lethal effects. Depending on the distance of the buildings to the risk source, accident scenarios will not severely damage them and thus do not impose a lethal danger to those present inside. All this is related to some risk zones defined by grouping the proper set of accident scenarios.
Figure 4: Risk assessment matrix combined with qualitative description of risk per zone
Of course there is no guarantee that people will accept the societal risk or potential adverse effects imposed on them when realizing urban building projects (or otherwise giving authorization for producing or handling a hazardous substance). Choosing between spatial alternatives requires more than just an accessible form of presenting risk information and an understandable way of weighing the change (mostly increase) of societal risk. In line with the recommendations of Rli (Rli, 2014) we conclude that a broad and better understanding of how risks relate to making choices between alternatives and how the risks are influenced by using opportunities for the common good is an important condition for the societal acceptance of low-probability-high-consequence risks from hazardous substances. Policy makers and local administrators must cooperate in order to realize this balancing of risks versus other societal interests. In this paper we described the approach to visualize accident scenario based risk zones on maps together with the narrative approach to explain the safety these zones give for an array of accident scenarios to people inside buildings. This approach has the potential to communicate the low-probability-high-consequence risks in such a way that the implications for urban land use planning can be understand a priori by all parties involved.
References
Ale B.J.M., 2009. Risk: an introduction the concepts of risk, danger and chance. Routledge Ltd, New York. Asselt van, M.B.A., 2000. Perceptives on uncertaintity and risk: the PRIMA approach to decision approach.
Kluwer Academic Publishers, Dordrecht.
Geerts R., Heitink J., 2002, Risico’s in Limburg ‘Weten waar het over gaat’. AVIV bv, Enschede, the Netherlands (in Dutch).
Galbraith J.K., 1998, The affluent Society. 40th anniversary edition, updated by the author. Houghton Mifflin
Company, Boston/New York, 6-17
Royal Haskoning bv, 2010, authors Iserief, A.H., Boxman A.M.C., Kuppen I.G.W.M., Evaluation Legal Accountability Societal Risk. Published by the former ministry of Housing, Spatial Planning and the Environment now transformed to the ministry of Infrastructure and Environmental affairs, the Netherlands (in Dutch).
RLi.(Raad voor de leefomgeving en infrastructuur), 2014. Publication Rli 2014/06. Risico’s gewaardeerd Naar een transparant en adaptief risicobeleid (in Dutch).