Minerals
Policy
Monitoring
Programme
Minerals Policy Monitoring Programme Report 2007-2010
Methods and Procedures
Minerals P
Minerals Policy Monitoring Programme
Report 2007-2010
Methods and Procedures
RIVM Report 680717018/2012
Colophon
© RIVM 2012
Parts of this publication may be reproduced, provided acknowledgement is given to the 'National Institute for Public Health and the Environment', along with the title and year of publication.
A. de Goffau, Centrum voor MilieuMonitoring, RIVM
T.C. van Leeuwen, LEI Wageningen UR
A. van den Ham, LEI Wageningen UR
G.J. Doornewaard, LEI Wageningen UR
B. Fraters, Centrum voor MilieuMonitoring, RIVM
Contact:
B. Fraters
Centrum voor MilieuMonitoring
dico.fraters@rivm.nl
This investigation has been performed by order and for the account of Ministry of Economic Affairs, Agriculture and Innovation & Ministry of Infrastructure and the Environment, within the framework of Minerals Policy Monitoring Network
Abstract
Mineral Policy Monitoring Programme Report 2007–2010
Methods and procedures
Since 2006, the role of the Minerals Policy Monitoring Network (LMM) has widened. This change in scope has affected the organisation of the programme, as well as its methods and procedures. In this report RIVM and LEI Wageningen UR have
documented these changes in the set-up of the programme and the associated changes in methods and procedures. Monitoring results are reported separately.
Objective of the LMM, prior and after 2006
The objectives of LMM are monitoring the water quality on farms and explaining the results in relation to agricultural practice on those farms. Up to 2006, the results of the LMM were primarily used to assess the effectiveness of Dutch agricultural mineral policies. Since then, LMM was expanded with a so-called derogation-monitoring network. This network monitors the impacts associated with the EU derogation, adjudicated to the Netherlands, for the permissible amounts of nitrogen from manure on grassland farms.
Modifications
The expansion of LMM tasks was accompanied by various modifications in the programme. First, the number of farms monitored has increased considerably.
Secondly, since 2006 the network consists of a stationary group of farms. Prior to that, monitoring was done on a revolving group of farms from the total number of
participating farms. Thirdly, the sampling frequency for water quality monitoring has gone up. Finally, the interest in the quality of surface water has gradually increased; at the onset, LMM focused largely on groundwater, water from drains and soil moisture.
Keywords:
Rapport in het kort
Landelijk Meetnet effecten Mestbeleid rapport periode 2007-2010
Methoden en procedures
Sinds 2006 zijn de taken van het Landelijke Meetnet Effecten Mestbeleid (LMM) verbreed. Dit is van invloed is geweest op de organisatie, en op de methoden en procedures die in het meetnet zijn gebruikt. Het RIVM en LEI Wageningen UR hebben de veranderingen in de meetnetopzet evenals de methoden en procedures in dit rapport beschreven. De meetresultaten zelf verschijnen separaat.
Doel LMM, voor en na 2006
Het doel van het LMM is om de kwaliteit van water op landbouwbedrijven te volgen en te verklaren in relatie tot de bedrijfsvoering op die landbouwbedrijven. Tot 2006 zijn de resultaten van het LMM hoofdzakelijk gebruikt om de effectiviteit van het
Nederlandse mestbeleid te toetsen. Sindsdien is het LMM uitgebreid met een zogenoemd derogatiemeetnet. Dit meetnet volgt de effecten van de
uitzonderingspositie die de EU aan Nederland heeft verleend (derogatie) voor de toegestane hoeveelheid stikstof uit dierlijke mest op graslandbedrijven.
Veranderingen
Als gevolg van de uitbreiding van taken zijn een aantal veranderingen in het LMM doorgevoerd. Als eerste is het aantal bedrijven dat het LMM monitort aanzienlijk vergroot. Ten tweede bestaat sinds 2006 het meetnet uit een vaste groep bedrijven. Voor die tijd werd uit het totale aantal geselecteerde bedrijven steeds een wisselende groep bedrijven gevolgd. Ten derde is de frequentie van waterbemonstering verhoogd. Ten slotte is de aandacht voor de kwaliteit van het oppervlaktewater gaandeweg toegenomen; oorspronkelijk richtte het LMM zich vooral op grondwater, drainwater en bodemvocht.
Trefwoorden:
Contents
Summary—7
1 INTRODUCTION—9
1.1 The Minerals Policy Monitoring Programme—9 1.2 Agricultural policies and the role of LMM—9 1.3 Outline of assumptions and methodology—9 1.4 Implementing agencies and principals—10 1.5 Objective of the report—11
1.6 Reading guide—11
2 LMM SET-UP AND COMPOSITION—13
2.1 LMM organisation—13
2.1.1 Sub-programmes as organising structure for data evaluation—13 2.1.2 2006 beginning of a new phase in the LMM—13
2.1.3 Selection and recruitment of farms—14 2.1.4 Farming categories for reporting purposes—16
2.2 The EM sub-programme—18
2.3 The other sub-programmes—19
2.4 LMM overview—21
2.5 LMM planning for the period 2007 - 2010—22
3 DATA COLLECTION AND PROCESSING—25
3.1 Data on agricultural practices—25
3.1.1 Practical aspects of data acquisition on farm practice—25 3.1.2 Information gathered—26
3.2 Water quality data—26 3.2.1 Introduction—26 3.2.2 Sampling of water—26 3.2.3 Testing of water quality—32 3.2.4 Quality control—33
3.2.5 Data validation—33 3.3 Use of secondary data—34 3.3.1 Map material—34
3.3.2 Meteorological data—34
3.3.3 Various information sources related to farm management—34
4 DATA ANALYSIS AND PRESENTATION—37
4.1 Introduction—37
4.2 Presentation of data—38
4.2.1 Data on agricultural practices and mineral management—38 4.2.2 Data on water quality—42
4.2.3 Differences in reporting compared to previous years—43 4.3 Evaluation of data on agricultural practices—44
4.4 Evaluation of water quality data—45
ANNEXES
ANNEX 1 Background of the LMM—49
ANNEX 2 The Farm Accountancy Data Network (FADN) and LMM farm
selection—57
ANNEX 3 Types of farming distinguished—65
ANNEX 4 Number of farms planned in LMM set-up—71
ANNEX 5 Number of farms covered in programme implementation—73
ANNEX 6 List of municipalities arranged per soil type district—77
ANNEX 7 Work Instructions for field activities—83
ANNEX 8 Agencies involved in water sampling—93
ANNEX 9 Laboratory Testing Techniques and detection limits—95
Summary
Originally, the Minerals Policy Monitoring Programme (LMM) was set up as an
instrument for evaluating the effectiveness of Dutch agricultural mineral policies. LMM monitors the agricultural practices and water quality on farms representing different farming categories. The programme focuses on those farming categories, which, in terms of acreage, dominate the Dutch agricultural sector.
Meanwhile, LMM plays a supporting role in evaluating the 4-yearly national action programmes within the framework of the European Nitrate Directive. Since 2006, the programme fulfils a role in meeting the EC’s obligations linked to the derogation granted to the Netherlands. Finally, LMM investigates at limited scale, the likely impacts from future mineral policy options.
The two major LMM sub-programmes, corresponding to the objectives mentioned above are the Evaluation Monitoring (EM) and Derogation Monitoring (DM). The Exploratory Monitoring (VM) sub-programme was executed in support of future policy options. Furthermore, LMM undertook a number of additional programmes,
complementary to the regular monitoring sub-programmes, covering issues not adequately covered in the regular programmes.
In the period 2007-2010, the number of farms participating in LMM was roughly between 500 and 540. If criteria permit, farms are used as much as possible for more than one sub-programme. The majority of farms participating in LMM have been selected by stratified random sampling from the Farm Accountancy Data Network (FADN). The parameters used for stratification are ′type of farming’, ′economic size of a farm’ and ′soil type region’ (’region’ for short). The LMM distinguishes four main regions: the sand region, clay region, peat region and loess region.
Data gathered for characterisation of the agricultural practices comprise varied
information on the operational management of farms (amongst others: acreage, crops cultivated, head of cattle, production data of crops/cattle/milk, stocks, investments, etc.). Using these verifiable basic data, inferred information is calculated or derived, such as the nutrient surplus on the soil balance.
The objective of water quality monitoring is to assess as early and as directly as possible the leaching into the environment of nutrients caused by fertilizing practices. To this end, LMM monitors on the one hand the water leaching from the root zone, and on the other hand the quality of surface water. The water leaching from the root zone is sampled on farming plots in the upper meter of the groundwater, tile drain water and/or soil moisture. The quality of the surface water is monitored in ditches and surface drains. While the emphasis of monitoring is on nutrient concentrations, a wide range of chemical parameters is analysed.
The current report describes how LMM is organised, how farms are recruited, which information is collected and the methods of data collection and analysis.
Samenvatting
Het Landelijk Meetnet effecten Mestbeleid (LMM) is oorspronkelijk opgezet als instrument bij de evaluatie van de Nederlandse mestwetgeving. Het LMM onderzoekt de landbouwpraktijk en waterkwaliteit op diverse categorieën agrarische bedrijven. Het meetnet is gericht op die bedrijfscategorieën die in de Nederlandse context, qua oppervlak, dominant zijn.
Ondertussen speelt het meetnet een ondersteunende rol bij het opstellen van het vierjaarlijkse nationale actieprogramma’s in het kader van de Europese Nitraatrichtlijn. Sinds 2006 vervult het meetnet een rol bij de door de Europese Commissie verleende derogatie. Tenslotte wordt binnen het LMM op beperkte schaal onderzoek gedaan naar de mogelijke effecten van toekomstige maatregelen binnen het mestbeleid.
De twee belangrijkste LMM deelprogramma’s, corresponderend met eerder genoemde doelstellingen zijn de evaluerende monitoring (EM) en derogatie monitoring (DM). Het deelprogramma verkennende monitoring (VM) werd uitgevoerd ter ondersteuning van toekomstige mestbeleid opties. Daarnaast voerde het LMM een aantal aanvullende programma’s uit, complementair aan de reguliere deelprogramma’s, met als doel aspecten te onderzoeken die onvoldoende aan bod kwamen in de reguliere programma’s.
Het aantal landbouwbedrijven dat aan het LMM deelneemt lag in de periode 2007 tot 2010 tussen circa 500 en 540. Bedrijven worden, wanneer de criteria dat toelaten, zoveel mogelijk gebruikt voor meer dan één deelprogramma. Het merendeel van de aan het LMM deelnemende bedrijven is geselecteerd met behulp van een
gestratificeerde aselecte steekproef uit het Bedrijven Informatienet (BIN) van het LEI. De stratificatieparameters zijn bedrijftype, economische grootte van een bedrijf en grondsoortregio (kortweg ‘regio’). Het LMM onderscheidt vier regio’s: de zandregio, kleiregio, veenregio en lössregio.
De gegevens die verzameld worden ter karakterisering van de landbouwpraktijk, omvat veelsoortige informatie over bedrijfsvoering (arealen, verbouwde gewassen, aantallen dieren, productie van gewassen/vlees/melk, mestgebruik, voorraden investeringen, etc.) Met behulp van deze verifieerbare basisinformatie worden afgeleide parameters berekend, zoals nutriëntoverschotten op de bodembalans. Het doel van het volgen van de waterkwaliteit, is om zo snel mogelijk en op een zo direct mogelijke manier het uitspoelen van nutriënten naar het milieu vast te stellen. Hiertoe onderzoekt het LMM enerzijds het water dat uitspoelt uit de wortelzone, en anderzijds de kwaliteit van het oppervlakte water. Het uitspoelende water wordt bemonsterd als de bovenste meter van het grondwater, drainwater en/of bodemvocht. De kwaliteit van het oppervlaktewater wordt gevolgd in sloten en greppels. Hoewel focus ligt op nutriëntconcentraties in het water, wordt ook een breed scala aan andere parameters geanalyseerd.
Het voorliggende rapport beschrijft hoe het LMM is opgezet, hoe bedrijven
geselecteerd worden, welke informatie verzameld wordt plus de manier waarop de informatie wordt verzameld en geanalyseerd.
1
INTRODUCTION
1.1 The Minerals Policy Monitoring Programme
The Minerals Policy Monitoring Programme (LMM) is a national monitoring programme collecting information on farm management practices and water quality on farms. The objectives of the LMM are multiple. Originally, the programme was set up to monitor the impacts of the government’s agricultural policies on the water quality on farms in relation to farm management practices. Now, the programme also serves as an instrument to meet the monitoring requirements imposed by the EC (Nitrate Directive and derogation decision). In addition LMM-data are used to provide scientific support for setting the mineral use standards. Data are also exploited to study and assess the relation between water quality and nutrient use.
Finally, the programme provides information for ex-ante evaluations to assess the likely effects of future policy options (special research programmes like ‘Cows and Opportunities’ (K&K) and ′Cultivating with a Future’ (TmT)).
1.2 Agricultural policies and the role of LMM
Agricultural production in the Netherlands has increased sharply since the fifties and sixties of last century. Key to this production increase were mechanization, the application of (artificial) fertiliser and pesticides in crop production and feed concentrates in livestock farming.
This intensification of agricultural production has resulted in significant environmental impacts (impacts on the quality of air, soil and (ground)water). In the eighties the Netherlands’ Government commenced formulating and implementing policies and measures to reduce emissions of nutrients from agriculture into the environment. The LMM was initiated by the end of the eighties of last century to assess the
effectiveness of government policies in limiting the impacts from agricultural emissions on groundwater quality. It is noted that the origins of LMM predate the onset of the Nitrate Directive or Water Framework Directive.
Annex 1 presents a more elaborate description of the development of sector policies and in parallel the development of the LMM monitoring network.
1.3 Outline of assumptions and methodology
The underlying assumption of the LMM is that government policies can affect farm practices and thereby reduce emissions to groundwater and surface waters.
Furthermore, it is assumed that changes in farm practices (use of nutrients) will affect the water quality on farms. Changes in water quality can only be detected with some time lag.
The monitoring of water quality aims to assess the impacts from fertilising practices as directly as possible (minimum interference), with the shortest time delay. To this end, the programme samples, on-farm, the water leaching from the root zone
(corresponding with the precipitation surplus). The programme also monitors the quality of surface waters as a more indirect indicator.
For data reporting, LMM currently distinguishes four major soil type regions (‘regions’ for short) and, depending on the region, three principal farming types (Table 1.1).
′Industrial livestock farming’ is distinguished as a separate (fourth) type of farming in the sand region only.
Table 1.1 Reporting units for data evaluation
Regions Types of farming distinguished
Sand region Clay region Peat region Loess region Dairy farming Arable farming
Other (grazing livestock farming) (Industrial livestock farming)
Farms are the basic units for monitoring. Farms are selected via stratified random sampling. The principal parameters for stratification are farming type, size of farm and geographical position, expressed as the region of a farm. These aspects will be
explained in more detail in chapter 2.
With the limited amount of resources available, LMM ensures full coverage of the target agricultural sector by using stratification in the selection of farms. The LMM intends to provide reliable conclusions at the level of the classification units (LMM categories: combination of region and farm type) shown in Table 1.1. At the level of the individual strata, this is usually not possible due to the limited number of elements per stratum.
LMM collects a wide range of data related to agricultural management practices and nutrient management. In addition to the financial and economical results, the
participating farms also provide information on the amount of in- and outgoing manure and nutrients and other aspects of farm management. This information is recorded in the Farm Accountancy Data Network (FADN). On the basis of these data, the
environmental pressure on each participating farm can be assessed. Important indicators in this respect are nitrogen and phosphorous surpluses on the soil balance. Water quality monitoring takes place by sampling the water leaching from the root zone, ditchwater and surface drains. Water leaching from the root zone is investigated by sampling either the upper one meter of the groundwater, soil moisture or water from subsurface drains.
LMM tests various parameters to describe the water quality. Important parameters are nitrogen and phosphorous components as indicators for the nutrient leaching from agricultural soils.
Besides fertilising practices, various other (natural) factors affect water quality on farms. Therefore LMM also collects information on relevant environmental conditions (meteorology, soil, groundwater regime, water management practice).
The LMM comprises two main activities. One activity of LMM is data analysis, evaluation and reporting. This work could not be done without the other major LMM activity of data collection, data processing and data validation.
1.4 Implementing agencies and principals
LEI (a research institute within the Wageningen University and Research Centre) is responsible for collecting and evaluating data on farming practices and nutrient management.
The National Institute for Public Health and the Environment is the agent responsible for monitoring and analysing the water quality at participating farms.
The LMM is implemented under the authority of, and financed by two ministries: the Ministry of Infrastructure and Environment and the Ministry of Economic Affairs, Agriculture and Innovation.
1.5 Objective of the report
This document is a background document for the LMM as implemented during the period 2007-2010. The report intends to record and present information on the programme’s principles, assumptions, methodology and procedures.
The report covers the water quality monitoring during the years 2007-2010 and the corresponding monitoring of agricultural practices during 2006-2009 (it is assumed that farm management practices during year x will affect water quality during year x+1 and later). The LMM data reports or result reports, published separately, focus on the results only.
The LMM result reports and the background document are published with the aim to make the information collected available to a wider public. The reports also provide transparency and accounting for the activities and results of the monitoring effort.
1.6 Reading guide
After the current chapter, this report contains the following topics:
Chapter 2: description of LMM organisation in terms of set-up and composition; Chapter 3 description of the methodology and planning of data collection
activities;
2
LMM SET-UP AND COMPOSITION
2.1 LMM organisation
2.1.1 Sub-programmes as organising structure for data evaluation
In line with the different LMM objectives, data evaluation is organised in separate sub-programmes. Each sub-programme is defined to meet specific policy requirements or monitoring needs. Data collection is organised differently (see chapter 3).
During the reporting period, the LMM programme was organised in four
sub-programmes. These sub-programmes, briefly presented below, are elaborated in more detail in sections 2.2 and 2.3.
Evaluation Monitoring (EM) or long-term regular trend-monitoring network aims to describe and assess the quality of water at randomly selected farms in relation to current and past environmental stresses from agricultural practices and policy decisions (ex-post evaluation). The main purpose of this sub-programme is to assess effectiveness of agricultural policies.
Exploratory Monitoring (VM) investigates impacts on water quality and farm practices from future policy options (ex-ante evaluation). This monitor comprises research programmes such as ‘Cows and Opportunities’ (K&K) which focuses on dairy farming and ‘Cultivating with a Future’ (TmT), focusing on arable farming.
Derogation Monitoring (DM) is set up to meet the requirements of the EUderogation decision (monitoring of at least 300 grassland farms with derogation). The most important element in the DM is the derogation network, with the same objective as the EM, but addressing grassland farms registered for derogation. These farms are allowed to apply up to 250 kg nitrogen per ha from grazing animal manure. The DM also comprised a so-called Reference Monitor (RM), focussing on farms with relatively limited manure use. The RM is complementary to the DM, set-up in support of a new derogation application.
Monitoring of specific combinations of ‘farming type – region’, which are not adequately addressed in other LMM sub-programmes. Examples are:o Monitoring of impacts on soils prone to leaching (sandy soils and loess soils): UM sub-programme.
o The SVZ-network (scouting outdoor market gardening crops in the sand region).
o Extension of the number of arable farms within LMM, in order to monitor with more accuracy the leaching of the nitrogen surplus on arable farms.
The objectives of the sub-programmes DM, RM and UM can be considered as
complementary to the EM and VM, while the monitoring efforts within the EM and VM are indispensable for realizing the objective of the DM and UM.
2.1.2 2006 beginning of a new phase in the LMM
Prior to 2006 LMM gradually evolved into a country-wide monitoring network. In the years 2006 and 2007 LMM experienced fundamental changes and a major expansion. These changes were associated with putting into operation the new nitrate action programme and the obligations arising from the EC’s adjudication of derogation for the period 2006-2009. Some of the changes taking place in the years 2006-2007 are:
Set up of a new Derogation monitoring network.
The regular trend monitoring network was strengthened by adding the loess region as a separate region of data collection and data assessment (prior to 2006 the sand region and loess regions ware considered together).
Transition of a revolving network into a stationary network. Increase in monitoring frequency, especially of surface water.
The year 2006 is a transition year, in which water quality is already monitored at farms within the derogation network, while no information on agricultural practices was available at the same farms for the preceding year 2005.
2.1.3 Selection and recruitment of farms
The LMM focuses on the most common types of land use and fertiliser practices found in the Netherlands.
Farms participating in LMM are, to the extent possible, recruited from the Farm Accountancy Data Network (FADN), a network operated by LEI. In FADN, LEI gathers detailed financial, economical and environmental data of about 1,500 agricultural and horticultural farms. The farms selected in FADN are a stratified random sample from all farms covered by the annual national Agricultural Census. Stratification uses two principal variables: type of farming activity (based on the NEG-classification up to 2010; now using NSO-classification) and economic size (see Annex 2 and 3). FADN represents about 95% of the total agricultural production in the Netherlands. Poppe (2004) describes background information and history of FADN in detail. The LMM uses the ′region’ as the third stratification variable. Furthermore LMM puts a size limit on the spatial extent of farms selected (≥ 10 ha) and on their economic size (16 ≤ NGE ≤ 800).
Although two of the stratification variables (farming type and economic size) are identical in FADN and LMM, the criteria applied for the variables differ. For the DM-, RM- and UM sub-programmes, additional selection criteria are applied. Annex 2 and 3 elaborate on the stratification variables applied in FADN and LMM.
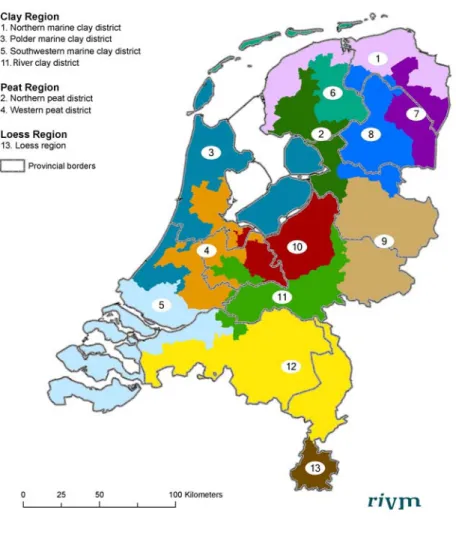
Thirteen soil type districts make up the four main regions distinguished in LMM: six in the sand region, four in the clay region and two in the peat region (Figure 2.1). The loess region covers the Southern part of Limburg.
Unlike FADN, the LMM sample does not include all farm types. The decision to include a specific type of farming in a certain region depends on the extent of agricultural land occupied by this type. In this way, farm types that only cover a small percentage of the land (or form a very heterogeneous group, like horticulture) are excluded from the sample. The number of sample farms required in the sample per farm type differs between farm types, but remains constant in time. These numbers have been defined at the onset of a sub-programme, taking into account vulnerability to leaching, the relative importance of the type of exploitation/type of farming, and the required/ desirable numbers of farms from policy perspective or statistical considerations (Fraters and Boumans, 2005).
Figure 2.1 Regions with soil type districts distinguished in LMM
In the reporting period 2007-2010, the following general guidelines were used for selecting and recruiting LMM farms:
1. Overlap between programmes. Farms already participating in one of the sub-programmes are utilised to the extent possible in constituting and maintaining (e.g. for replacement of ‘drop-outs’) the research sample in a sub-programme. Due to this overlap, the information gathered at one farm may be exploited for more than one sub-programme. For example, farms initially recruited for the EM may also participate in the DM (if registered for derogation). Farms recruited for the DM, can be used for analysis within the EM, if the EM selection criteria are met. 2. Sequence of recruitment. In recruiting and replacing farms, priority is given to an
optimal research sample for the EM, followed by DM, UM and than RM.
3. Minimum rotation. The strategy for the monitoring period 2007-2010 (FADN years 2006-2009) is to use a fixed group of participants. Prior to 2006 a ‘revolving’ sample was used with periodic replacement of participants (in accordance with FADN-practice). Since 2006, a participant is only replaced if it does not meet (any longer) the criteria in place, or if the owner chooses to stop participation. For farms no longer meeting the criteria for a sub-programme, but whose owner is still
willing to participate in LMM, possibilities are investigated for incorporation in an alternative sub-programme. Notwithstanding the aim of a stable research sample, an annual replacement of about 20 to 25 firms proves to be inevitable.
4. Maximum utilisation of FADN potential. While in the past selection of LMM farms focussed on farms newly recruited in FADN, now all farms within FADN are considered as potential LMM participants. The starting date within FADN or earlier participation in LMM is no impediment for LMM participation.
5. Only in case of insufficient FADN potential, additional selection takes place. If FADN cannot provide enough LMM candidates, additional farms are selected outside FADN.
o Additional farms for the EM, DM, RM en UM sub-programmes are then selected by stratified random sampling from the Agricultural Census applying the relevant sample criteria. While EM and VM are the first resource for DM farm selection, also farms beyond these programmes have been selected. Examples are the sixteen NFW-farmsand ten CD-farms, two research projects outside LMM.
o Additional selection in the VM-programme is not done at random. In these projects farms were approached because of their participation in ongoing research projects (sixteen dairy farms in ′Cows and Opportunities’ (K&K), and twelve arable farms in the programme ′Cultivating with a Future’ (TmT) 6. Inclusion in FADN of additionally selected LMM farms. With the exception of some
TmT-farms, data on agricultural practices of all additionally recruited LMM farms are included in FADN (supplementary to the 1,500 regular FADN farms).
2.1.4 Farming categories for reporting purposes
The initial focus of LMM and its predecessor was on the sand region. In the course of the nineties of last century the clay region and peat region were included in the programme. At about the turn of the century, the loess region was the last one to be added to the programme (see also Annex 5, section A5.1). Prior to 2006, LMM combined the results for the loess region with those of the sand region. Since then, the LMM presents and reports on the loess region as a separate region.
LMM started with monitoring dairy farms and arable farms. In the course of the nineties also industrial livestock farms and other farms (livestock combination farms and crop-livestock combination farms, excluding specialised dairy farms: Table A3.4 of Annex 3) were incorporated in LMM. Only in the sand region, the programme reports on industrial livestock farms as a separate type of farming.
The LMM reporting categories (combining region and farming type) are not identical to the strata used for selection of farms. Reporting of results is done at a higher
aggregation level. The NEG farming types, used in farm selection, and the corresponding reporting categories are listed in Table A3.4 of Annex 3.
Farm types distinguished in LMM are aggregated in such a way that the clusters are fairly homogeneous in terms of land use and fertilising practice. For a trend monitoring network like LMM, limited heterogeneity within the type of farming is important. A
Noordelijke Friese Wouden (NFW) is composed of a group of dairy farmers in the northern sand region, who try to meet the environmental targets of the
government by efficient mineral management. To achieve this, these farmers seek the consent and support within the national and European, environmental policies. Caring Dairy (CD) is group of eleven dairy farmers who aim at sustainability on-farm practices; an important aspect of their endeavour is maximising the cattle grazing during the summer period. Ten farms are included in the DM and one farm participates in the RM.
more homogeneous farming type category allows a smaller sample size. In all four regions, dairy farms represent a considerable part of total land use. In the peat region, the dominance of dairy farms is such that LMM merely focuses on dairy farms.
Figure 2.2 shows the reporting categories in terms of region and type of farming for the EM-, DM-, RM- and VM sub-programmes.
EM Sub-programme Arable Sand Clay Loess Peat DM Sub-programme Arable Sand Clay Loess Peat RM Sub-programme Arable Sand Clay Loess Peat VM Sub-programme Dairy Arable Sand Clay Loess Peat Dairy Dairy Industrial Livestock Industrial Livestock Type of Farming Other Type of Farming Other Type of Farming Industrial Livestock Industrial Livestock Dairy Type of Farming Other Other Cows and Opport uni ti es Cultivating with a Future
Figure 2.2 Scope of sub-programmes with respect to farming categories (simplified). The farming categories reported on in the different sub-programmes are hatched. The farming type ′other’ is divided in two because the definition of this farming type is not identical for the sand/loess region vs. the clay region. The same applies to the farming category ‘dairy’ in the DM sub-programme vs. the RM sub-sub-programme; both sub-sub-programmes address specific parts of the research population of dairy farms.
Figure 2.2 illustrates that the EM includes various farming types. The DM and RM investigate farms with at least 70% of their acreage used as grassland. The DM primarily focuses on dairy farms; however, also ‘other farms’, which have applied for derogation, are included. The RM merely includes dairy farms. The UM aims at all farming types situated in the sand region and the loess region. The VM programmes address dairy farms and specialised arable farms.
The categorisation and stratification used for selection of farms and for reporting in the EM sub-programme is shown graphically in Figure 2.3.
Farm type
Region Soil type
district Dairy Arable Industrial
Livestock Other North 1* Central 2 4 5 6 Sand South 3 Marine north Marine central west 7 8 9 Marine south west Clay River clay Loess 10 11 12 North 13 Peat West 14
____ boundary between strata - - - boundary between substrata
* each cell (1,2,…14) contains 3 NGE size classes
Figure 2.3 Strata used in LMM selection and Farming categories (numbered) for EM reporting (farming category 9 comprises a sub-set of farm types included in farming categories 6 and 12)
2.2 The EM sub-programme
The EM, the regular trend-monitoring network, is LMM’s oldest and most encompassing LMM sub-programme in terms of categories reported on and representativeness of Dutch agricultural practice. The main purpose of the sub-programme is to assess effectiveness of agricultural policies.
This sub-programme fully follows the general procedures for selection and recruitment of farms, as presented in Annex 2.
The selection criteria for farms are as follows:
Farms have an economic size between 16 and 800 NGE; Farms have a minimum acreage of 10 ha;
Farms are exclusively selected from the FADN, using random (stratified) selection. For the stratification 42 strata are applied (14 categories in 3 size classes, see
Figure 2.3)
On a national scale, the research sample of the EM sub-programme represents 81% of the area of cultivated land and 46% of the total number of farms. The area of
grassland and arable land covered by the land-use units discerned ranges from 82% to 86%. For ‘other cultivated land’ the coverage (26%) is relatively low (see Annex 3). Till about 2003, the number of farms sampled annually within the EM was around 100 (the number of participating farms was about 3 times larger). With the new monitoring sub-programmes since 2004, additional farms were selected applying the same
methodology as for the EM. When selected by using the same procedure as applied for the EM farms, a farm is considered to qualify for EM evaluation. In the period
2006-2009 between 365 and 390 farms qualified for EM-evaluation.
2.3 The other sub-programmes
Derogation Monitoring (DM)
According to planning DM comprises 300 farms with derogation, of which 160 in the sand region, 60 in the clay region, 60 in the peat region and 20 in the loess region. The number of farms in the sand region constitutes more than 50% of programme’s total, in line with the fact that more than 50% of the acreage of derogation farms is situated in the sand region. Moreover, an intensification of monitoring of agriculture on sandy soils was one of the EU requirements linked to the derogation decision.
Because the derogation decision demands the monitoring network to be representative for all soil types, fertilising practices (manure application practices) and crop rotations, it was decided not to exclude any type of farming. This implies that farm types not represented in the EM, are also eligible for the DM. One of the selection criteria for inclusion of a farm in the DM is a minimum acreage of grassland of 60%. The formal requirement for obtaining derogation is that at least 70% of the farm’s acreage consists of grassland (see Fraters et al., 2007). This difference in percentages is related to different timing of recruitment vs. the moment of granting derogation, and different definitions of the farming unit by the authorities and LMM.
Only farms with derogation are eligible for the DM. Farms, which have registered for derogation, but which produce by organic farming, are excluded from the DM. By definition, farms based on organic farming principles only apply a maximum amount of 170 kg N per ha from manure.
For the DM, LMM distinguishes two farming type categories only: specialised dairy farms and other grassland farms. Stratification related to ‘location’ is based on the concept of groundwater bodies, distinguished in the Netherlands within the framework of the Water Framework Directive (WFD). For the WFD the Netherlands has twenty groundwater bodies (see box on next page).
Farms already participating in the LMM form the basis of the DM: either farms which are part of the EM, the VM (15 of the 16 farms participating in project ‘Cows and Opportunities’) plus the extra group of farms participating in the Noord Friese Wouden Project (16 farms) and 10 farms from ‘Caring Dairy’. New farms from the Agricultural Census have supplemented this base group.
In summary: DM farms were selected randomly from the FADN or the Agricultural Census, and partly in a non-random way. A total of 78 strata are applied: 2 types of farming, in 3 size classes, distinguishing 1 to 5 groundwater bodies per region.
Reference Monitor (RM)
At inception, a total of 65 farms were planned for the RM (35 in the sand region, 25 in the clay region and 5 in the loess region); no representation was deemed necessary in the peat region. In comparison with the DM, RM farms use less manure, but it was anticipated that they would use a similar amount of total nitrogen. At the start in 2006, the selection of RM-farms focused on dairy farms, which had not applied for derogation. It turned out that those farms generally did not qualify for participation in the RM. After consultation with the principals (ministries involved) selection was shifted to derogation dairy farms with relatively limited use of manure.
In the end, non-organic dairy farms with an estimated manure production of less than 220 kg N/ha (estimate based on number of cattle and acreages from the Agricultural Census) and not utilising any imported manure were selected. Farms were partly derived from the FADN, but most of the farms participating in RM had to be selected from outside. Within RM 30 strata are distinguished: 1 type of farming for 3 size classes, while distinguishing 1 to 5 groundwater bodies per region (the peat region was not considered).
By the end of 2009, principals and the LMM management decided to discontinue this sub-programme, not deemed essential for the scientific underpinning of a new derogation request.
Exploratory Monitor (VM)
The VM comprises farms participating in research projects. The LMM is normally not the lead organisation in such research; rather contributing, The LMM participates in the VM programmes ′Cows and Opportunities’ (K&K) and ‘Cultivating with a future’ (TmT). These projects are executed under the responsibility of external institutes. The
16 farms in K&K, not covered by FADN since 2004, were included in FADN again in 2006.
The aim of farms participating in TmT is the sustainable application of crop protection products and fertilisers, and the propagation of these methods on a wide scale. LMM considers the participants in TmT as a complement to the EM sub-programme. Information is acquired for arable farms in the sand region, clay region and on reclaimed peat land. The regular LMM sub-programmes only represent these types of farms to a limited extent.
Use of groundwater bodies for farm selection in the DM
For constituting the DM, the objective was a maximum scatter (and minimum degree of representation) over the most important groundwater bodies (important in terms of acreage of agricultural land). For attributing a groundwater body to an individual farm, the
municipality in which the farm receives its mail is guiding. In municipalities underlain by 2 or more groundwater bodies, farms have been allotted to the largest groundwater body. Within the sand region, five groundwater bodies have been discerned as sub-region: Eems, Maas, Rijn-Midden, Rijn-Noord and Rijn-Oost. Remaining farms (in other groundwater bodies in de sand region) were allotted to a sixth sub-region: “other”. The loess region only comprises the groundwater body Cretaceous; therefore, this region was not subdivided any further. The peat region was subdivided into four sub-regions: the groundwater bodies Noord, Rijn-Oost, Rijn-West and ‘other’. Within the clay region, five sub-regions were discerned in the end. Because the south-western marine clay region comprises several groundwater bodies (without a clear dominant one), this part of the clay region was classified as one separate sub-region. In addition to this, three groundwater bodies were distinguished: Eems, Rijn-Noord and Rijn-West (as far as outside the south-western marine clay sub-region). The fifth sub-region comprises farms in other municipalities, not yet classified.
Specific combinations
a. Scouting outdoor market gardening in the sand region (SVZ)
Due to their limited spatial extent, the farming type ′horticulture’ is not included in the regular LMM sub-programmes. Because of the specific issues found at outdoor market gardening farms in the sand region, LMM initiated a separate scouting programme for this type of farming. For this project, one farm was selected from FADN and the remaining eleven farms ware selected from various sources. For selection, twelve strata are distinguished: four principal crops (strawberries, leeks, asparagus and greens) in three size classes.
b. Monitoring of soils susceptible to leaching (UM)
Around 2005, the LMM results showed that the water quality (in terms of nitrate concentration) on non-dairy farms in the sand region and loess region lagged behind the improvements observed in other regions and for dairy farms. However, this conclusion was based on a very limited number of farms. There was a gap in knowledge, especially with respect to arable farms in areas with deep groundwater tables. This situation prompted organising a monitoring effort focusing on soils prone to leaching (UM sub-programme). In practice, this has led to intensified monitoring in the loess region and the extension of the group of arable farms in the sand region. The selection criteria and stratification method for the UM are the same as applied for the EM. The sole extra selection criterion is the dominance of sand or loess in the soil of the participating farms. The whole sand and loess region is included in the UM programme. The FADN was an important source of participating farms; however, the largest part of farms in the loess region has been obtained by selecting from outside the FADN.
The data reports for the period 2007-2010 do not give a separate account of the UM sub-programme, since this sub-programme only served to strengthen the results of the EM, DM/ RM and/or VM sub-programmes.
2.4 LMM overview
The ensuing Table 2.1 summarises the minimum target number of participating farms, the selection criteria, the number of strata plus stratification variables and the mode of selection used in the different sub-programmes.
For each sub-programme a certain number of farms are selected (see Annex 2 and Table 2.1). A considerable number of farms are used in more than one monitoring sub-programme. This multiple use of farms in different sub-programmes allows minimizing the data acquisitions work. Figure 2.4 schematically presents the overlap between sub-programmes in terms of participating farms. The size of the rectangles is roughly proportional to the number of farms in each sub-programme, for the 2007–2010 situation.
The size of the DM sample is fixed (minimum of 300 farms), being imposed by EU in the derogation decision. While establishing the DM some of the farms already
participating in the EM were included. Figure 2.4 shows that a considerable number of the DM sample farms also qualify for evaluation under the EM sub-programme. The RM-sample has no overlap with other sub-programmes, as its participants were not selected fully at random, nor do they qualify for DM evaluation.
Table 2.1 Selection characteristics of the LMM sub-programmes
Subprogram-me
(min. number of
Participants)*
Criteria Strata
Selection
mode
EM (n=171)
- between 16 and 800 NGE
- at least 10 ha
- farming type (Table A3.4, Annex 3))
42 strata
(14 categories x 3 size
classes)
Fully random selection from
FADN
DM (n=300)
- between 16 and 800 NGE
- at least 10 ha
- enjoy derogation
- no organic mode of production
78 strata (2 types of
farming x 3 size classes x
(1 to 5 groundwater
bodies per region))
Part selected at random
from FADN or Agricultural
Census and part selected
not at random
RM (n=65)
- between 16 and 800 NGE
- at least 10 ha
- farming type ′dairy farming’
- no organic mode of production
- fertiliser application ≤220 kg n/ha
30 strata (1 type of
farming x 3 size classes x
1 to 5 groundwater bodies
per region, except for the
peat region)
Partly derived from FADN;
additional at random
selection from Agricultural
Census
UM (n=200)
- between 16 and 800 NGE
- at least 10 ha
- farming type (Table A3.4, Annex 3)
- underlain by at least 50% sand or
loess soil
42 strata (same as for
EM)
Partly derived from FADN;
additional random selection
from Agricultural Census,
especially in the loess
region
SvZ (n=11)
- between 16 and 800 NGE
- at least 10 ha
- primarily outdoor market gardening
crops
12 strata (4 principal
crops (strawberry, leeks,
asparagus, greens) x 3
size classes),
1 from FADN; remainder
recruited additionally, from
various sources
VM K&K (n=16)
Participant of project ′Cows and
Opportunities’
Not applicable
Fully additional recruitment
from K&K- project
VM TmT
(n=12)
Participant of project ′Farming with
Future’
Not applicable
2 farms included in LMM;
10 recruited additionally
from TmT project
* not taking into account overlap between the sub-programmesRM sub-programme
EM farms qualifying for inclusion in DM-programme
VM sub-programmes Exclusively EM sub-programme Exclusively DM sub-programme
DM farms qualifying for EM-evaluation
Figure 2.4 Schematic representation of overlap in participating farms within different sub-programmes.
2.5 LMM planning for the period 2007 - 2010
Fraters and Boumans (2005) present the original planning for the LMM for 2004 and thereafter. However, the EC demanded additional monitoring in the derogation decision (EC, 2005). For this reason, the LMM planning was adjusted in 2006. The changes in the LMM planning comprised an increase in the number of participating farms and an intensification of the monitoring frequency. The principal demands of the
EC deviating from the original planning related to a minimum number of 300 farms for the DM network (to be sampled annually), and the use of a fixed (stationary) network instead of a ‘revolving’ network.
Annex 4 lists the number of farms planned for the different sub-programmes. The table shows the numbers itemised per region, and per broad category ‘dairy’ and ‘non-dairy’ farms.
The composition of the pool of LMM participants and the number of farms in each of the sub-programmes is subject to some fluctuation. This is caused by farms dropping out, or due to changes in the operational management of farms, causing farms no longer meeting the selection criteria for a sub-programme.
The number of farms actually monitored is smaller than the sum of participants in the different sub-programmes. Many farms are used in more than one sub-programme. Figure 2.4 illustrates this overlap of farms in the different sub-programmes.
The LMM focuses on the sand region (Figure 2.5). The reason for this is the larger extent of the sand region and the higher vulnerability of this region to nitrogen leaching compared to other regions.
With the start of the DM and UM, the number of farms fit for EM evaluation has increased considerably to nearly 400. Before the establishment of the DM and UM, the number of farms in the EM was about 120.
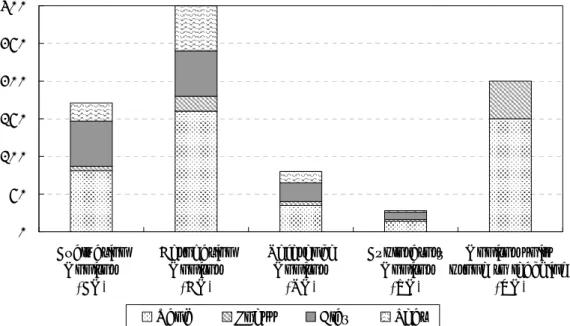
Number of farms 0 50 100 150 200 250 300 Evaluation Monitor (EM) Derogation Monitor (DM) Reference Monitor (RM) Exploratory Monitor (VM) Monitor soils prone to leaching (UM)
Sand Loess Clay Peat
Figure 2.5 Number of farms planned per region, differentiated for LMM
sub-programmes Note: the numbers do not refer to unique farms; a farm may participate in more than one sub-programme.
Figure 2.6 illustrates the composition of the different monitoring sub-programmes in terms of farming type. Table 2.2 lists, per region, the planned number of dairy and other grassland farms within the DM. The numbers are given per main soil type region. A total of 261 dairy farms and 39 other grassland farms were foreseen for the network (Fraters, et al., 2007).
Number of farms 0 50 100 150 200 250 300 Evaluation Monitor (EM) Derogation Monitor (DM) Reference Monitor (RM) Exploratory Monitor (VM) Monitor soils prone to leaching (UM)
Dairy Farms Non-dairy Farms
Figure 2.6 Number of farms planned for the different sub-programmes with break down per type of farming. Note: the numbers do not refer to unique farms; a farm may participate in more than one sub-programme)
Table 2.2 Proposed number of farms (dairy farms and other grassland farms) in the Derogation Monitor per region
Sand Loess Clay Peat Total Specialized dairy farms Other grass-land farms 140 20 17 3 52 8 52 8 261 39 Total 160 20 60 60 300
While the DM largely consists of dairy farms, this farming type also dominates the farms qualifying for EM evaluation. To support policy making for arable farms in the sand region (impact of ′use standards’ on and leaching from arable land), it was felt that more information was needed for this type of farming. Therefore, in 2007 additional arable farms were recruited in the sand region for the EM (see section 2.3 on monitoring soils susceptible to leaching).
The detailed planning in terms of number of farms sampled per sampling sub-project, the number of individual field measurements and water samples, and the number of laboratory tests (LMM planning in 2006) is presented in Annex 4. The actual number of site visits and numbers of samples taken is shown in Annex 5.
3
DATA COLLECTION AND PROCESSING
3.1 Data on agricultural practices
3.1.1 Practical aspects of data acquisition on farm practice
LEI collects and records data on agricultural practice. Data acquisition is done following a standard procedure and protocol. This procedure is identical for each farm,
irrespective of the sub-programme, region or type of farming.
Administrative technical staff at LEI are responsible for the acquisition and recording of data on farm management practice. Generally, they have an agricultural as well as an administrative training. Therefore, they are well qualified to collect information on both financial as well as technical and economic matters. They stay in regular contact with the participating farmers by mail, phone and visits. Personal contacts are of utmost importance to be aware of the ins and outs of a farm, to have detailed insight into the farm’s characteristics and to develop a relationship based on mutual trust. It is essential that these LEI-employees live and work in the same region as the farms for which they are contact person.
LEI guarantees participating farms that data on their farms are not disclosed. Data are used anonymously for research purposes. Confidentiality in the relationship between farmer and LEI is the key stone for the smooth and open flow of information. To optimize efficiency of data acquisition LEI utilises as much as possible electronically recorded data, as from banks on payments and expenditures.
This rule of confidentiality of data does not apply to all VM-farms. Farmers within the K&K sub-programme volunteered to participate; they are interested in improving their management practices and presenting themselves to the outside world. For the farms in the TmT sub-programme however, LMM strives to keep information confidential.
The data recording in FADN is extensive, and covers widely diverging aspects of farm management. LEI staff takes inventory of initial and final stocks, and collects
supplementary information such as cultivation plans, system of grazing and
composition of livestock. In processing invoices, not only the sums of money involved are recorded, but also the type of products/services, the physical quantities and the supplier/customer. Moreover, to verify the completeness of invoices, invoices are linked to electronic payments. It goes without saying that, while being processed into information for participants or researchers, the data are checked for consistency. The staff responsible for data acquisition also processes the data of the individual farms, using common principles and standards. All data are recorded centrally, being accessible for researchers only.
In return for their cooperation, participating farmers receive amongst others a farm report and a comparative assessment report for the relevant type of farming. The participant’s report primarily contains annual totals (such as the annual balance sheet and profit / loss account).
Most data in FADN are converted into annual totals, corrected for changes in stock. The annual consumption of concentrates for example is deduced from the sum of all purchases between the starting date and end date of the annual balance (minus all sales) plus stock at the beginning minus stock at the end of the period under review. The use of fertiliser is not only recorded on an annual basis but also per growing season, which runs from the moment the previous crop is harvested up to and including the harvest of the season’s actual crop.
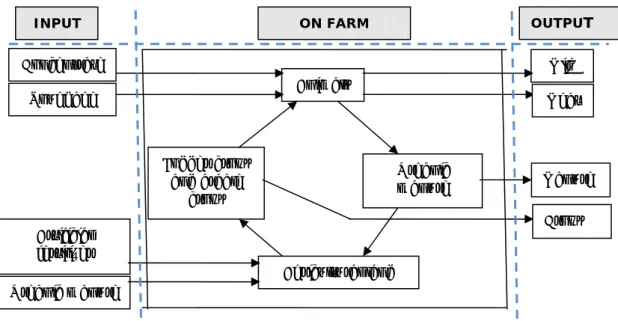
Based on the data on agricultural practices a large number of derived indicators are calculated, for example on the application and utilisation of minerals.
Annex 5 lists, per region, the number of farms actually used for data collection: Table A5.1 for data on agricultural practice and Table A5.2 for data on water quality.
3.1.2 Information gathered
The information collected by LEI for the FADN is wide ranging and very detailed (see Van der Veen, 2006). The data can be grouped as follows:
Farm structure (cropped area, cropping plan, soil types, size and composition of livestock, capacity and characteristics of stables, manure depots, etc.);
Farm management (data on grazing, mowing rate, mode and frequency of grassland rejuvenation, use of clover, irrigation, application for and use of derogation, mode and timing of fertilizer application, crop yields, use of
concentrates, results of soil tests, fodder consumption and milk production, etc.); Data on financial and economic aspects (transactions for ingoing and outgoing
product, costs and benefits allotted to crops and livestock species, appreciation of permanent means of production available, stocks at the beginning and end of the year, input of own labour and capital, etc.).
The above enumeration, dealing with the facts compiled and registered, is non-exhaustive. From the basic data collected, a wide range of corporate information is deduced for further research and for use by the owners themselves. On the one hand this inferred information provides financial economic results and performances like profit and loss accounts, the farm income and farm profits, credit balance and cost price at crop level or product level. On the other hand more technical indicators are derived, such as milk production per cow, the use of minerals in fertilizer, crop yields, culminating in a total overview of the average supply and removal of minerals with respect to the soil balance. For a further elaboration on the processing of the corporate information covered in the LMM report, reference is made to chapter 4.
3.2 Water quality data
3.2.1 Introduction
Collection of data on water quality consists of a number of steps: sampling, field testing and sample treatment, storage of samples and transport to laboratory, laboratory testing, data validation and data storage. This whole process, involving thousands of samples per year is subject to strict quality control. The approach of LMM is to optimise the quality of the work by formulating strict working procedures,
facilitating working conditions as much as possible, computerisation of data recording, and minimisation of errors (see below under: ‘provisions for optimising water
sampling) .
3.2.2 Sampling of water
Media sampled and corresponding sampling sub-projects
Method and timing of water sampling is primarily determined by soil type and by the medium sampled (groundwater, soil moisture, ditch water, tile drain water and surface drain water). For this reason water sampling is organised in different ‘sampling sub-projects’, independent from, and cross cutting the sub-programmes described in chapter 2. The number of samples per farm, frequency of sampling, and the method of sampling may differ per sampling sub-project.
Prior to 2004, LMM focussed on water leaching from the root zone. The programme sampled groundwater, water from tile drains and soil moisture. Since 2004, attention has widened to include the quality of surface water (water in ditches and surface
drains). The number of sampling sub-projects has grown (Table 3.1). This
development is to be attributed to the increased interest in the groundwater – surface water relationship (recommendations of the Spiertz Committee; Velthof, 2000) and the monitoring obligations related to the Nitrate Directive and the derogation decision (see Annex 1). This new approach enables assessment of the degree of nutrient loss from agricultural land and leaching into the wider environment (‘afwenteling’).
Table 3.1 Listing of sampling sub-projects in operation in the period 2007-2010, as a function of region and monitoring sub-programme
pri or to 200 7 wi nter 20 06-20 07 sum m er 20 07 wi nter 20 07-20 08 sum m er 20 08 wi nter 20 08-20 09 sum m er 20 09 wi nter 20 09-20 10 sum m er 20 10 Sa mp lin g frequ ency (ti m es p er season )
Winter Sand Drains and ditches (wet parts) 4 groundwater (wet parts) 1 Clay Drains and ditches 4 Groundwater 2 Ditches (extra rounds) 4 Peat Surface drains and ditches 4 Ditches (extra rounds) 4 Groundwater 1 Loess Soil moisture 1 Summer Sand Groundwater 1 Ditches (wet parts) 4 Clay Ditches 4 Peat Ditches 4 Winter Cows & Opportunities
Soil moisture 1 Drains and ditches 4 Groundwater 1 Ditches (extra rounds) 4 Summer Groundwater 1 Ditches 4 Winter Cultivating with a future
Drains and ditches 4 Summer Groundwater 1 Ditches 4 Winter Drains and ditches 4 Summer Groundwater 1 Ditches 4
sampling during winter existing sampling sub-project sampling during summer initiated in 2006
initiated in 2007 initiated in 2008
Sampling sub-project
For EM/DM/RM sub-programmes
For VM sub-programmes
For Scouting market garden crops Sand Region
This table shows that most of the sampling sub-projects continued from previous years (hatched diagonally) while some were initiated during the reporting period. Prior to 2006, ditch water was already sampled during the winter period in the sand, clay and peat regions. New sampling sub-projects for the summer period began in 2007 and 2008. A new scouting program for monitoring at farms producing outdoor market garden crops in the sand region started in the winter of 2007.
In addition to these routine sampling sub-projects, one campaign was held in 2009 to sample the water from springs and brooks in the loess region. This was a research activity, as a follow-up to an earlier campaign in 2001 (Hendrix and Meinardi, 2004).
Although methodology and timing of some of the sampling sub-projects is largely identical (for example sampling for the VM programmes versus EM/DM/RM sub-programmes), the sub-projects are listed separately because the number of sampling points per farm may differ, they are planned separately and because implementing agents may be different.
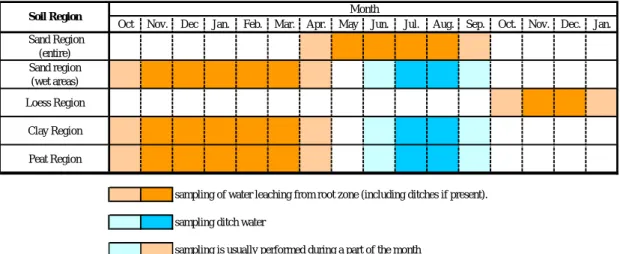
The last column of Table 3.1 lists the sampling frequency for each of the sampling sub-projects. The periods in which sampling is actually executed is shown in Figure 3.1; the annual cycle covers about 15 months.
Oct Nov. Dec Jan. Feb. Mar. Apr. May Jun. Jul. Aug. Sep. Oct. Nov. Dec. Jan. Sand Region (entire) Sand region (wet areas) Loess Region Clay Region Peat Region
sampling of water leaching from root zone (including ditches if present). sampling ditch water
sampling is usually performed during a part of the month Month
Soil Region
Figure 3.1 Implementation period of sampling sub-projects, aggregated per region
Preparatory fieldwork
Prior to the start of water sampling, RIVM staff visit each new LMM farm. During this first visit, general information is collected through a standardised survey. Based on this visit a so-called field file is prepared containing farm-related information such as a map of the various parcels of land and the position of sampling points.
Sampling methods and procedures
The sampling method depends on the medium sampled. For the sampling of groundwater LMM applies different methods in each region (Annex 7).
Normally, groundwater is sampled from temporary boreholes with or without screen (as a function of the soil type). Water from tile drains, ditches and surface drains is collected by using simple jugs. Annex 7 provides detailed information on the different sampling methods.
In the regular monitoring programmes the water leaching from the root zone
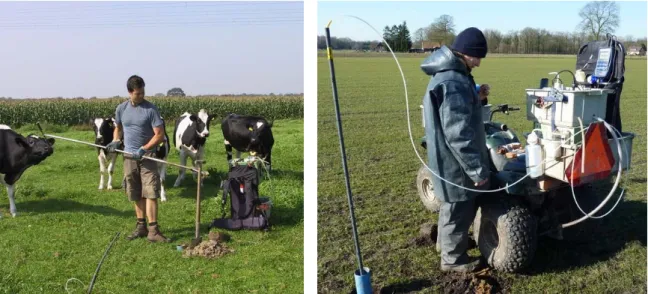
(groundwater) is sampled at 16 locations per farm. Water from ditches is sampled at 8 locations, from tile drains and surface drains at 16 locations. For the purpose of the VM sub-programme, groundwater samples are taken at 48 locations per farm. Sandy soil with its coarse texture is usually quite permeable. Consequently, most of the rain water surplus infiltrates vertically towards the groundwater. For this reason, samples on sandy soils are normally taken from the top 1 meter of the groundwater (see Figure 3.2). If the groundwater level is deeper than 5 m below the surface, soil moisture is sampled. Routine sampling takes place in the summer period (once per year). At a subset of the farms, located in the wet parts of the sand region, additional sampling is done during winter. In those parts groundwater is sampled (once), as well as drain water and ditch water (4 times during winter). Sampling of drain water is illustrated in Figure 3.3.
Figure 3.2 Open auger boring for sampling of groundwater on sandy soils
Clay soils are fine grained; usually, they are impervious. Only part of the rainfall surplus infiltrates to the groundwater. The remainder is drained (either overland or through tile drains) towards ditches, and ultimately to larger surface water. In the clay region LMM distinguishes drained farms (tile drains on more than 25% of a farm’s acreage) and undrained farms (less than 25% of the acreage drained by tile drains). At drained farms, LMM samples the drains and ditches (4 times during winter). At undrained farms, LMM samples the top 1 m of the groundwater (2 times during winter) and ditches (4 times during winter including 2 times during groundwater sampling). Also in the peat region, where water is often abundant (shallow groundwater table), the rainfall excess partly recharges the groundwater but most of the excess is drained towards ditches. For that reason, both groundwater (once per year) and ditch water is sampled (4 times per year including once during groundwater sampling). Since 2007, LMM samples surface drains at 12 farms, 4 times per year during the winter season. In the loess region (with the groundwater table usually deeper than 5 m below ground level) it is not possible to sample groundwater by hand boring using the open auger method. Here the unsaturated soil is sampled from a depth of 1.5 to 3.0 m below the surface. The laboratory test the water quality of the soil moisture.
Since 2008 ditch water is also sampled during the summer period (4 times) in the clay region and peat region, as well as in the wet part of the sand region.
Sample containers and sample conservation
Field staff, responsible for water sampling, are equipped with sample containers (bottles), suitable for the different analyses, stickered with pre-printed labels
specifying the farm visited, sampling round and medium sampled. These pre-printed labels prevent inaccuracies and mistakes in sample identification. If required for conservation purposes, samples are acidified in the field, using H2SO4 or HNO3
(depending on the type of analyses planned). Since the end of 2010, acids are now being added to the bottles by the laboratory prior to sampling. All water samples are filtered over a 45 µm, 300 mm2 membrane filter. Groundwater samples are filtered in
Samples of drain water and ditch water are filtered in the laboratory. However, ditch water sampled at the time of groundwater sampling are filtered and pre-treated in the field as well.
Table 3.2 summarises the sampling bottles used and their characteristics per medium sampled.
Table 3.2 Characteristics of sample containers for different water types
Medium sampled Type of bottle Volume (ml) Filtration in field Acidified Analysis package* Groundwater Glass** PE PE 100 100 250 Yes Yes Yes Yes (H2SO4) No Yes (HNO3) A B C Tile drain water PE PE 100 250 No*** No*** No*** No*** B A+C Ditch water PE PE 100 500 (3-4 samples) 1000 (2-3 samples) 1500 (1 sample) No*** No*** No*** No*** B A+C
Soil moisture Glass PE 720 for indiv.sample 1500 for composite sample Not appl. Not appl. No No -- A+B+C
* A: DOC, ortho-phosphate, total nitrogen and ammonium
B: chloride, nitrate, nitrite, sulphate, specific conductance and pH C: metals
** In 2010 a 125 ml PE bottle replaced the glass bottle *** Filtration and acidification done in laboratory
Figure 3.3 Sampling of underwater drains using electrical pump
Storage and transport of water samples
Storage and transport of water samples is done in accordance with a standard Work Instructions (Annex 7). For the (temporary) storage of samples in the field, there are two options or a combination of both. Option I is the use a portable cool box with cooling elements; this option is often used as temporary solution during transport
between two or more sampling points. After short intervals, the samples are transferred to a fixed or mobile fridge in the fieldwork vehicle, which represents the Option II.
Normally, the samples are transported to the laboratory on the day of sampling itself. This is done by the fieldworker or by sending one or more cool boxes by courier service. If this is not possible, the field-worker is responsible for keeping the samples in a refrigerator at a constant temperature of +4 °C.
Provisions for optimising the quality of water sampling
All aspects of water sampling and the subsequent steps of treatment, storage and transport to the laboratory are described in detail in different ‘Work Instructions’, previously called ’standard operating procedures’ (Annex 7). Further information is given in section 3.2.4.
Because the work in the field often has the character of assembly line work, extra efforts have been made to avoid errors. In this framework, the following provisions are made:
Use of pre-printed labels for sample bottles;
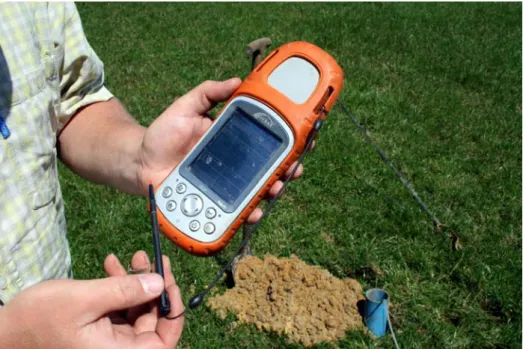
Use of handheld computer with pre-formatted menus for data recording of field data (Figure 3.4);
Strict quality control of recorded information. The data collected in the field are transferred, at least once per week, to the Fieldwork Supervisor at RIVM´s headquarters. Before data storage in the central database, data are checked for completeness and consistency. Any issues are cleared with the fieldworker.
Figure 3.4 Hand-held computer used for recording of field data
Implementing agents of water sampling
The bulk of the fieldwork is outsourced to external parties. RIVM remains the principal agent with respect to overall planning, first time visits of new participants, sampling of groundwater, quality control and for fieldwork in special monitoring programmes (VM and scouting).