FOCUS-WINDOW TRACKING:
TAILORING THE PARAMETERS
Aantal woorden / Word count: 24.326
Wolf Boone
Stamnummer / student number : 01509050
Promotor / supervisor: Prof. Dr. Geert Poels
Masterproef voorgedragen tot het bekomen van de graad van: Master’s Dissertation submitted to obtain the degree of:
Master in Business Engineering: Data Analytics
Preamble
The purpose of this preamble is to clarify whether the Covid-19 pandemic had consequences for this research.
There was no direct impact on this master’s dissertation because all of the data was gathered through an online tool and an online survey. When developing a Focus-Window Tracking tool, it was deliberately chosen to make both an online and an offline version. Having the online version later proved to be hugely beneficial in overcoming the restrictions imposed by the Covid-19 pandemic.
Confidentiality agreement
PERMISSION
I declare that the content of this Master’s Dissertation may be consulted and/or reproduced, provided that the source is referenced.
Preface
The choice for this subject was initially motivated by my interest in programming. Besides expanding my knowledge in software development, this dissertation also brought me into contact with research in psychology and cognitive science.
Writing this dissertation was certainly an insightful addition to my curriculum.
In the first year of my master’s degree, I focused on the development of a research tool, which I used in research during the second year. Throughout the entire process, I came across many obstacles. The broadness of this topic was undoubtedly the most challenging one. This obliged me to make reasoned choices all the time. By doing so, I trained a very valuable skill which I will certainly need again in life.
This dissertation required a lot of effort, but I would not be able to accomplish this result without the help and support of others. I would like to thank Dr. Claes for providing an initial topic for this dissertation as well as for his critical style of feedback, which forced me to question every decision I made continually. I would also like to thank Prof. Dr. Poels for his feedback and support, especially during the completion of this dissertation. Additionally, I would like to thank Prof. Dr. Gailly for distributing one of my studies among his students.
Further, I would like to thank Siska Pottie and John Boone for proofreading this work.
Ultimately, I would like to express my gratitude towards my parents, my sister, family and friends for their moral support. Not only during the writing of this dissertation but throughout the completion of my entire higher education. I am very grateful to my parents for giving me the opportunity to study.
Table of contents
PREAMBLE ... II CONFIDENTIALITY AGREEMENT ... III PREFACE ... IV TABLE OF CONTENTS ... V LIST OF USED ABBREVIATIONS ... VIII LIST OF TABLES ... IX LIST OF FIGURES ... X
CHAPTER 1: INTRODUCTION ... 1
CHAPTER 2: BACKGROUND ... 4
2.1VISUAL ATTENTION ... 4
2.2VISUAL ATTENTION TRACKING TECHNIQUES ... 4
2.2.1 Eye tracking ... 5
2.2.2 Focus-Window Tracking ... 6
2.2.3 Restricted Focus Viewer (RFV) ... 16
2.2.4 Enhanced Restricted Focus Viewer (ERFV) ... 17
2.3LEARNING STYLE ... 19
2.3.1 Theory ... 19
2.3.2 Measurement ... 20
CHAPTER 3: SOFTWARE TOOL ... 22
3.1DESCRIPTION ... 22
3.2STRUCTURE OF THE TOOL ... 24
3.2.1 Introduction window ... 24
3.2.2 First core functionality: parameter settings ... 24
3.2.3 Second core functionality: FWT experiment ... 26
3.2.4 Additional features ... 26
3.2.5 Output ... 27
3.3USE CASES ... 28
3.4PILOT TEST ... 28
CHAPTER 4: STUDY 1 (PULLEY SYSTEM) ... 29
4.1METHOD ... 29
4.1.2 Materials and Design ... 29
4.1.3 Procedure ... 31
4.1.4 Data treatment ... 33
4.2RESULTS ... 35
4.2.1 General parameter preferences ... 35
4.2.2 Influence of characteristics on parameter preferences ... 38
4.2.3 Impact of parameters on performance ... 40
4.3DISCUSSION ... 41
4.3.1 General parameter preferences ... 41
4.3.2 Influence of characteristics on parameter preferences ... 44
4.3.3 Impact of parameters on performance ... 45
CHAPTER 5: STUDY 2 (BPMN-DIAGRAM) ... 47
5.1METHOD ... 47
5.1.1 Participants ... 47
5.1.2 Materials and Design ... 48
5.1.3 Procedure ... 48
5.1.4 Data treatment ... 49
5.2RESULTS ... 51
5.2.1 General parameter preferences ... 51
5.2.2 Influence of characteristics on parameter preferences ... 54
5.2.3 Impact of parameters on performance ... 55
5.3DISCUSSION ... 57
5.3.1 General parameter preferences ... 57
5.3.2 Influence of characteristics on parameter preferences ... 59
5.3.3 Impact of parameters on performance ... 60
CHAPTER 6: CONCLUSION AND FUTURE RESEARCH ... 62
6.1CONCLUSIONS ... 62
6.2FUTURE RESEARCH ... 65
6.2.1 Recommendations for future research based on limitations of this research ... 65
6.2.2 Recommendations for future research based on findings of this research ... 66
BIBLIOGRAPHY ... XI APPENDIX ... 1
-2.1GRADED BLURRING EFFECT USING TRANSITION REGIONS ... -1-
2.2QUESTIONS LEARNING STYLE ... -1-
3.1INTRODUCTION WINDOW ... -3
3.3FWT EXPERIMENT WINDOW ... -5-
3.4TIMER WINDOW ... -5
-3.5PARAMETER SETTING OUTPUT ... -6-
3.6FWT EXPERIMENT OUTPUT ... -6-
4.1PULLEY SYSTEM STIMULUS ... -7-
4.2STUDY 1(PULLEY SYSTEM):DESCRIPTION OF PARTICIPANTS ... -8-
4.3PULLEY SYSTEM PERFORMANCE PER QUESTION ... -9
-4.4QUESTIONNAIRE STUDY 1:PULLEY SYSTEM (QUALTRICS) ... -10-
5.1BPMN-DIAGRAM STIMULUS ... -13-
5.2STUDY 2(BPMN-DIAGRAM):DESCRIPTION OF PARTICIPANTS ... -14-
5.3BPMN-DIAGRAM PERFORMANCE PER QUESTION ... -15
List of used abbreviations
- approx. approximately
- CSV comma-separated values
- ERFV Enhanced Restricted Focus Viewer - FWT Focus-Window Tracking
- ILS Index of Learning Styles
- In inches
- int integer
- ms milliseconds
- N/S not specified - N/A not applicable
- px pixels
- RFV Restricted Focus Viewer - RQ research question
List of tables
TABLE 1: GUIDELINES FOR SETTING RFV PARAMETERS (BLACKWELL,JANSEN,&MARRIOTT,2000,TABLE 1) ... 14
TABLE 2: COMPARISON OF EXPERIMENTAL PARAMETERS ... 15
TABLE 3: RFV DATA DESCRIPTION ... 17
List of figures
FIGURE 1: AN EXAMPLE OF THE FOCUS-WINDOW TRACKING TECHNIQUE (JONES &MEWHORT,2004,FIGURE 1) ... 8
FIGURE 2: INDEX OF LEARNING STYLES SCORES ... 21
Chapter 1: Introduction
Focus-Window Tracking (FWT) is a technique to track visual attention. In essence, an image is blurred and displayed on a computer screen, while only a small area of the image is in focus at any point in time. The participant can move this unblurred area using his computer mouse. The technique records what the participant is focusing on when he is judging the visual stimulus (i.e. image), through the location of the computer mouse (Blackwell, Jansen, & Marriott, 2000). There are numerous ways to implement this technique, each defined by a particular combination of parameters that materialize a Focus-Window Tracking experiment.
After carefully reviewing the current literature available on the FWT technique, we feel that there is still a considerable blind spot on how the parameters of an FWT experiment should be set optimally in order to get a valid result. To guarantee the validity of the result, it is essential that the parameters used in an FWT experiment do not affect the strategy used by humans to comprehend a visual stimulus. In previous FWT experiments, most of the parameters were set based on intuition and through rules of thumb, which may prevent getting the most out of this technique.
This parameter topic was only touched by Blackwell, Jansen, & Marriott (2000, Table 1), who proposed very broad directives on some parameter settings, and by Jones & Mewhort (2004), who highlighted the importance of calibrating the information filter1 through the use of
appropriate parameter settings. Additionally, Tarasewich & Fillion (2004) acknowledged the lack of research on the parameters by stating that “Blurriness levels and focus window parameters need to be examined more closely to determine the most appropriate settings for [usability] testing.” (Tarasewich & Fillion, 2004, p. 3155). This acknowledgement can be generalized across different FWT application fields.
1 The term information filter as defined by Jones & Mewhort (2004) corresponds to the degree of blurring used throughout this work. When the term information filter is used in this work it has a broader meaning as it refers to a combination of different parameters (cf. infra).
The main objective throughout this dissertation is to help filling this gap in research on Focus-Window Tracking parameters.
The contribution of this dissertation is twofold. Firstly, a new software implementation of the FWT technique is proposed, which allows the user to carefully examine and tailor the FWT parameters for a particular stimulus. This tool can both be used to conduct research on these parameters and to tailor the parameters for subsequent FWT research.
The second contribution is to provide an exploratory method to find detailed guidelines for researchers on how to set the parameters for an FWT experiment on particular stimuli, using the proposed software tool. Besides coming up with more concrete setting guidelines for existing parameters, a new parameter (i.e. the pictogram) is introduced and assessed.
The purpose of these guidelines is to improve the validity of the FWT technique.
These guidelines take into account the observed parameter preferences of the target group while not losing sight of the impact on judgment performance2. By complying with these guidelines,
the researcher can come up with parameter settings that are less obtrusive for the participants during an FWT experiment, because they correspond to the participant’s preferences. These less obtrusive settings, in turn, are assumed to alter the natural visual information acquisition strategy3 to the minimum extent possible, improving the validity of an FWT experiment with
these settings4.
The parameter settings are also linked to the judgement performance in order to assess if the parameter-tailored FWT technique still allows decent judgment of the stimulus on which the visual attention is tracked. Which information was acquired from a stimulus in order to solve a judgement task is only interpretable when it was feasible to perform the task given the chosen
2 How well a participant can judge the stimulus, given the parameter settings that materialize the FWT experiment. This performance is measured with questions about the stimulus.
3 The strategy used by humans to acquire and comprehend visual information in the real world, when they are not the subject of any visual attention tracking technique.
4 Haynes & Heiby (2004) state that the validity of observational data can be increased by using less obtrusive observation methods.
parameter settings. If the judgment performance were to be impacted by the parameter settings, the validity of the tracked visual attention is threatened.
Two research questions are put forward to realize this contribution.
RQ 1: Which parameter settings are preferred by the participant in an FWT experiment? RQ 2: How do different FWT parameter settings impact the judgement performance? The first research question is split into two parts. Firstly, the generally preferred settings are assessed. Secondly, a distinction is made based on certain different demographics and cognitive characteristics of the participants. This distinction allows to determine the preferred setting for different groups having different characteristics, resulting in specific parameter setting guidelines for each target group.
The second research question examines the association between FWT parameter settings and the judgment performance on the stimulus. This way, the researcher gets an idea to what extent the specific parameter settings will infer the judgment performance before those settings are converted into guidelines.
To answer both research questions, the method is structured as follows: An observational study is conducted in which the parameter setting behaviour is observed, and the association between the parameter setting and the judgment performance is studied.
Two studies were conducted on two different visual stimuli (i.e. a pulley system and a BPMN- diagram) to demonstrate the proposed method in different research fields. The outcome of these studies is a set of parameter guidelines, which are specifically tailored for the stimulus, with some adaptations depending on the target group.
The remainder of this dissertation proceeds as follows: Chapter 2 provides an overview of the related literature. In chapter 3, the custom-made FWT software application is discussed. Next, in chapter 4 and 5, the two studies implementing the proposed method will be elaborated on. Ultimately, chapter 6 will provide a comprehensive conclusion, complemented by suggestions for future research.
Chapter 2: Background
In this chapter, the different concepts on which this dissertation is based will be explained. The main subject, Focus-Window Tracking, is one of the techniques to track visual attention. Therefore, visual attention is elaborated on first. Then, an overview of the prominent visual attention tracking techniques is provided. Focus-Window Tracking will be discussed in more detail, along with the software implementing this technique. Lastly, the focus will be on learning styles and the relation with the visual information acquisition strategy.
2.1 Visual attention
Every day, we are confronted with millions of visual stimuli. It would, however, be impossible to completely process all these stimuli. The amount of perceptual or cognitive resources that humans have at their disposal is limited (Redlick, Jenkin, & Harris, 2001). This is where attention comes into play to allocate these resources. “Attention … is the mechanism that turns looking into seeing. Ignoring irrelevant information is what makes it possible for us to attend and interpret the important parts of what we see.” (Carrasco, 2011, p. 1485). Because of this attention mechanism, the selective processing of the vast amount of information with which we are confronted every day becomes possible. By focusing on a specific location or aspect of the visual field, we decide to prioritize this information, while disregarding other available information (Carrasco, 2011). Visual attention can be approached both at the level of the full visual field and at the level of individual stimuli. When applied on the full visual field, one seeks to determine how visual attention is allocated over multiple stimuli in this field. When, on the other hand, applied on an individual stimulus, one seeks to determine how the visual attention is allocated over the different elements within this stimulus. This work solely focusses on the individual stimulus level.
2.2 Visual attention tracking techniques
Many visual information disciplines are trying to figure out how attention is allocated to information in visual stimuli, in order to determine which information in the stimulus is essential to be able to perform a particular judgement task. This is where visual attention tracking is
employed. Visual attention tracking comprises a collection of methods which trace the allocation of attention towards a visual stimulus.
To determine the location of a person’s focus of visual attention, multiple categories of techniques are used. The first category is eye tracking. This field is by far the most researched and has countless practical applications. A second category of visual attention tracking is the Focus-Window Technique. This topic will be prominent throughout this work. The third method that can be used for visual attention tracking is Mouse Tracking (Cooke, 2006). This research field is based on the correlation between mouse movements and eye movements. However, as research suggests that this correlation is not proven (Huang, White, & Buscher, 2012), we will not delve further into this latter category. Other techniques, such as saliency modelling (Masciocchi & Still, 2013), are used to predict where humans will allocate their visual attention based on the characteristics of the stimulus. These techniques are however beyond the scope of this dissertation, as they do not track actual visual attention.
It should be noted that none of the visual attention tracking techniques gives an answer to why the attention is directed to a specific location.
2.2.1 Eye tracking
Eye tracking is a technique that measures where one looks. The hardware device needed for the measurement is called an eye tracker. Without discussing the technical details, it is in essence a camera which records the movement of the eyes, thereby determining the point-of-gaze5. Two
types of eye trackers exist: one is head-mounted while the other one is table-mounted.
The tracking of visual attention is established through tracking of the point-of-gaze. In most of the cases, the attention location and the gaze point location correspond. Rayner (1998) indicates that this is however not always the case as the gaze point may travel independently from the visual attention during saccadic eye movement. Saccadic eye movements are rapid manoeuvres of the eyes that abruptly change the point of fixation. (Purves et al., 2001). During these
5The point-of-gaze is described as “the intersection of the line of sight with the surface of the object (such as a
movements, no information is processed. Such eye movements are filtered out for analysis of the visual attention with eye tracking.
Eye tracking is used for countless purposes. It has become an integral part in applied research of, among others, psychology, medicine, marketing and education. This technique is useful because it reveals the subconscious looking behaviour. More recently, the behaviour recorded by the eye tracker is assumed to correspond even better with the natural looking behaviour as some current eye trackers have become reasonably unobtrusive (e.g. webcam). Eye tracking also provides a high level of detail.
There are nevertheless some drawbacks that come with this technique. First of all, accurate eye-tracking equipment is expensive. Secondly, many eye trackers remain obtrusive for the participant, which may influence the natural behaviour. Jansen, Blackwell, & Marriott (2003) noted that repeated calibrations and head-mounted gear might influence the participant’s looking strategy. Thirdly, environmental conditions (e.g. daylight) impact the measurements. In addition, the data is labour-intensive to extract (Robert J. K. Jacob and Keith S. Karn, 2009) and can be difficult to interpret. Lastly, it is impossible to determine at any point in the data if a person was focusing on one single element in the stimulus or on multiple elements (Jansen et al., 2003). Although eye tracking is generally accepted as by far the most prominent tool to track visual attention, the technique still has some drawbacks which need to be solved in the future or which could be overcome by alternative tracking techniques. This dissertation does not focus on eye tracking, but the technique was shortly mentioned to provide the necessary background to understand the upside potential of alternative attention tracking techniques.
2.2.2 Focus-Window Tracking
Focus-Window Tracking (FWT) is a technique used to study the information acquisition and visual attention (Blackwell et al., 2000), (Jansen et al., 2003), (Jones & Mewhort, 2004). This tracking is achieved through blurring the original stimulus on a screen, making the participant scan for information with a clear window (the focus window) that he can move with his computer mouse. The technique records what the participant is focusing on when he is judging the stimulus, through the location of the computer mouse.
The use of a visual restriction (blurring) on the visual field is not a new phenomenon. This idea had already been applied in research on reading (Osaka & Oda, 1994),(Henderson, Pollatsek, & Rayner, 1989) and software manual understanding (Ummelen, 1997). The use of a movable window was also used before in research on visual search (Stark et al., 1992). The difference with the FWT is however that this technique combines these features into one generic method (Blackwell et al., 2000).
The blurring of the original stimulus acts as an information filter 6. It makes sure that some of the
information that is in the original stimulus can only be acquired when the focus window shows a specific part clearly, without any blur. This way, the researcher may know exactly which information was acquired from the stimulus through a track record of the focus window’s location. The locations are assumed to indicate which part of the original stimulus was used by the subject to make a judgement about this visual stimulus. Although the eyes can move freely over the whole stimulus without moving the focus window, this does not impact the tracking of information acquisition as information needed for judgement is only disclosed in the focus window. As opposed to saccadic7 eye movements, the movements of the focus window are
mainly intentional (Jansen et al., 2003). Unintended computer mouse movements are much less likely than saccadic eye movements because these movements require a specific physical movement of the mouse, which does not happen subconsciously.
In contrast with the above-mentioned Mouse Tracking technique, in FWT there is a clear relation between visual attention and the path followed with the focus window because the allocation of visual attention outside of the focus window would not give access to relevant information.
An example of the FWT technique is illustrated in Figure 1 (Jones & Mewhort, 2004, p. 271). The stimulus used in this example is a close up of a persons’ eyes. The experimental task that came along with the stimulus was the judgement of the person’s gender.
6 The term information filter as defined by Jones & Mewhort (2004) corresponds to the degree of blurring used throughout this work. When the term information filter is used outside of this chapter in this work, it has a broader meaning as it refers to a combination of different parameters (cf. infra).
7 “Rapid, ballistic movements of the eyes that abruptly change the point of fixation.” (Purves et al., 2001, Chapter
Panel A shows the original visual stimulus. In panel B, a Gaussian blur function (cf. infra) was applied to the original stimulus. Panel C shows the blurred stimulus together with a focus window to inspect it. Finally, in panel D, we see the path over which the focus window was moved to inspect the stimulus in order to solve the judgement task.
The information filter (blurring) mentioned above should however not block all the information from the original stimulus. Subjects should still have some information available to be able to navigate their focus window toward parts of the stimulus which they suppose relevant. Jones & Mewhort (2004) describe this first type of information as the navigation information. This navigation information should be accessible through the blurring applied on the image (cf. infra).
Because this type of information is accessible through the information filter, it is not represented in the scan path data. This is however not a problem as researchers are only interested in the attention directed towards a second type of information. This second type of information, defined by Jones & Mewhort (2004), is the diagnostic information. This type of information allows the subject to make a judgement about the stimulus, which are necessary to perform an experimental task (e.g. judge the gender of the person on the image). Diagnostic information is task-dependent.
Both Jones & Mewhort (2004) and Jansen, Blackwell, & Marriott (2003) stress the importance of the balance between these two types of information. Jansen, Blackwell, & Marriott (2003) state that:
Figure 1: An example of the Focus-Window Tracking technique.
(A) the original image;
(B) the image with a Gaussian blur filter applied; (C) the filtered image with a focus window;
(D) search coordinates recorded from the focus window across a trial.
“[the blurred stimulus] should reveal enough information to allow a subject to successfully navigate from one region of interest to another [but] subjects should not be able to identify different syntactic elements without moving the focus window over them.” (Jansen et al., 2003, p.59)
When blurring the stimulus, the ultimate goal is to block all the diagnostic information, while displaying all navigation information (i.e. calibrating the information filter). The diagnostic information should only be accessible through the focus window. When diagnostic information leaks through, the data will be biased and can lead to incorrect conclusions. This affects the validity of an FWT experiment. Achieving the aforementioned goal is however not always possible as this goal can lead to the following circular reasoning: The Focus-Window Tracking technique is used to determine which information in a visual stimulus is used for judgements about the stimulus (diagnostic information) But for the FWT to have the most reliable outcome, all the diagnostic information should be blocked and only the navigation information should leak through the filter (Jones & Mewhort, 2004). The attentive reader notes that the exact diagnostic information might not be discovered because it had to be known a priori to calibrate the information filter. We can partly overcome this problem by using knowledge from other studies on the diagnostic information (e.g. eye tracking) or use intuition and rules of thumb to determine which information is diagnostic.
It should be noted that different visual stimuli require a different information filter, as they contain different information. The information filter should always be calibrated before it is used in an FWT experiment
As mentioned above, the visual stimulus has to be blurred to reduce the amount of information it releases. The most common way to blur an image is the Gaussian blur method. In this method, each pixel of the image is transformed using a gaussian function. This smooths out the image by reducing the contrast between different pixels, resulting in a blurred image. The higher the blurring radius is set, the heavier an image is blurred, and the less information it discloses.
Terminology
An important remark has to be made about the terminology that is used throughout this research field. The original paper that came up with this technique (Blackwell et al., 2000) used the term Restricted Focus Viewer (RFV). This term, however, refers to the specific implementation of the technique in a computer program. Later research modified this RFV research tool to suit research objectives better (Tarasewich, Pomplun, Fillion, & Broberg, 2005) (Romero, Cox, du Boulay, & Lutz, 2002). Although the term Restricted Focus Viewer was used interchangeably by many authors for both the general technique as well as the computer program implementation, we opt for the term Focus-Window Tracking (FWT) (Jones & Mewhort, 2004) to name the technique. This nomenclature should, in our opinion, also be adopted by future research to ensure a clear distinction between the technique and the implementation in a program. Continued research will benefit from unambiguous naming.
Pictogram
An alternative way to make the navigation information available, while hiding the diagnostic information could be through the use of a pictogram. This is a miniature of the original stimulus which provides an overview of where the different elements in the stimulus are located, while not revealing any information that could be used for the judgement task on the stimulus. The legibility and comprehension of the pictogram depend on the size of the elements and their separators as well as on the contrast between elements in the original stimulus (Tijus, Barcenilla, De Lavalette, & Meunier, 2007). It is crucial to find an equilibrium between a too-small pictogram which reveals hardly any navigation information and a too-large pictogram from which diagnostic information could be extracted. The first case would not add value for the respondent, and the second case would make the conclusions drawn from the focus window data completely unreliable. To the best of our knowledge, a pictogram has never been used in FWT research. This research therefore assesses whether the use of a pictogram could potentially be beneficial.
Comparison with eye tracking
This technique shows similarity with eye tracking to some degree, but there is consensus among the authors in the FWT field that it could not replace eye tracking. Jones & Mewhort (2004) argue that both techniques answer a different question. When the question is how a stimulus is scanned naturally, eye tracking should be used. If the question, on the other hand, is what
information is used to make a judgement, both eye tracking and FWT are appropriate. Jansen et al. (2003) claim that eye tracking should be preferred over FWT for some stimuli (e.g. when the stimuli contain many objects of different sizes).
The main advantages of the FWT technique over eye tracking are its reduced cost and the ease to set up and automate. An FWT experiment does not require a dedicated laboratory space and can be run with multiple subjects simultaneously, as long as there are multiple computers available. Additionally, there is no need for recalibration during an experiment on a particular stimulus, no need for specific gear and no risk of data corruption by blinks or glances away from the stimulus. Because of the redundancy of specific gear, the FWT is physically less intrusive for the participants. Finally, the participant can wear glasses, whereas this may cause problems for eye tracking experiments (Blackwell et al., 2000), (Jansen et al., 2003), (Tarasewich & Fillion, 2004).
The FWT technique however also raises some concerns. The main concern is that the use of the FWT technique would impact the high-level strategy of information acquisition used by the participant. Jansen et al. (2003) indicate that the issue is not just confined to the FWT technique. In eye-tracking also, repeated calibrations and head-mounted gear may influence participant’s strategy.
This issue is discussed for the FWT technique in the following paragraph.
Validity
A prominent question that is asked when considering if FWT is suitable to track visual attention is whether it interferes with the natural human strategy when analysing a visual stimulus. In order to use this technique for experimental purposes, the strategy used by the participants should be impacted as little as possible, even though the stimulus is blurred and they have to use their mouse to see it. (Jansen et al., 2003). This is necessary to guarantee the validity. In other words, one needs make sure that the information acquisition strategy in an FWT experiment (i.e. “that what is measured”) closely corresponds to the natural information acquisition strategy (i.e. “that what one wants to measure”).
Some authors moot that using the FWT is not in line with how people naturally observe a stimulus, which could lead to biased conclusions about real-life behaviour. For example, Arroyo,
Selker, & Wei (2006) state that this technique is likely to impact the behaviour when surfing the web. This concern was however contradicted by Tarasewich, Pomplun, Fillion, & Broberg (2005) by demonstrating the validity of the ERFV in their research on hyperlinked web pages using an FWT/non-FWT condition in combination with eye tracking.
In an experiment comparing the RFV with eye tracking on pulley system stimuli, Jansen et al. (2003) found that the strategy for assigning visual attention to the stimulus is not significantly different for these two techniques. This finding thus serves as a validation of the RFV tool for analysis of (basic) pulley systems. Bednarik & Tukiaeven (2007) point out that this validation can only be generalized for relatively simple stimuli.
Jansen et al. (2003) nonetheless note that changing (decreasing) the focus window size of the RFV to track the attention of the respondent more precisely will change the strategy used to analyse the stimulus. The necessity of using a computer mouse to move the focus window is assumed not to impact the strategy (Blackwell et al., 2000), but it however slows down the process of analysis (Sibert & Jacob, 2000).
In order to make substantiated statements about whether or not the search strategy is affected by the use of the FWT technique, research with a within-subjects design and an FWT/non-FWT condition is needed for all types of stimuli. Eye tracking can be used to track how visual attention is allocated in both conditions. This way, research can assess whether or not this FWT/non-FWT condition leads to significant differences in the visual attention allocation strategy. Besides Jansen et al. (2003) and Tarasewich, Pomplun, Fillion, & Broberg (2005), Bednarik & Tukiainen (2004,2007) also used this approach in their study on visual attention in Java program debugging. They found that the way that visual attention was allocated differed between the two experimental conditions (RFV/no RFV). This indicates that the use of the RFV influences the strategy of visual attention allocation in this specific case. These findings should, however, be interpreted with great caution for several reasons. First of all, the tool used for this experiment was an adaptation of the original RFV (Romero, Cox, et al., 2002). It required the subject to click on a particular part of the debugging environment to locate the focus window, so the focus window no longer follows the mouse movements. In addition, the tool also enabled scrolling, so that larger stimuli could be used. Because this method is different from the one used in the original RFV, their results cannot just be generalized for all FWT methods. Secondly, this study was done on Java program debugging, which is a cognitively demanding task. This may partly
explain the difference with validation conclusions by Jansen et al. (2003) and Tarasewich et al. (2005), which were on less demanding cognitive tasks. A third reason for caution is the parameter settings8 used for this experiment. The size of the focus window was very large, allowing subjects
to see much information within the focus window. This makes the tracking of visual attention much less accurate. Also, the sampling frequency of the RFV was low, which reduced the amount of detail that could be captured within this experiment. These last two issues negatively impact the reliability of the conclusions.
The reason that the FWT technique would influence the information acquisition strategy is that it is perceived as obtrusive compared to the way people naturally observe a stimulus. In order to reduce the level of obtrusiveness to a minimum, the parameters, determining the appearance of an FWT experiment, should be adjusted so that they are in line with how people want to analyse a stimulus. This is where the proposed parameter tailoring method of this dissertation attempts to contribute.
Generally speaking, more research is needed to assess the impact that FWT has on the information acquisition strategy in different application fields, as the validity of FWT needs to be demonstrated before the technique will be widely used in various research fields.
Parameter settings in FWT-experiments
Up to now, only two authors discussed the parameters of an FWT experiment.
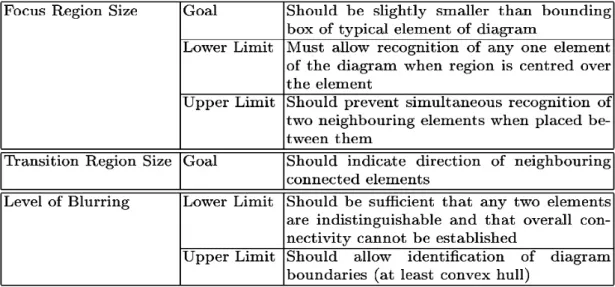
Blackwell, Jansen, & Marriott (2000) proposed very broad directives on some parameter settings (Table 1). These directives only relate to the focus window size, the transition region size (cf. infra) and the level of blurring. They are very generic and need to be specified according to a particular stimulus. Note that there are more parameters that define an FWT experiment (cf. infra). Jones & Mewhort (2004) highlighted the importance of calibrating the information filter9
through the use of appropriate blurring parameter settings. Why this is important for the validity of the tool was discussed in the section above.
8 Consult Table 2 for a complete overview of the parameter settings used in this experiment
9 As was mentioned before, the term information filter as defined by Jones & Mewhort (2004) corresponds to the degree of blurring used throughout this work. When the term information filter is used outside this chapter, it has a broader meaning as it refers to a combination of different parameters (cf. infra).
There is nonetheless no overarching research on how adequate parameter settings could reduce the influence on the natural strategy used by humans to comprehend a visual stimulus. This dissertation tries to bridge this gap in research partly.
Table 1: Guidelines for setting RFV parameters (Blackwell, Jansen, & Marriott, 2000, Table 1)
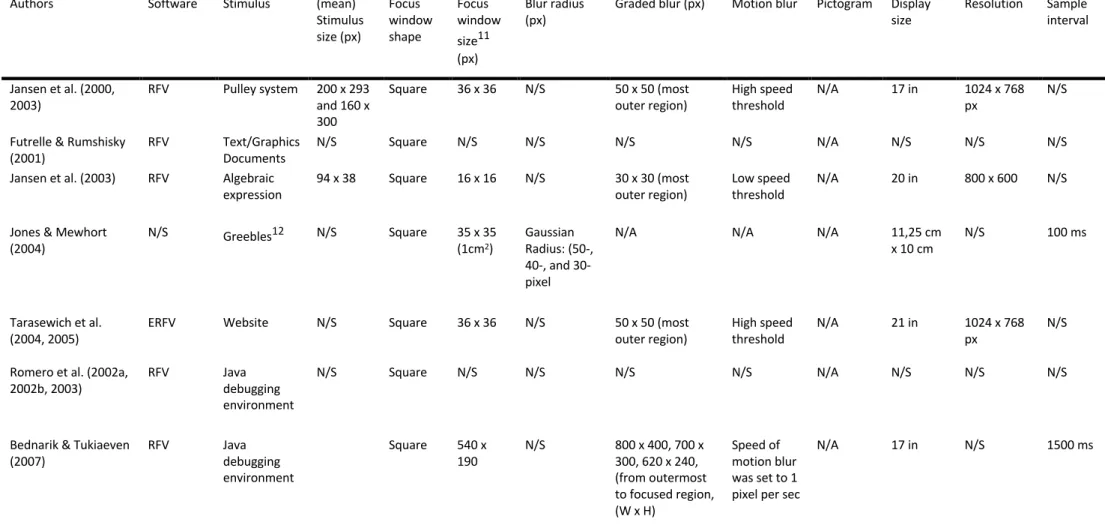
When the parameters of an FWT experiment are assessed, they should not be interpreted individually, because they are all interrelated with each other. This interrelated set of parameters materializes an FWT experiment. Table 2 below gives a schematic overview of all the experiments that were thus far conducted using the FWT technique. All parameters that determine an FWT experiment are incorporated per experiment in order to allow a mutual comparison. The table below gives a first indication that experiments with different stimuli to some extent require different parameters, but it also shows that parameter settings were often replicated from previous experiments.
The research in this dissertation only assesses the parameters that are both software related and visible to the participant, because they can easily be manipulated, and they might have a potential influence on the natural information acquisition strategy. Those parameters are the focus window shape10, the focus window size, the degree of blurring and the pictogram. The
stimulus size was assumed to be fixed as its manipulation is restricted by the screen size. The reason for the exclusion of the graded blur and motion blur parameters is explained later, in section 3.1.
10 Table 2 shows that all experiments used a squared focus window. This research also assesses the round shape as an alternative.
Authors Software Stimulus (mean) Stimulus size (px) Focus window shape Focus window size11 (px) Blur radius
(px) Graded blur (px) Motion blur Pictogram Display size Resolution Sample interval
Jansen et al. (2000,
2003) RFV Pulley system 200 x 293 and 160 x 300
Square 36 x 36 N/S 50 x 50 (most
outer region) High speed threshold N/A 17 in 1024 x 768 px N/S Futrelle & Rumshisky
(2001) RFV Text/Graphics Documents N/S Square N/S N/S N/S N/S N/A N/S N/S N/S
Jansen et al. (2003) RFV Algebraic
expression 94 x 38 Square 16 x 16 N/S 30 x 30 (most outer region) Low speed threshold N/A 20 in 800 x 600 N/S Jones & Mewhort
(2004) N/S Greebles 12 N/S Square 35 x 35 (1cm2) Gaussian Radius: (50-, 40-, and 30-pixel
N/A N/A N/A 11,25 cm
x 10 cm N/S 100 ms
Tarasewich et al.
(2004, 2005) ERFV Website N/S Square 36 x 36 N/S 50 x 50 (most outer region) High speed threshold N/A 21 in 1024 x 768 px N/S Romero et al. (2002a,
2002b, 2003) RFV Java debugging environment
N/S Square N/S N/S N/S N/S N/A N/S N/S N/S
Bednarik & Tukiaeven
(2007) RFV Java debugging environment Square 540 x 190 N/S 800 x 400, 700 x 300, 620 x 240, (from outermost to focused region, (W x H) Speed of motion blur was set to 1 pixel per sec
N/A 17 in N/S 1500 ms
Table 2: Comparison of experimental parameters
11 This refers to the size of the focus window that is not blurred at all. In case a graded blur is used in the focus window, this size the relates only to the inner part of the focus window (non-blurred part).
2.2.3 Restricted Focus Viewer (RFV)
The restricted focus viewer is a computer program that is based on the FWT technique. It allows visual attention directed toward an image presented on a computer monitor to be tracked. The data recorded by this RFV program is very similar to the data of eye tracking. It is a set of time stamps documenting the location of the focus window, whereas eye tracking documents the location of the gaze point.
In the RFV, two specific features are integrated that improve the basic focus window technique. First of all, the standard focus window was adapted to make it look more natural and to prevent guessing behaviour13. Instead of having an abrupt cutoff between the blurred part and the focus
window, a more gradual transition was used. This was realized by putting concentric transition regions with increasing blurring radii around the clear focus window. A detailed illustration of this technique can be found in Appendix 2.1.
Secondly, a motion blur feature was introduced to avoid scanning behaviour. This feature ensures that the stimulus cannot be observed by quickly swiping the focus window over it. The reason for this implementation is the fact that information is not processed during saccadic14 eye
movement (Rayner, 1998). When the user moves the focus window with a speed that is higher than a certain threshold, the focus window gets blurred inside. The degree of blurring in the focus window is however still lower than the blur on the rest of the stimulus so that the focus window can still be distinguished from the rest.
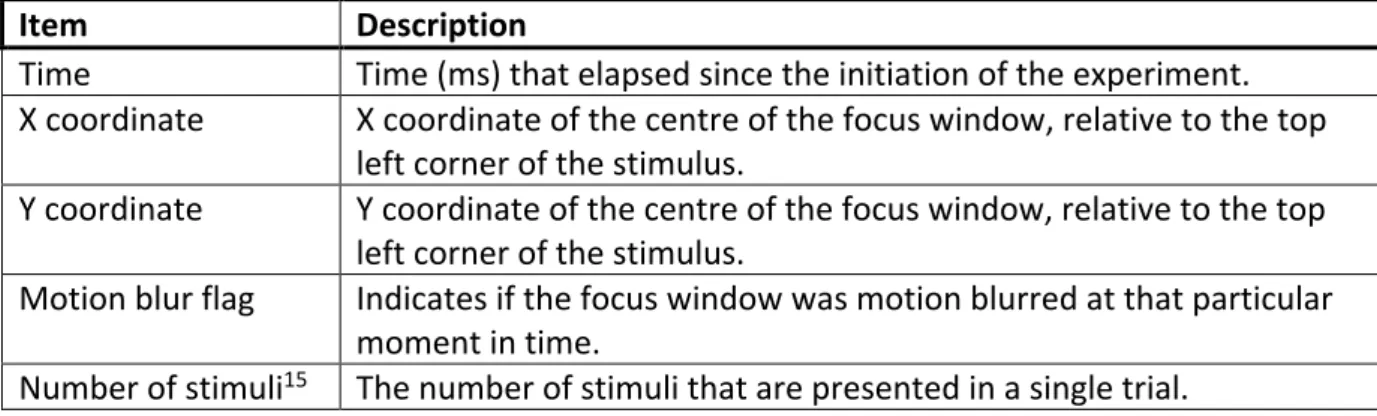
During an experiment with the RFV, data is generated multiple times per second and is recorded in a file. Table 3 specifies the original four items that are sampled at every timestamp (Blackwell et al., 2000). In a later version of the RFV, a fifth item was added to specify the number of stimuli that were presented in a single trial (Jansen et al., 2003).
13 An abrupt cutoff between the blurred part of the image and the focus window would allow users to guess about the neighboring blurred parts due to the Gestalt continuation effect. (Jansen et al., 2003)
14 “Rapid, ballistic movements of the eyes that abruptly change the point of fixation.” (Purves et al., 2001, Chapter
Item Description
Time Time (ms) that elapsed since the initiation of the experiment. X coordinate X coordinate of the centre of the focus window, relative to the top
left corner of the stimulus.
Y coordinate Y coordinate of the centre of the focus window, relative to the top left corner of the stimulus.
Motion blur flag Indicates if the focus window was motion blurred at that particular moment in time.
Number of stimuli15 The number of stimuli that are presented in a single trial.
Table 3: RFV data description
In order to interpret the data from an experiment, the RFV program also includes a Data Replayer module. This functionality can visualize how the focus window was used by the respondent, in an accelerated manner if desired. It draws a line that connects the data points, indicating the path that was followed. For an example of such a path, consult panel D of Figure 1 in previous FWT section. This Data Replayer facilitates the interpretation of the data and allows retrospective interviews with participants on their behaviour.
2.2.4 Enhanced Restricted Focus Viewer (ERFV)
The Enhanced Restricted Focus Viewer (ERFV) is an extension of the previous RFV program. It was developed by Tarasewich & Fillion (2004) for the purpose of usability testing of websites. In usability testing, the goal is to determine if the website’s users found what they were looking for on the site. This is usually assessed through a combination of task times, error rates and subjective satisfaction. These measures can be augmented through think-aloud techniques (Card et al., 2001) and eye tracking of visual attention (Benel, Ottens, & Horst, 1991). Tarasewich & Fillion (2004) however pointed out the drawbacks that these traditional methods have and propose the ERFV as an alternative. The main benefits that the ERFV offers are the reduction in experiment cost, the scalability to multiple experiments at the same time and the usability outside a laboratory environment. Except for eye tracking, the other traditional methods for usability testing also do not allow to track the path of visual attention. Besides the immediate insights that can be drawn from this recorded path, it can also be used to facilitate retrospective think-aloud evaluations. The above reasons justify why the ERFV was developed as an addition to the usability testing toolbox.
Because of the high degree of similarity of the ERFV and the RFV, only the differences between them will be highlighted. First of all, the traditional RFV can only be used to analyse one static stimulus at the time, potentially presented in a fixed sequence. The ERFV extends this capability to multiple hyperlinked stimuli, which represent the different pages of a web site16. The
participant can switch back and forth between the different stimuli. In order to realize the links between the stimuli (i.e. web pages), Tarasewich & Fillion (2004) created a Link Editor. Rectangular boxes were placed on the stimuli to allow navigation to the next stimulus when clicked.
Additionally, the time spent in each of the hyperlinked stimuli is registered, as well as the mouse clicks. Another difference between RFV and ERFV is the implementation. While the RFV was built in Java, the ERFV was constructed using Swing because of this languages’ robustness and modifiability (Tarasewich & Fillion, 2004).
16 Note that individual screenshots of the web pages were needed, as the ERFV is not able to work with HTML web pages. The images are always completely displayed, as scrolling is not possible.
2.3 Learning style
The FWT assesses how visual attention is allocated by participants when performing a judgement task. Each participant has to use his cognitive resources to decide where to assign this attention to acquire specific visual information. Depending on the cognitive profile of the participant, this allocation process might be different. There are many ways to address a cognitive profile. In this dissertation, we decided to only use the learning style theory by (Felder & Silverman, 1988) because we are specifically interested in the reception and processing of visual information in a stimulus. New insights might arise from this interdisciplinary approach.
2.3.1 Theory
Felder & Silverman (1988) studied the concept of learning styles situated in the engineering education field. Their theory combines some major learning style models from Kolb (1984), Lawrence (1993) and Dunn, Debello, Brennan, Murrain, & Krimsky (1981). It is centred around learning in a structured educational setting. They describe this learning as a two-step process that involves both the reception and the processing of information. In the reception step, the students decide which information they will process and which they will ignore. Note that this step is very similar to the attention concept described in the visual attention section. It is however broader, as it is not restricted to only visual information.
The learning style cognitive preference is a model that categorizes the way students learn into different profiles, based on how they receive and process information. The profile is based on five dimensions: perception (sensory and intuitive), input (visual and auditory), organization (inductive and deductive), processing (active and reflective) and understanding (sequential and global). These dimensions are neither original, as some were extracted from other theories, nor comprehensive. Besides this theory on learning styles, many others exist.
For the cause of this research, only the ‘sequential and global learners’ dimension is considered, because we are most interested in how participants ‘understand’ the stimulus.
Within a stimulus, there are often multiple elements (e.g. multiple connected pulleys in a pulley system). In order to form a judgment about the stimulus, one should first understand how the elements in the stimulus are related to each other. The manner in which people deal with multiple interrelated elements is comprised in the understanding dimension of learning styles.
The other four dimensions are less relevant for this dissertation because they focus on aspects that are harder to relate to the FWT technique.
The opposing categories (sequential vs. global) from the understanding dimension are described as follows:
“Sequential learners tend to gain understanding in linear steps, with each step following logically from the previous one. Global learners tend to learn in large jumps, absorbing material almost randomly without seeing connections, and then suddenly “getting it.” “ (Felder & Soloman, 2011,p. 2)
2.3.2 Measurement
Multiple methods are available to measure sequential and global learning style. The Spy Ring History and the Smugglers test from Pask (1988) are both valid and reliable, but are not suited for this research because of their complexity, lengthy duration of 3.5h and demandingness on the learner (Ford, 2000). Besides these two tests, two questionnaires are available, being the Study Preference Questionnaire by Ford (1985) and the Index of Learning Styles (ILS) by (Soloman & Felder, 2005).
More recent research has proposed to predict the global and sequential learning style using only mouse movements on a website (Spada, Sánchez-Montañés, Paredes, & Carro, 2008). This fits in the more general research stream towards automatic student modelling, where the learning style is determined based on the behaviour. This technique is however still in a preliminary stage.
The Index of learning styles is the most used, based on citations. Therefore, we decided to use this questionnaire for this research. The instrument is considered reliable and valid by Cook (2005) when it is used for the purpose of helping instructors achieve balanced course instruction, and helping students understand their learning strengths and areas for improvement. Some caution is required because it is used for a different purpose in this research. In fact, Cook (2005) even state that the learning style profiles are not intended as being infallible predictors of behaviour. Therefore, the validity of the ILS is uncertain for the purpose it serves in this research. The ILS assesses four of the five dimensions from the learning style model described above. It is based on a questionnaire asking 11 questions per dimension with two answer options each. Through the questions, the participant evaluates himself on the four dimensions. These
questions then result in a score (from -11 to +11) that indicates your preference for one of the opposing categories (e.g. global vs. sequential) within a dimension.
Because we are only interested in the understanding (i.e. sequential or global) dimension, only the 11 questions assessing this topic were used. These questions can be found in Appendix 2.2.
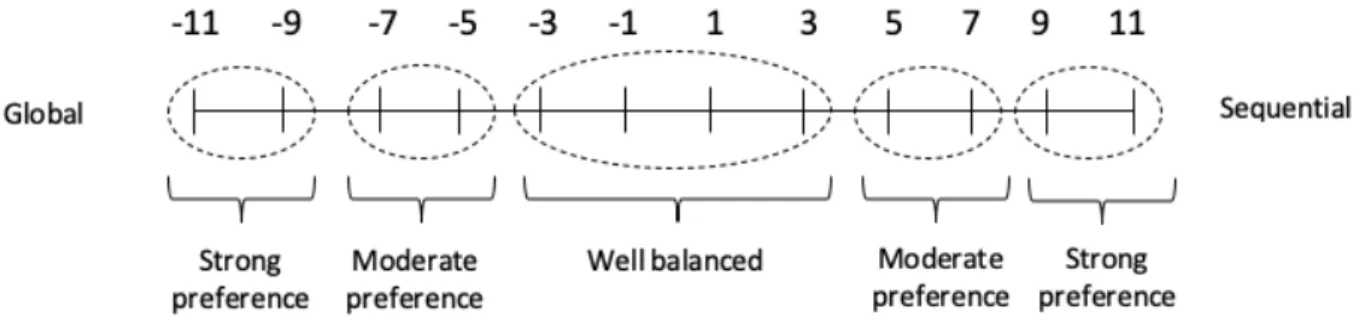
Figure 2 graphically represents the ILS score. A more detailed interpretation of the scores is provided below.
Figure 2: Index of Learning Styles scores
“If [the absolute value of] your score for a dimension is 1 or 3, you are fairly well balanced on the two categories of that dimension, with only a mild preference for one or the other.
If [the absolute value of] your score for a dimension is 5 or 7, you have a moderate preference for one category of that dimension. You may learn less easily in an environment that fails to address that preference at least some of the time than you would in a more balanced environment. If [the absolute value of] your score for a dimension is 9 or 11, you have a strong preference for one category of that dimension. You may have difficulty learning in an environment that fails to address that preference at least some of the time.”
Chapter 3: Software tool
3.1 DescriptionFor the cause of continued research on the FWT technique and its parameters, we developed a custom-made tool. It was built from scratch and is not based on the code of the original RFV tool (Blackwell et al., 2000) or later manipulations of their tool (Tarasewich et al., 2005),(Bednarik & Tukiainen, 2004),(Romero, Cox, et al., 2002). The main reason to start over was that the structure of the tool needed to be substantially different for the purpose of this research. Additionally, the original code was not available, which required starting from scratch anyway.
Most of the general principles behind this tool do however originate from (Blackwell et al., 2000). Nonetheless, the graded blurring was deliberately left out because this complicates the interpretation of the collected data. By using multiple blurring bands, it becomes ambiguous which band discloses which information. In order to overcome the unnatural transition problem for which this feature was originally introduced, this tool uses a shadow effect to indicate the transition between the blurred stimulus and the focus window. Without this effect, it would be impossible to distinguish the focus window from the blurred stimulus on uniformly coloured surfaces. In addition, the motion blur was also left out because we feel that this might impact the natural strategy used by the participants. The researcher can always decide to exclude the fast scanning behaviour for analysis if he considers those to be irrelevant. By calculating the focus window velocity using the output data, speeds above a certain threshold can be removed. Furthermore, a pictogram parameter was added to the tool to convey navigation information while hiding diagnostic information. This was never done in any previous RFV tools and allows to evaluate whether or not this would be a useful addition to the current technique. In this dissertation, the tool serves as a research tool that allows assessing the different possibilities of parameter settings.
The software tool consists of two main functionalities which can be used independently from each other as well as combined. The first core functionality allows to tailor the individual parameters that impact the FWT. The second core functionality simulates an actual FWT experiment, using the parameter settings that were defined in the first core functionality.
With the eye on different research settings, two versions of this tool were built.
One version runs locally on a computer and can be used for on-premises experimentation. This type of research is, for example, required when the tool is combined with an eye tracking experiment and all environmental conditions need to be constant across all participants.
The second version runs on a server and is accessed through a website. This off-premises software can easily be accessed by participants and allows fast diffusion among the target group. This version of the tool also has proven to be extremely useful to overcome the social distancing restrictions imposed during the Covid-19 crisis. On the downside of this version, the availability of a server is always required, and the participants rely on an internet connection to participate in an experiment.
For the implementation of this tool, a combination of HTML, JavaScript, CSS and PHP was used. With these programming languages, both the offline and the web-based version could be based upon the same substructure. This would be less straightforward through the use of Java, in which the original RFV tool was implemented. The code will be made available upon demand to encourage future research.
In what follows, no distinction will be made between the on-premises and the off-premises tool. Therefore, their differences are summed up here. The main point of difference is the location where the application is executed. For the on-premises tool this is the computer on which the tool is used, whereas for the off-premises version this is the server on which the tool is placed. For this research a server of Ghent University was used, and the tool was made accessible through a personal student website.
The most visible impact of the different ways in which the software is executed is the storage of the log files. These log files are the result of experiments with different participants, but they will be explained in more detail later. In the on-premises version output files are stored locally, as opposed to being stored on the server for the off-premises software. Storage on the server makes centralization of the files more convenient. In addition, changes to the tool itself can be made centrally in the off-premises version. In that way, there is no risk of respondents working with an outdated version. The on-premises version is however less complex and does not require a
server. Hence it is perfectly suitable when all of the experiments are executed sequentially on the same computer.
3.2 Structure of the tool
The tool consists of two main functionalities, as was mentioned before. Other parts were added to the tool to enhance understanding and usability, but they do not contribute to the core of the application.
3.2.1 Introduction window
The first example of such an addition to the tool is the introduction window. When the tool is opened, the first window that is shown serves as an introduction to the tool. A screenshot17 of
this introduction can be found in Appendix 3.1. A message is displayed to clarify the purpose of the experiment, explaining how the tool works and which parameters are to be tailored. Depending on the experiment and the target audience, this message is adapted. On this introduction screen, a start button is present, which takes the user to the next window when clicked.
3.2.2 First core functionality: parameter settings
The second window embodies the first core functionality and is shown in Appendix 3.2. In this window, parameters can be set to a desired value, while taking into account the judgment task to perform using these settings. The high-level judgment task, together with some guidelines, are explained in the small explanatory paragraph in this window. The impact of the specific settings can directly be observed visually by the user in a preview section at the top of the window. A short instruction section is followed by the actual parameter setting section. The user has to select a value for the following four parameters:
1) the degree to which the stimulus is blurred, 2) the shape of the focus window,
3) the size of the focus window and 4) the kind of overview pictogram.
For the first parameter, namely, the degree to which the image is blurred, the user can choose between three alternatives. The image can either have a light blur, a medium blur or a heavy blur. How heavy these different levels actually blur the image and which blurring method is used has to be determined by the researcher in advance, as he will have to upload the three images with a different blurring degree into the tool. Once a level is selected, a blurred image will appear at the top of the window.
The second parameter that has to be decided upon is the shape of the focus window. Two possibilities are provided, being either a round or a squared shape. The impact of this choice is observed when the user moves its computer mouse over the blurred image at the top of the window. By doing so, a focus window with the selected shape will hover over the blurred stimulus along with the mouse.
As a third parameter, the size of the focus window is considered. This parameter is specified using a slider that changes the size metric. In order to provide some kind of reference on the selected size to the user, the percentage of the total picture area that covered by the focus window is displayed at the bottom of the size selection section.
As the last parameter that has to be decided on, the overview pictogram is considered. The user can either choose to display no pictogram, a small pictogram or a large pictogram. A pictogram is the same image as the non-blurred original one, but with dimensions that are only a fraction of the original dimensions. Which scaling factors are used to transform the original image into a pictogram is a design choice that has to be made by the researcher in advance. This choice, of course, depends on the specific stimulus and the type of information it contains, as the pictogram ideally should reveal only navigation information while hiding diagnostic information.
After experimenting with the different levels of the parameters, the user then decides upon his final preferred combination of settings. This final combination can then be saved, using the “save settings” button at the bottom of the window. Depending on the version of the tool, these final settings are then saved locally or on the server as a text file for later consultation. Additionally, a log file of the experimentation in the preview section is also compiled. After the “save settings” button is clicked to save the final setting, a second button appears on the bottom of the window.
This “start experiment” button takes the user to a new window, which embodies the second core functionality: the actual FWT experiment.
3.2.3 Second core functionality: FWT experiment
In the third window, the actual FWT experiment can be carried out. The two main functionalities of this tool come together in this window, as all the parameter settings that were selected in the previous window are incorporated in the experiment. The user can now carefully examine the stimulus using the focus window with the specific settings he selected. At the top of the window, the guidelines for the experiment are repeated once again. A screenshot of this window is included in Appendix 3.3. Periodical data about how the stimulus is examined is collected during this process. When the user feels ready to answer questions after observing the stimulus, he pushes the “end” button, which takes him to an online Qualtrics survey.
By clicking this button, a log file that captures the observation of the stimulus is saved. Only the log file prior to the participants receiving the specific judgement questions is saved18. This was a
design choice for this research but could however be adjusted for different research purposes.
If desired, the two core functionalities could be used independently from each other with only minor adjustments. This was however not the case in this research.
3.2.4 Additional features
Depending on the goal and the setup of the experiment, other pages can be appended and opened after clicking the end button. For example: for the research of fellow students (van Assche & Abbeel, 2020) who wanted to use this tool for their research, a window with a timer was added on their request. The window opened when clicking the “end” button in the third window. The purpose of this timer was to display and keep track of the time respondents needed to fill in some questions about the observed image. When the timer was stopped, its position was stored in a local text file. This timer window is shown in Appendix 3.4. This is not considered as a part of the core of this tool, but it however illustrates the adaptability of this tool.
18 The scan path recorded in this log file is independent of the individual judgement questions. This way, the path captures how the stimulus is viewed in accordance with the general judgment task clarified in the introduction, of the first core functionality.
3.2.5 Output
Two text files are generated to store information that is produced during the use of the tool’s core functionalities. Both files have a similar structure, which is described in table 4. They are in CSV format.
The first file contains information about the final settings from the first core functionality. The details on the parameter settings chosen by a participant are represented in the fourth to the eighth column of Table 4. The third column represents the time it took to select the settings. A screenshot of this file opened in a text editor can be found in Appendix 3.5
The second file contains the information on the actual FWT experiment from the second core functionality. For this experiment, the most critical information are the x and y coordinates of the mouse, relative to the image, together with a timestamp indicating when these coordinates were sampled. This data can be used to generate the path that was followed to analyse the image. The sampling interval of this timestamp was 55 ms. Additionally, another important piece of information is captured in the onStimulus variable as “whether or not the focus window is located on the image”. This information is also vital for studying how the user analysed the stimulus during the FWT experiment. For each timestamp, a new line is added to the log file. The structure of this log is shown in Table 4.
The information discussed above, combined with the parameter setting from the first core functionality, is jointly stored in a CSC-file when the end button is clicked. The overlap with the parameter setting file allows this file to be interpreted independently from the first file. A screenshot of the file opened in a text editor can be found in Appendix 3.6. A similar file is compiled to capture the data generated in the preview section of the parameter setting window, but as this file was not needed in the research design of this dissertation, it was not stored. This could be changed with only very minor adaptation of the code.
X-coordinate Y-coordinate Timestamp Degree of blur Diameter of focus window
Side of focus
window Shape Pictogram onStimulus
(int) (int) milliseconds
(int) image name (string) when round (int) when squared (int) {Style=round, Style squared =squared} (string) {no pictogram, small pictogram, big pictogram} (string)
whether the focus window was on the stimulus at the moment of the timestamp (Boolean)
3.3 Use cases
Depending on the approach in which the tool is used, the word “user” in the section above has a different meaning. In what follows, two distinct use cases are discussed which define the user in a different way. These two use cases are not exhaustive. Other hybrid approaches can also be constructed, while not necessarily using all parts of this tool.
On the one hand, the tool can be used by researchers to visually determine settings for all the parameters of the FWT experiment before conducting the actual experiment. In that way, the first core functionality of the tool offers a convenient one-stop solution that lets the researcher set all the parameters in one window, allowing him to observe the impact of his choices immediately. A file of their final parameter settings is automatically generated and stored for further consultation. The second core functionality of the tool is then used to carry out the FWT experiment with researcher-defined parameter settings on the participant. The user of the tool is in this case the researcher for the first core functionality, and the participant in the second core functionality. This particular methodology was used by (van Assche & Abbeel, 2020)19.
On the other hand, the tool can be used in a research setting where respondents set all the parameters themselves according to their preferences for the purpose of solving a task. After this phase, they can execute an FWT experiment with these parameter settings. This methodology was used to assess the aforementioned research questions of this dissertation.
3.4 Pilot test
In order to verify and improve the tool’s usability in research, a small pilot test was organized with the two fellow students that would use this tool for their research on the comparability between the FWT and eye tracking (van Assche & Abbeel, 2020). They provided feedback on a preliminary version of the offline tool. In general, this version was found to be in line with their needs and requirements. They, however, suggested a few graphical changes to increase understandability and requested a timer window (cf. supra) to track the duration of a paper questionnaire. Most of the suggested changes were implemented, and the timer was added. Later, the link to a questionnaire was added.