www
The worldwide
context of China’s
Green Transition
to 2050
Policy Study
The worldwide context of
China’s Green Transition to 2050
The worldwide context of China’s
Green Transition to 2050
In collaboration with Utrecht University
This report was compiled in support of the China Council for International Collaboration on Environment and Development (CCICED). It does not necessarily reflect the views of the CCICED.
This publication can be downloaded from: www.pbl.nl/en. Parts of this publication may be reproduced, providing the source is stated, in the form: Bakkes, J. et al. (2017), The worldwide context of China’s Green Transition to 2050. PBL Netherlands Environmental Assessment Agency, The Hague.
PBL Netherlands Environmental Assessment Agency is the national institute for strategic policy analysis in the fields of the
environment, nature and spatial planning. We contribute to improving the quality of political and administrative decision-making by conducting outlook studies, analyses and evaluations in which an integrated approach is considered paramount. Policy relevance is the prime concern in all of our studies. We conduct solicited and unsolicited research that is both independent and scientifically sound.
The worldwide context of China’s Green Transition to 2050
© PBL Netherlands Environmental Assessment Agency The Hague, 2017
PBL publication number: 2982 Revised second print
Corresponding author
jan.bakkes@pbl.nl
Authors
Jan Bakkes (PBL), Harmen Sytze de Boer, Oreane Y. Edelenboscha
and Detlef P. van Vuuren (Utrecht University and PBL)
Contributor: Stefan van der Esch (PBL) a
Current affiliation: Politecnico di Milano; oreane.edelenbosch@polimi.it
Supervisors
Jacqueline Timmerhuis and Pieter Boot
Acknowledgements
The analytical work for this report was supported by the Ministry of Infrastructure and the Environment. The International Support Office of the China Council
for International Collaboration on Environment and Development (CCICED) facilitated our interaction with the other members of the Task Force on China’s Green Transition Outlook to 2050. Our colleagues of the Development Research Centre of the State Council of China made their projections and comments available at an early stage. PIB (Partners in Business) of Clean Coal China kindly shared their insights (contact: zhang@ecn.nl). All these forms of support and input are gratefully acknowledged.
Comments and suggestions on drafts of this report were received from Pieter Boot, Michel den Elzen and Jonathan Doelman, all of PBL, and from Knut Alfsen, International Chief Advisor’s Group to CCICED, and are greatly appreciated.
Graphics
PBL Beeldredactie
Layout
Xerox/OBT, The Hague
Production coordination
PBL Publishers
Chinese translations: Peishen WANG
PIB Clean Coal contact information: Dr. Y. Zhang, Consultant Technology Transfer, Business Developer, Energy
research Centre of the Netherlands (ECN); PO Box 1, NL - 1755 ZG Petten, The Netherlands; Adjunct Professor, Shanghai Jiao Tong University; T: +31 (0) 224564045; F: +31 (0) 224568214; M (NL): +31 (0)610147741; M (CN): +86 15021957567; E-mail : zhang@ecn.nl 张烨 博士; 科学研究员,商务拓展专员; 荷兰能源研究中心 , ECN; 太阳能; PO Box 1, 1755 ZG Petten, The Netherlands; 电话:+31 (0) 224 - 56 40 45; 传真:+31 (0) 224 - 56 82 14; 手机 (NL): +31 (0)6 10147741 手机 (CN): +86 15021957567 E-mail : zhang@ecn.nl
Contents
MAIN FINDINGS
Summary and reflections 8
I Introduction 8
II Summary of results of the model-based analysis 9
III Reflections 11 中文稿摘要小结 13 FULL RESULTS 1 Introduction 16 2 Methodology 18 2.1 Scenario description 18
2.2 The global Shared Socio-economic Pathways SSP1, 2 and 3 20 2.3 Model description 21
3 Comparison of international projections and China’s Green Transition Pathway 24
3.1 Key drivers 24
3.2 Energy 27
3.3 Carbon dioxide emissions 28
4 China’s development trajectory in a global context 30
4.1 Energy 30 4.2 Climate change 36 4.3 Air pollution 39 4.4 Land use 40
5 Robustness and uncertainty of the model-based analyses 46 6 Conclusion of the model-based analyses 48
六、模型分析结果 50
References 52
Supplementary material 54
Appendix 1: China’s green transition 54
Appendix 2: Details on the Green China plus scenario 54
7
|
8 | The worldwide context of China’s Green Transition to 2050
I Introduction
This report supports China’s Green Transition Outlook to 2050 [CCICED – in prep] and aims to kick-start an assessment of the worldwide context of China’s green transition. The current section of our report summarises our findings and reflects on them in the light of additional material.
The assessment was developed in parallel to the main work on the subject, which is being carried out by a task force of the China Council for International Collaboration on Environment and Development (CCICED). The central claim of the task force is that a new economic
development model is emerging in China, requiring significant policy changes. The CCICED report views these emerging developments through an economic ‘lens’, mindful of connections in terms of environment,
resources and China’s social development. It considers six complex areas of change: manufacturing, agriculture, services, urbanisation, rural development, and resources and the environment, and focuses on the question what should be achieved by the pivot year of 2030 and how. The CCICED Task Force addresses five policy agenda items, namely establishing the new norm, promotion policies for green industries, incentive mechanisms and regional pilot projects, building the digital green
economy, and building an inclusive society and resilient economy, including groups and areas that are impacted by the green transition.
Focus
Our assessment of the worldwide context addresses five general questions posed by the CCICED Task Force (see Box 1). For our model-based analysis of issues relating to energy, climate and air pollution, these are operationalized as follows:
− How do the domestic projections developed by the Chinese partners in the CCICED Task Force compare
to recent projections by international teams?
− Assuming a green transition of China’s economy between now and 2050, what would be its contribution
to achieving global climate policy targets?
− On climate change mitigation, would the result of the transition as envisaged be sufficient?
In addition, with regard to land resource issues, the results from a comparable scenario study for the Global Land Outlook were selected in as far as they relate to the questions posed by the CCICED Task Force. Taking a global perspective also enabled us to highlight what seemed to be a number of key conditions that Chinese policy would have to meet in order for its envisaged transition to be successful.
Summary and reflections
Box 1: Questions posed by the CCICED Task Force on China’s Green Transition to 2050 in relation
to its worldwide context
Q1. How necessary, from an environmental resources point of view, is a green transition of China’s economy? Q2. Assuming a green transition of China’s economy between now and 2050, what would be its contribution
to achieving global targets of sustainable development?
Q3. Would the transition as envisaged be sufficient to remain within planetary boundaries? Q4. What type of worldwide or regional potential constraints and synergies can be identified?
Consider, for example, dynamics elsewhere in Asia or China’s increasing presence worldwide. Q5. What are important issues for follow-up work?
9
Summary and reflections |
Finally, we listed important topics that warrant more
in-depth analysis.
Method
This report draws on:
− the interim report of the CCICED Task Force on China’s Green Transition Outlook (CCICED, 2016);
− model-based scenario analysis, carried out specifically for this project at Utrecht University on the basis of the Shared Socio-economic Pathways (SSPs);
− additional relevant PBL work containing worldwide analyses, in particular the scenario analysis for the first Global Land Outlook (United Nations Convention to Combat Desertification, 2017; Van der Esch et al., 2017). The current report is no more than a kick-start for the assessment of the worldwide context of China’s green transition, and reflects the limited time and budget. For example, water issues have not been addressed at all and no second opinion from Chinese knowledge organisations was obtained.
Robustness and limitations of our model-based findings
We did not explicitly test the robustness of our conclusions. However, we are confident that they appropriately provide a first impression of the worldwide context of China’s green transition as depicted by the CCICED Task Force. Limitations apply, of course; most importantly:
− This report is only the result of a preliminary (kick-start) project, not a full assessment. For example, fresh water availability was not considered and no peer review by Chinese knowledge organisations was carried out.
− Our assessment focuses on China’s role in a worldwide context. It therefore models the China region as a whole, disregarding its internal heterogeneity in terms of environment, pressure factors and opportunities.
II Summary of results of the
model-based analysis
Our main analytical results are as follows. Their numbering (Q1, Q2, etc.) refers to the questions posed by the CCICED Task Force (see Box 1).
In response to Q1 and Q4: China’s Green Transition Pathway reduces the increase in emissions of important air pollutants towards 2030 and decreases them further towards 2050. Sulphur dioxide (SO2), nitrogen oxides (NOx) and black carbon (BC) are major contributors to urban air pollution. Under baseline conditions, reductions in emissions of sulphur dioxide and black carbon are expected towards 2050.
The introduction of China’s Green Transition Pathway can further reduce these emissions by 45% (SO2), 39% (NOx) Figure 1 1990 2010 2030 2050 0 10 20 30 40 50 Mt SO2 Source: PBL pb l.n l History Baseline
Green China plus Two-degree Climate Policy Sulphur dioxide
Air polluting emissions in China region
1990 2010 2030 2050 0 10 20 30 40 Mt NOx pb l.n l Nitrogen oxides 1990 2010 2030 2050 0.0 0.5 1.0 1.5 2.0 Mt BC pb l.n l Black carbon
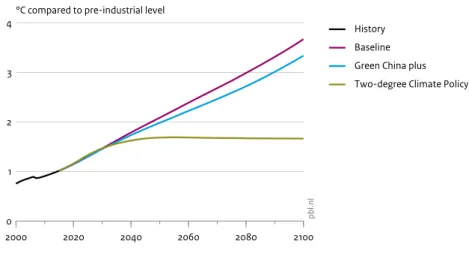
10 | The worldwide context of China’s Green Transition to 2050 Figure 2 2000 2020 2040 2060 2080 2100 0 1 2 3 4
°C compared to pre-industrial level
Source: PBL pb l.n l History Baseline Green China plus Two-degree Climate Policy Change in global mean temperature
Figure 3 1990 2000 2010 2020 2030 2040 2050 0 4 8 12 16 Gt CO2 per year Source: PBL pb l.n l History Baseline Green China plus Two-degree Climate Policy Carbon dioxide emissions in China region
and 17% (BC) compared to baseline projections by 2050 (see Figure 1). Figures 1, 2 and 3 show results of worldwide scenarios. Of these, Green China plus comprises China’s Green Transition Pathway. A full description of how China’s green transition has been incorporated is provided in Section 2.1, with further details in Appendix 2. Further reductions are achieved if additional climate policy is introduced to achieve a 2 °C climate target. More precisely, these ancillary results of additional climate policy would improve emission reductions to 81% (SO2), 68% (NOx) and 55% (BC), compared to baseline projections by 2050.
In response to Q2: A green transition would help achieve environmental goals in China and globally, assuming
that current and planned policies elsewhere will be implemented, as well. This can be illustrated by comparing baseline and policy projections from our scenario analysis regarding climate change (see Figure 2). Elements of China’s green transition that influence demand for land may not bring huge changes by 2050. They are nevertheless significant because there is not much more suitable land available in China. Such elements of the green transition include agricultural productivity, the proportion of meat in the human diet, bioenergy production and, locally, urbanisation.
11
Summary and reflections |
In response to Q3: International current and planned global policies and China’s Green Transition Pathway are insufficient to achieve a 2 0
C climate target.
The implementation of China’s Green Transition Pathway reduces China’s share in global emissions of carbon dioxide and in energy use. It features less emissions of carbon dioxide than currently foreseen in most international baseline scenarios. However, it is not sufficient to get on the emission pathway of a cost-optimal implementation that keeps the global average temperature increase well below 2 0
C relative to pre-industrial levels, as agreed in the Paris Agreement. Therefore, additional mitigation efforts will be required to further reduce greenhouse gas emissions and to achieve a 2 °C warming target. Roughly speaking, compared to current and planned global policies and China’s Green Transition Pathway, a doubling of carbon dioxide mitigation is required until 2050 in order to achieve a 2 °C warming target (see Figure 3).
III Reflections
In response to Q4: Opportunities for China’s green transition to contribute in a significant way to the
worldwide management of land resources appear in the findings of the scenario exercise. Projected land-use changes in sub-Saharan Africa towards 2050 dwarf those in other world regions (see Figure 4). China’s large investments in the region represent leverage in helping African agriculture and agricultural land management to cope with their challenges – assuming China and Chinese
investors do indeed have good land management practices to export over the coming decades.
In terms of constraints and synergies of China’s green transition to 2050, three issues are obvious from our global vantage point.
− First, the current dynamic period in China’s development provides a finite opportunity for transition. In particular, infrastructure investments are likely to remain, in the long term. This applies, for example, to the power distribution grid, urban planning and education systems. The amount of time required to get these systems in order and up to scale is significant. − Second, a remarkable risk in the region appears when the scenario outcomes for the Global Land Outlook are viewed together (UNCCD, 2017; Van der Esch, 2017, pp. 86–87). While China is assessed as a region with relatively few land-related challenges up to 2050, neighbouring South Asia ranks as facing the most difficult challenges (South Asia comprises India, Pakistan and Bangladesh).
− Third, global and regional collaboration remain as
important as ever, especially with China in a new, more
active role. For example, as an element of green transition, China’s economy will abandon its role as the world’s cheap mass production house. All other things being equal, other Asian economies will take over that role. Regional collaboration can help prevent, or mitigate, a potential continuation of the associated burden to the global environment. Or, considering climate change, it is obvious that only worldwide implementation of 2 0
C climate policies would be sufficient to keep global climate change well below 2 0
C. Figure 4
North America Central and South America Middle East and Northern Africa Sub-Saharan Africa Western and Central Europe Russia and Central Asia South Asia China region Southeast Asia Japan and Oceania
-6 -4 -2 0 2 4 6 million km2 Source: PBL pb l.n l Built-up area Food and feed crops Energy crops Pasture Forest
Other natural land
Range between SSP1 and SSP3 Land-use change per region, under SSP2, 2010 – 2050
12 | The worldwide context of China’s Green Transition to 2050
Some key conditions are apparent for China’s green transition to succeed. Our assessment of the worldwide context enables us to appreciate, by comparing it with internationally coordinated scenarios, the necessary scale and speed of the changes foreseen during China’s green transition. The quantification of internationally coordinated scenarios is based on observed rates of change and interrelations in economies worldwide. Key conditions include the following:
− Successful policies to steer the supply side of China’s
production away from its previous path and towards
a development that is more like that of South Korea and Japan.
− Successful and innovative policies to steer the development of the increasingly important service
sector in China, including its new business models,
towards a development that is truly green in terms of energy use, waste and transport.
− Successful and timely policies guiding how urban
development and mobility in the next decades will be
organised, in particular in spatial terms.
− Fully instrumenting policies aimed at capping and eventually phasing out fossil fuel use well before 2050. − A firm strategy and budget to avoid the interim tool of
‘clean coal’ locking China into a path of continued coal
use at a time when this will be incompatible with agreed international goals. Any application of coal and derived fuels should be accompanied by carbon capture and storage (CCS).
Over and above such technical conditions, social policies
are obviously crucial for the transition to succeed.
See, for example, the Study on China’s Environmental
Protection and Social Development. Executive Report of CCICED Task Force, November 2013 (CCICED, 2013). Such policies will be needed to ease the pain of transition for China’s manufacturing industry, as will targeted policies for education. This is beyond the scope of the current report. A somewhat fuller discussion can be found in the executive report of the current task force, to be published in December 2017 (CCICED, in prep).
Further work
In response to Q5: Our work, kick-starting an assessment of the worldwide context of China’s green transition, leads to a number of suggestions for important further work, as follows.
With a domestic focus on China’s transition
A fuller version of the current scenario analysis, addressing a wider set of environment and resource issues. We recommend the following:
− Address, in particular, the implications of the transition and its envisaged new business models in terms of fresh water availability and use, air pollution exposure, landscape, agricultural nutrients and pesticides, and waste. Of course, this would be in addition to energy/ climate issues and land-use changes.
− Be region-specific, possibly with a view to the regional pilot projects proposed in the task force report. Conditions for China’s green transition as identified now can then be interpreted in more concrete terms. − Involve Chinese expertise and/or review by Chinese
knowledge organisations, in addition to any work by international organisations.
This would lay the basis for specific assessment tools to be subsequently deployed in order to help guide the transition. For example, this could include proper backcasting; that is, reasoning back from the 2050 vision and identifying the must-have accomplishments for 2030. Or, in the style of strategic environmental assessments, such assessment tools could include a framework of region-specific targets, enabling periodic monitoring and revision.
From an international perspective on China’s transition
This could possibly be carried out in tandem with domestically focused follow-up work: short papers scrutinising each of the comments made here on regional risks and opportunities, such as:
− the prospect of multiple land/agriculture/water-related risks in the South Asia region, foreboding increasing pressure on environmental and socio-political systems outside, but neighbouring on, China (UNCCD, 2017; Van der Esch, 2017, pp. 86–87);
− Chinese opportunities to scale up green practices in sub-Saharan Africa during its fast changes in the coming decades.
13
Summary and reflections |
中文稿摘要小结
限于时间和预算,目前的报告仅仅是中国绿色转型国际背景的初步探讨。例如,本报告没有论及水的问题,也未及 征询其它中方智库机构的意见。 针对情景分析,我们比较了一个中间的基线情景和两个政策情景。其中一个政策情景包括了世界范围内现行和计 划中的政策以及国合会课题组描述的中国绿色转型路径。我们称之为“绿色中国Plus”。另一个政策情景假定了实现 2oC气候目标所采取的经济有效的行动,我们称之为“2oC气候政策”。 我们的分析结论如下: 中国绿色转型路径会在2030年前降低重要空气污染物排放的增长,之后到2050年间进一步减少排放总量。引入 实现2oC目标的额外气候政策将实现进一步的减排。与基线情景相比,至2050年这些额外的气候政策将带来连带的污 染减排效益,即二氧化硫减少81%,氮氧化物减少68%,黑炭减少55%。 绿色转型将有助于实现中国乃至全球的环境目标。但是,中国的绿色转型,加之国际上当前的和计划中的全球政 策还不足以实现2oC气候温控目标。在基准情景以及“中国绿色Plus”情景中,气候温度水平一直在升高,即使是2050年 之后亦是如此。因此,还需要采取额外的努力才能保证2oC目标的实现。粗略估计,与目前的中国绿色转型以及国际上当 前的和计划中的全球政策相比,到2050年我们还需要两倍的努力才能实现2oC温控目标。 与此相对照,“2oC气候政策”将使全球气温与工业化之前相比上升接近2oC或者更少。在这种情况下,二氧化碳 的排放轨迹与到2100年实现2oC目标的相比,概率达到66%。 在全球土地供应和土地退化问题上,中国2050绿色转型将面临一个日益充满挑战的世界。相对于周围的世界,到 2050年中国预计的土地利用总体变化不会太大。但是,中国绿色转型中那些影响土地需求的要素十分重要,因为中国没 有过多的土地适于耕作。这些要素包括农业生产力、肉类在饮食结构中的比例、生物能源生产,以及地方层面的城镇 化。 此外,针对国合会中国2050绿色转型课题组提出的问题,我们提出一下一些思路: 就中国2050年绿色转型的制约因素和协同作用而言,从全球的高度来看,四个问题是显而易见的。 • 目前中国发展的动态时期为转型提供了有限的时机。重要的是,大规模转变重要的系统需要很长时间,而这些系统通 常会存续数十年,即使在瞬息万变的中国。 例如配电网,城市布局和教育系统。 • 当“全球土地展望”的情景成果被一并看待时,结果显示出了一个显著的地区风险。虽然到2050年中国面对的与土地 相关的风险相对较小,但是邻近的南亚地区却面临着重重困难。 • 全球和区域合作仍然是一如既往的重要,尤其是中国在全球日益活跃的角色。例如,作为绿色转型的一个重要部分, 中国将摆脱世界大宗廉价产品工厂的角色。在所有其它条件相同的情况下,亚洲其它国家将承接这一角色。区域合作 将有助于预防或减缓这种承接所带来的延续的全球环境负担。 • 情景分析显示中国绿色转型将会对世界范围内土地资源管理做出巨大贡献。中国在撒哈拉以南非洲地区的大量投资 将有助于非洲农业和农用土地管理应对挑战——假设中国和中国投资者在未来几十年内确实能够输出良好的土地 管理实践。 在我们的分析过程中,中国绿色转型取得成功的关键条件是显而易见的。这些条件可以概括如下: • 成功的供给侧改革政策使发展摆脱过去的路径,走上一条更类似韩国和日本的道路; • 成功的创新政策推动中国日益重要的服务业(包括新型生业模式)在能源使用、废物管理和运输方面走上一条真正 绿色的发展道路。 • 指导未来几十年城市发展和人口流动的成功和及时的政策,特别是在空间布局方面。 • 全面实施旨在限制并在2050年以前逐步淘汰化石燃料的政策。 • 一个明确的战略和相应的预算,以避免“清洁煤炭”这个临时工具将中国锁定在继续使用煤炭的道路上。任何煤炭以 及其衍生燃料的应用都应该附带上CCS。 • 除了上述技术条件之外,社会政策无疑是转型成功的关键。中国需要这样的政策来缓解制造业转型的痛苦,同时也需 要有针对性的教育政策。这一点不在本报告的讨论之列。 最后,我们的报告建议针对目前的情景开展全面详尽的分析。建议: • 分析绿色转型在水资源获取和利用、空气污染暴露、农业营养物和农药、废物管理等方面的影响,尤其是服务业转型 及可预见的新型商业模式的影响。当然,能源、气候问题以及土地利用方面的影响分析也是必须的。 • 针对具体地区,可能的话在课题组报告中建议开展地方示范。这样可以针对目前识别的中国绿色转型条件进行具体阐 释。 • 除了国际机构的参与,也吸纳中国的专家和智库组织参与研究或评审。15
Summary and reflections |
FULL RESUL
TS
FULL RESUL
16
ONE
| The worldwide context of China’s Green Transition to 2050
Introduction
one
The Chinese government has realised that a new, more sustainable development pathway is needed. The recently released 13th five-year Energy Sector Plan (National Energy Administration, 2017) and five-year Environmental Protection Plan (State Council Information Office, 2017) contain ambitious energy and climate targets. From an economic point of view, China has entered a new stage, which is referred to by President Xi Jinping as the new normal (Green and Stern, 2015). With strategic urban and industrial policy plans and an increasing importance attached to the service sector, innovation and high tech development, this projected pathway associates with a more sustainable development to drive the country’s economy (IEA, 2016a). Along that same line, China has gradually taken up more
responsibility in international climate policy (ERI, 2016; IEA, 2016a).
Within the framework of the China Council for International Collaboration on Environment and Development, Chinese and international experts are looking at the possible impacts of a reorientation of development. This report contributes to this work by
exploring the possible impacts of China’s projected new trajectory in a global context. The reason for this is that environmental issues such as climate change are not bounded by national borders and are clearly global problems. An important question, therefore, is what a more sustainable development pathway for China implies for the world. And, vice versa, what do possible
developments in the broader global system related to available resources such as energy and land imply for China?
In our model-based analysis of energy and climate, the following specific questions are addressed:
− How do the projections of China’s Green Transition Pathway compare to the China development projections conventionally assumed in international model-based studies?
− How does China’s Green Transition Pathway contribute to environmental issues, such as air pollution and climate change?
− To what extent does China’s Green Transition Pathway enable China to achieve its climate targets?
China is at an important crossroads. Over the past decades, China has been on an economically successful development trajectory spurred mostly by the growth of export-oriented, energy-intensive manufacturing industries. The limits of continuing such a strategy have now become visible. First of all, China’s economy is very resource-intensive. China is currently the world’s largest consumer of several resources, including energy (22% of the global primary energy supply in 2015; IEA, 2017), and many of these resources need to be imported. Second, the development pathway has led to serious environmental degradation, such as urban air pollution. Moreover, China is now the largest emitter worldwide of the greenhouse gas carbon dioxide, and therefore an important contributor to human-induced global warming (Olivier, Janssens-Maenhout, Muntean, and Peters, 2016). In turn, global warming can also be a serious threat to the further development of China, increasing drought and flood risks and threatening agricultural yields. Given this situation, questions have been raised regarding the viability of the historical development pathway and a major reorientation is expected in future years.
17
1 Introduction |
ONE ONE
The methodology is elaborated on in Chapter 2. Most importantly, this chapter introduces the scenarios that this report refers to. The results of our analysis are the subject of Chapters 3 and 4. First, in Chapter 3, China’s Green Transition Pathway is compared to the baseline results of global model-based scenario exercises. This puts the ambitions of China’s Green Transition Pathway in perspective, as well as highlighting key uncertainties. Then, in Chapter 4, China’s Green Transition Pathway is analysed using the global integrated
assessment framework IMAGE, focusing on its global implications. Chapter 5 addresses the uncertainty and robustness of our model-based analyses and Chapter 6 concludes with a discussion.
18
TWO
| The worldwide context of China’s Green Transition to 2050
Methodology
two
In this report, we use the integrated assessment model IMAGE (Integrated Model to Assess the Global Environment; Stehfest et al., 2014) to explore
development patterns in China in relation to the rest of the world. The horizon year of the analysis is 2050. We compare the IMAGE results with projections
developed by the Development Research Centre (DRC) of the State Council to ensure compliance with China’s Green Transition Pathway (Chapter 4). We also compare China’s Green Transition Pathway with the results of global scenarios (Chapter 3).
2.1 Scenario description
Several scenarios are presented in this study. They are used to answer the questions raised in Chapter 1. In all cases, a comparison is made with the scenario developed by DCR, referred to as China’s Green Transition Pathway (CGTP). Table 2.1 presents an overview of the scenarios used in this study.
Comparison of international projections and China’s Green Transition Pathway (Chapter 3)
In order to obtain a better understanding of China’s Green Transition Pathway, it is compared with a broad range of international projections on key drivers, energy system indicators and emissions. As well as China’s Green Transition Pathway, for which the Chinese domestic developments have been quantified by DRC
(see Appendix 1 for more information), the three Shared Socio-economic Pathway (SSP) scenarios quantified by the IMAGE model are included, along with IEA’s World Energy Outlook (WEO) scenarios.
SSP1, SSP2 and SSP3 are three of the Shared Socio-economic Pathways (SSPs) developed for multiple IAMs to improve the interdisciplinary analysis and assessment of climate change, its impacts, and the options societies have for mitigation and adaptation (O’Neill et al., 2017; van Vuuren et al., 2017). SSP2 is a middle-of-the-road scenario, while SSP1 is a pathway leading towards more global sustainable development. In contrast, SSP3 projects a fragmented world. Excerpts of the narratives of SSP 1, 2 and 3 can be found in the next section.
Because of the central role of energy projections in this study, the most recent baseline projection of the International Energy Agency (IEA) has also been included in this comparison. IEA’s Current Policies scenario assumes no changes in policies, whereas the IEA New Policies scenario takes into account broad policy commitments and planned policies (IEA, 2016b).
China’s development trajectory in a global context (Chapter 4)
Three global IMAGE scenarios have been analysed. Comparing the different scenarios enables us to evaluate the impact of China’s green transition.
Computational models, including macro-economic models and integrated assessment models (IAM), are tools that are widely used to develop long-term scenarios for the analysis of global environmental issues and sustainability challenges. Such models can provide insight into the interactions between human activity and natural systems over the coming decades. While originally these models focused mostly on climate change, more recently other environmental impacts such as air and water quality, water scarcity, the depletion of non-renewable resources and the overexploitation of renewable resources have also been addressed.
19
2 Methodology |
TWO TWO
Table 2.1
Overview of scenarios included in this study
Chapter Scenario Origin Description
Comparison of international projections and China’s Green Transition Pathway (Chapter 3)
SSP1 baseline IMAGE Pathways oriented towards a more
sustainable development
SSP2 baseline IMAGE Middle-of-the-road scenario
SSP3 baseline IMAGE Fragmented world scenario
WEO Current
Policies IEA World Energy Outlook 2016 Reference projections with no new policies WEO New Policies IEA World Energy
Outlook 2016
Reference projections with planned policies
CGTP DRC China’s Green Transition Pathway
China’s development trajectory in a global context (Chapter 4)
SSP2 baseline International research community + IMAGE
Middle-of-the-road scenario
Green China plus IMAGE, this report China region: China’s Green Transition Pathway representation, expected economic development and demographic development as projected by the DRC
+
Worldwide: current and planned policies on climate change mitigation
Two-degree Climate Policy
IMAGE, this report Green China plus scenario assumptions and worldwide low-cost policies from 2020 onwards to ensure that the global mean temperature increase remains less than 2 0
C relative to pre-industrial temperatures
The middle-of-the-road baseline scenario SSP2 forms the basis for all these scenarios. This baseline scenario features no new environment or resource policies but does account for autonomous developments based on current trends, for example in resource efficiency. The two policy scenarios include assumptions based on China’s Green Transition Pathway. These scenarios depict policy-rich developments over the next decades while the economy becomes much more a service economy; that is, less focused on manufacturing and cheap exports, while urbanisation continues at an unprecedented pace and scale and the total population levels off by 2025. For more background on China’s Green Transition Pathway, see Appendix 1.
− The Green China plus scenario comprises in relation to China the energy transition pathway as described in China’s Green Transition Pathway. At the global scale, energy policies have been included based on Roelfsema et al. (submitted). Both currently implemented and planned climate policies in all
countries are accounted for in this context; climate policies can vary from policy targets formulated in national policy documents (e.g. National Communi-cation, strategy documents) to specified policy instruments (e.g. ETS, renewable portfolio standard). Emission reduction targets are enforced model-wise for some regions by applying a regional carbon tax. − In the Two-degree Climate Policy scenario, worldwide
additional climate policy is assumed in addition to the policies included in the Green China plus scenario through the introduction of a global carbon price. The carbon price is chosen so that global emissions of greenhouse gases are moderated sufficiently for anthropogenic radiative forcing levels to remain at 2.6 W/m2
while minimising the total discounted climate policy costs induced by this carbon tax. This radiative forcing level corresponds to (a 66% probability of) keeping the increase in global mean temperature below 2o
C relative to pre-industrial levels (Clarke et al., 2014; Krey et al., 2014). In the model, the carbon price induces a broad global shift to technologies with much lower greenhouse gas emissions and to the more efficient use of energy.
20 | The worldwide context of China’s Green Transition to 2050
TWO
2.2 The global Shared
Socio-economic Pathways SSP1, 2 and 3
The Shared Socioeconomic Pathways (SSPs) define five trajectories that human society could follow over the next century. They have been designed in the context of climate change research to show the range of worldwide challenges and opportunities. Over and above their original purpose, the SSPs constitute a widely used starting point for exploring other issues of worldwide significance in development and the environment. The SSPs consist of storylines and quantification, which is provided by six integrated assessment models, including the IMAGE model used in this research.
Among the SSPs, SSP2 is regarded as a baseline
scenario. It follows median assumptions, as the
middle-of-the-road pathway. Median projections do not necessarily imply an extrapolation of current trends, but can also result in a gradual deviation from past trends (O’Neill et al., 2017). An example is global total population, for which the SSP2 scenario sees stabilisation at around nine billion people by 2050. In SSP2,
technology development is assumed to continue without breakthroughs, and agricultural systems continue to evolve steadily in line with FAO expectations. O’Neill et al. write on SSP2: … ‘Development and income
growth proceeds unevenly, with some countries making relatively good progress while others fall short of expectations.
Most economies are politically stable. Globally connected markets function imperfectly. Global and national institutions work toward but make slow progress in achieving sustainable development goals, including improved living conditions and access to education, safe water, and health care. …. Education investments are not high enough to accelerate the transition to low fertility rates on low-income countries and to rapidly slow population growth. This growth, along with income inequality that persists or improves only slowly, continuing social stratification, and limited social cohesion, maintain challenges to reducing vulnerability to societal and environmental changes and constrain significant advances in sustainable development’. (O’Neill et al., 2017, p.173)
SSP2 population (KC and Lutz, 2017) and economic (Dellink, Chateau, Lanzi, and Magné, 2017) projections are input to the IMAGE model. The structural change in the economy is roughly equal to the continuation of current trends, and assumes a very gradual convergence among the world’s economies in their annual rates of
productivity increase, as elaborated for the OECD Environmental Outlook to 2050 (OECD, 2012).
By contrast, the SSP1 scenario depicts a more
sustainable development path, in accordance with its
motto Taking the green road. In this relatively inclusive world, countries collaborate for a greener future. Technology development and policy incentives lead to a reduction in energy use and the increased attractiveness of renewable energy technologies. The scenario is characterised by small population growth and large economic growth. On balance, all developments lead to climate change mitigation being less of a challenge. O’Neill et al. write on SSP1: ‘…Increasing evidence of and
accounting for the social, cultural and economic costs of environmental degradation and inequality drive this shift. Management of the global commons slowly improves, facilitated by increasingly effective and persistent cooperation and collaboration of local, national and international organizations and institutions, the private sector, and civil society. Educational and health investments accelerate the demographic transition, leading to a relatively low population. … Driven by an increasing commitment to achieving development goals, inequality is reduced both across and within countries. Investment in environ-mental technology and changes in tax structures lead to improved resource efficiency, reducing overall energy and resource use and improving environmental conditions over the longer term.’
(O’Neill et al., 2017, p.172)
At the other end of the spectrum, in term of climate change mitigation effort and many other challenges, lies the SSP3 scenario, depicting a rocky road. In this case, there is much rivalry between regions, leading to less sustainable technology development and to environmental concerns being treated as a low priority. In currently industrialised countries, the population does not increase much but in developing countries population increases are large. In the SSP3 scenario, the world remains very dependent on fossil fuels and similar resources.
O’Neill et al. write on SSP3: ‘…Policies shift over time to
become increasingly oriented toward national and regional security issues, including barriers to trade, particularly in the energy resource and agricultural markets. Countries focus on achieving energy and food security goals within their own regions at the expense of broader-based development, and in several regions move toward more authoritarian forms of government with highly regulated economies. Investments in education and technological development decline. Economic development is slow, consumption is material-intensive, and inequalities persist or worsen over time, especially in developing countries. … Growing resource intensity and fossil fuel dependency along with difficulty in achieving international cooperation and slow technological change imply high challenges to mitigation. The limited progress on human development, slow income growth, and lack of effective institutions, especially those that can act
21
2 Methodology |
TWO TWO
across regions, implies high challenges to adaptation for many groups in all regions…. SSP3, with its theme of international fragmentation and a world characterized by regional rivalry can already be seen in some of the current regional rivalries and conflicts, but contrasts with globalization trends in other areas.’
(O’Neill et al., 2017, p. 173)
An overview table presenting how the storylines have been translated for quantitative modelling with IMAGE can be found in Van Vuuren et al. (2017).
2.3 Model description
The IMAGE framework (Stehfest et al., 2014) has been designed to analyse large-scale and long-term interactions between human development and the natural environ-ment and to identify response strategies to global environmental change based on the assessment of options for mitigation and adaption. It is a simulation model, which means that changes in model variables are calculated on the basis of the information from the previous time step. The IMAGE framework is structured so that it broadly reflects the causality chain of key global sustainability issues. It comprises two main systems: 1) the human
system, featuring the long-term development of socio-economic activities relevant for sustainable development; and 2) the earth system, featuring changes in natural systems such as the carbon and hydrological cycles. The two systems are linked through emissions, land-use changes, climate feedbacks and potential human policy responses. The model simulates most of the socio-economic parameters for 26 regions (see Figure 2.1) and most of the environmental parameters, depending on the variable, on the basis of a geographical grid of 0.5° longitude by 0.5° latitude. Some earth system variables are however presented at a spatial resolution of 5 by 5 minutes. At the equator, these resolutions equal approximately 50x50 km and 10x10 km, respectively. IMAGE regions are defined so that biophysical developments (e.g. water availability) and socio-economic developments (e.g. trade flows) can be modelled and can be calibrated historically using very long time series, even for economic units that no longer exist (e.g. the former USSR). The exact composition of the IMAGE regions and their relation to national historic data series can be found here: http://themasites.pbl.nl/ models/image/index.php/Region_classification_map. Figure 2.1
The 26 world regions in IMAGE 3.0
Canada United States Mexico Central America Brazil Rest of South America South Africa Rest of Southern Africa Northern Africa Western Africa Eastern Africa Western Europe Central Europe Turkey Ukraine region Central Asia Russia region Middle East India
Rest of South Asia Indonesia region Southeast Asia Japan Korea region China region Oceania Antarctica Greenland Source: PBL 2014 pbl.nl
22 | The worldwide context of China’s Green Transition to 2050
TWO
The IMAGE framework has a modular structure, with some components linked directly to the model code of IMAGE. Other components are connected through soft links, meaning that modules run independently and information between them is exchanged using data files. The human system of the IMAGE framework comprises detailed representations of the energy system and the agricultural system. Important inputs relate to the future development of direct and indirect drivers of global environmental change: exogenous assumptions on population, economic development, lifestyle, policies and technology change. These assumptions feed into the
food and agriculture system model MAGNET and the energy system model TIMER (Woltjer et al., 2014). TIMER is a system dynamics energy system simulation model. In the energy system model, future energy systems are described in terms of changes in energy demand, energy conversion and supply, driven by key dynamics of economic activity, development, technology change and resource depletion. MAGNET is a computable general equilibrium (CGE) model that provides information in the IMAGE framework on the agricultural economy (Woltjer et al., 2014). It is connected via a soft link to the core model of IMAGE.
Figure 2.2
IMAGE 3.0 framework
Source: PBL 2014
Drivers
(Population, economy, policies, technology, lifestyle, resources)
Climate policy Air pollution and energy security policies
Land use and biodiversity policies Policy responses Human system Earth system Impacts Agricultural economy
Land cover and land use Emissions
Energy supply and demand
Land-use allocation Forest
management Livestocksystems
Agriculture and land use
Land Atmosphere and Oceans
Energy demand Energy conversion
Atmospheric composition and climate Carbon cycle and
natural vegetation
Crops and grasslands
Water Nutrients
Energy supply
Climate
impacts Agriculturalimpacts Water stress
Terrestrial biodiversity
Aquatic
biodiversity Flood risks
Land degradation Ecosystem services Human development pbl.nl
23
2 Methodology |
TWO TWO
In IMAGE, the main interaction with the earth system is through changes in energy, food and biofuel production that induce land-use changes and emissions of CO2 and other greenhouse gases (see Figure 2.2). A key component of the earth system in IMAGE 3.0 is the LPJmL model (Bondeau et al., 2007), details of which can be found in Müller et al. (2016). LPJmL covers the terrestrial carbon cycle and vegetation dynamics in IMAGE 3.0. It estimates productivity at the grid cell level for natural and cultivated ecosystems on the basis of plant and crop functional types. A set of allocation rules in IMAGE determines land cover based on regional production levels and the output of LPJmL.
A worldwide hydrology model is also included in the LPJmL model. Due to this linked hydrology model, IMAGE captures future changes in irrigated areas, water
availability, agricultural water demand and water stress. LPJmL calculates water demand for irrigated agriculture based on evapotranspiration requirements for the crop
types grown on irrigated land. Water demand for other sectors (households, manufacturing, electricity and livestock) is determined based on population, economic growth, industrial value added and electricity production as projected with IMAGE-TIMER.
To capture climate change impacts, the results of calculations of emissions of greenhouse gases and air pollutants are used in IMAGE to estimate changes in concentrations of greenhouse gases, ozone precursors and substances involved in aerosol formation on a global scale. Climate change is calculated as the global mean temperature change. Using a slightly adapted version of the MAGICC 6.0 climate model (Meinshausen, Wigley, and Raper, 2011), changes in temperature and precip-itation in each grid cell are derived from the global mean temperature using a pattern-scaling approach. MAGICC 6.0 accounts for several feedback mechanisms between climate change and dynamics in the energy, land and vegetation systems.
24
THREE
| The worldwide context of China’s Green Transition to 2050
Comparison of
international projections
and China’s Green
Transition Pathway
three
3.1 Key drivers
Economic and population growth typically result in an increased pressure on resources and the environment due to growing demand. This section evaluates how these drivers of demand develop according to China’s Green Transition Pathway (CGTP), compared to authoritative international projections.
In all scenarios, the urban population continues to grow compared with the rural population (Figure 3.1). China’s Green Transition Pathway features extensive urbanisation, comparable to the trend in the sustainable development SSP1 scenario and the two IEA WEO scenarios. Whether the net environmental impact will be positive or negative will depend on how urban
development and mobility will be organised and how lifestyles and consumption trends in this increasingly urban, and ageing, society will develop.
For a better understanding of China’s Green Transition Pathway, it is compared with a broad range of international projections described in Chapter 2. The comparison focuses on three topics: key socio-economic drivers, energy system indicators and carbon dioxide emissions. China’s Green Transition Pathway is compared with the IMAGE model Shared Socio-economic Pathway baselines SSP1, SSP2 and SSP3, as described in Appendix 1. It should be noted that the China region as modelled in IMAGE comprises mainland China, Hong Kong, Macau and Taiwan, as well as Mongolia. In addition, China’s Green Transition Pathway is compared to the IEA’s Current Policy and New Policy WEO scenarios (for which only 2020 and 2040 data was available).
25
3 Comparison of international projections and China’s Green Transition Pathway |
THREE THREE
Figure 3.12010 2020 2030 2040 2050 0 200 400 600 800 1000 1200 million people Source: PBL; DRC; IEA pb l.n l China
China's Green Transition Pathway (CGTP) World Energy Outlook scenarios (Current Policies / New Policies)
China region SSP1 SSP2 SSP3 Urban population Population in China 2010 2020 2030 2040 2050 0 200 400 600 800 1000 1200 million people pb l.n l Rural population
By 2050, China’s Green Transition Pathway features 160 million more urban dwellers than the SSP2 baseline.
Figure 3.2 shows the sectoral GDP assumptions. For CGTP and IEA’s WEO projections, only GDP growth rates were available. These have been applied to the IMAGE SSP GDP projection from historic values onwards. Sectoral GDP data was unavailable for IEA’s WEO projections. Figure 3.2 shows that the economy continues to grow in all
scenarios, although CGTP sees the economy growing faster towards 2050 than is assumed in most SSPs. The most striking feature of China’s Green Transition Pathway is the growth in the share of the service sector, which is larger than assumed in the SSPs. Whereas the service sector currently makes up approximately half of China’s GDP, this grows to more than 75% in the CGTP.
As a result, industrial and agricultural shares in GDP decrease. Although the share of the industrial sector in the Chinese economy decreases in the CGTP, its absolute size does increase, although to a much lesser extent than in the SSPs.
CGTP appears potentially much greener than any of the international scenarios because its GDP growth comes from the service sector. Whether this greenness will in fact materialise is however dependent upon policy. For example, in an online economy it is dependent on transport (including the notorious last mile delivery), inner city development and the use of natural resources.
26 | The worldwide context of China’s Green Transition to 2050
THREE
Figure 3.2 2010 CGTP WEO SSP1 SSP2 SSP3 2020 CGTP WEO SSP1 SSP2 SSP3 2030 CGTP WEO SSP1 SSP2 SSP3 2040 CGTP WEO SSP1 SSP2 SSP3 2050 CGTP SSP1 SSP2 SSP3 0 20 40 60 80 100 trillion USD (PPP, 2005) Source: PBL; DRC; IEA pb l.n l Agriculture Industry Services Undivided total China– China's Green Transition Pathway (CGTP)
– World Energy Outlook scenarios (Current Policies / New Policies) China region
– SSP1 – SSP2 – SSP3 Gross Domestic Product (GDP) of China
China’s Green Transition Pathway sees strong growth in China’s service sector; much more so than in the SSP2 baseline.
Figure 3.3
CGTP WEO Current Policies WEO New Policies SSP1 SSP2 SSP3 0 25 50 75 100 125 EJ Source: PBL; DRC; IEA pb l.n l Industry Transport Services Residential Other sectors China
– China's Green Transition Pathway (CGTP) – World Energy Outlook scenarios (Current Policies / New Policies)
China region – SSP1 – SSP2 – SSP3 2020
Final energy demand in China
CGTP WEO Current Policies WEO New Policies SSP1 SSP2 SSP3 0 25 50 75 100 125 EJ pb l.n l 2040
China’s Green Transition Pathway final energy demand1 is roughly in line with international scenarios. Here, a certain degree of uncertainty applies,
27
3 Comparison of international projections and China’s Green Transition Pathway |
THREE THREE
Figure 3.4
CGTP WEO Current Policies WEO New Policies SSP1 SSP2 SSP3 0 50 100 150 200 EJ Source: PBL; DRC; IEA pb l.n l Coal Oil Natural gas
Solar and wind power Hydropower Other renewable energy Nuclear energy 2020
Primary energy supply in China
CGTP WEO Current Policies WEO New Policies SSP1 SSP2 SSP3 0 50 100 150 200 EJ pb l.n l 2040 China
– China's Green Transition Pathway (CGTP) – World Energy Outlook scenarios (Current Policies / New Policies)
China region – SSP1 – SSP2 – SSP3
China’s Green Transition Outlook shows a decrease in the primary energy supply.
3.2 Energy
Chinese energy consumption is projected to increase slightly in all scenarios included in the comparison over the coming decades, mainly due to growing energy use in the transport sector (see Figure 3.3). China’s Green Transition Pathway shows a similar trend. Industrial energy consumption in this scenario is slightly larger than in the international scenarios, except for the IEA Current Policy scenario. This larger energy consumption by industry is unexpected since China’s Green Transition Pathway sees less growth in the industrial sector (see previous section). Energy use in the transport sector is comparable to the SSP1 projections in which green growth is associated with the increased use of energy efficient modes such as public transport and cycling (Van Vuuren et al., 2017).
The primary energy supply takes a notably different path in China’s Green Transition Pathway compared to the projections by the international scenarios (Figure 3.4). In 2020, the differences are not that obvious. However, according to China’s Green Transition Pathway, the primary energy supply in 2040 is much less and a large share of it is supplied by low-carbon energy production technologies. Ambitious energy policy targets are adhered to by the Green Transition Pathway, including capping the total primary energy supply and limiting the share of fossil fuels.
For this figure, primary energy source conversion factors for nuclear energy, hydropower, and solar and wind power are set to one. As a result, the contribution of renewable energy looks rather limited, compared to its share in final energy supply.
28 | The worldwide context of China’s Green Transition to 2050
THREE
3.3 Carbon dioxide emissions
The effect of less carbon-intensive energy production on emissions can clearly be seen in Figure 3.5. This figure shows the projected energy and industry-related CO2 emissions. The same emission factors have been applied for fossil fuel use for all scenarios. In China’s Green Transition Pathway, carbon dioxide emissions are 53% to 69% of the CO2 emissions projected for 2040 in the international scenarios.
Figure 3.5
CGTP WEO Current Policies WEO New Policies SSP1 SSP2 SSP3 0 4 8 12 16 Gt CO2 Source: PBL; DRC; IEA pb l.n l 2020
Carbon dioxide emissions from energy and industry in China
CGTP WEO Current Policies WEO New Policies SSP1 SSP2 SSP3 0 4 8 12 16 Gt CO2 pb l.n l 2040 China
– China's Green Transition Pathway (CGTP) – World Energy Outlook scenarios (Current Policies / New Policies)
China region – SSP1 – SSP2 – SSP3
The reduced increase in energy demand and increase in share of renewable energy in China’s Green Transition Pathway result in lower carbon dioxide emissions.
30
FOUR
| The worldwide context of China’s Green Transition to 2050
China’s development
trajectory in a global
context
four
4.1 Energy
Differences in policies and drivers have a large effect on the energy demand per sector (Figure 4.1a). In the baseline scenario, almost all major demand sectors show growth in energy demand towards 2050 (except for the industrial sector, where demand increases towards 2030 then decreases in 2050 back to 2010 levels). The baseline scenario shows particularly high relative growth in the transport and service sectors compared to 2010 levels. China’s Green Transition Pathway assumptions result in a large decrease in the industrial sector’s energy demand compared to the baseline scenario (a difference of more than 25% in 2050). The figures in this chapter show results of worldwide scenarios. Of these, Green China plus comprises China’s Green transition Pathway. A full description of how China’s Green Transition has been incorporated is provided in Section 2.1, with details in Appendix 2. Demand in the transport sector also decreases (a difference of more than 15% compared to the baseline scenario in 2050). The energy demand for the residential sector shows no large difference, which is remarkable given the enormous urbanisation going on in these decades. On the other hand, demand for the service sector increases by almost 33% compared to the baseline scenario in 2050.
How does China’s Green Transition Pathway, as outlined by the DRC, affect the global environ-ment? And, in return, how do developments in the global environment impact China’s projected futures? To better understand these interactions, three scenarios are compared within the IMAGE model framework. Unlike the comparison scenarios used in the previous chapter, these are all tailor-made for the current study. For a brief description, see Section 2.1 and the table included therein. The three scenarios provide a general illustration of Chinese energy systems over the coming decades, building on China’s Green Transition Pathway. First, energy system effects are discussed. Then, we look at the effects on global climate change as well as emissions of macro air pollutants. Finally, land-use changes are considered.
Table 4.1
Carbon tax applied in the Two-degree Climate Policy scenario USD/tCO2 2015 0 2025 99 2050 569 2075 853 2100 998
A greater reduction in energy use is required to achieve a 2 °C climate target, but the various policy strategies in the Green China plus scenario do bring Chinese energy use closer to a 2 °C pathway. In order to achieve the required additional reduction, a global carbon tax is applied in the model (Table 4.1).
Figure 4.1b shows the contribution of China’s final energy demand to the global final energy demand both in absolute terms and per capita. In all scenarios, China continues to be the region with the largest final energy demand, although the share slightly decreases for the Green China plus and the Two-degree Climate Policy
31
4 China’s development trajectory in a global context |
FOUR FOUR
Figure 4.1a
2010 2030 Baseline Green China plus Two-degree Climate Policy 2050 Baseline Green China plus Two-degree Climate Policy
0 20 40 60 80 100 120 EJ Source: PBL pb l.n l Industry Transport Services Residential Other sectors Final energy demand in China region
The global Two-degree Climate Policy scenario shows a particular decrease in China’s energy use for the transport sector.
Figure 4.1b
2010
2030 Baseline Green China plus Two-degree Climate Policy
2050 Baseline Green China plus Two-degree Climate Policy 0 100 200 300 EJ Source: PBL pb l.n l
China region United States
Western and Central Europe India
Rest of the world Global average Absolute
Final energy demand per region
2010
2030 Baseline Green China plus Two-degree Climate Policy
2050 Baseline Green China plus Two-degree Climate Policy 0 50 100 150 200 GJ per capita pb l.n l Per capita
By 2050, the final energy demand in the Rest of the World will be large in any scenario. China’s per-capita final energy use remains roughly half that of the USA and more than that of India in all scenarios throughout the scenario period.
32 | The worldwide context of China’s Green Transition to 2050
FOUR
scenarios (from 21.2% to 19.9% and 18.8%, respectively). China’s per-capita final energy demand moves towards European values in 2050, although such developments in China depend highly on the climate ambitions.
The baseline scenario and the Green China plus scenario allow for some increase in per-capita final energy demand compared to 2010, but the Two-degree Climate Policy scenario requires a decrease.
A key element of the new path laid out by the Chinese leadership is a break with current economic trends by moving away from energy-intensive industries and attaching increasing importance to the service sector. As a result, China’s energy intensity (energy use per GDP) is expected to follow a path similar to that of economies such as Japan and South Korea. The projected energy intensity of the Green China plus scenario, which follows developments as assumed in China’s Green Transition Pathway, would indeed continue to decrease to a level even lower than Korea1 and Japan currently (Figure 4.2). However, strong energy intensity improvements are already assumed in the baseline scenario. The scenario that pursues a 2 °C goal implies an even greater decrease in energy intensity.
A large transformation in the power sector can be identified in the Green China plus scenario (Figure 4.3), as the dominant role of coal in the baseline scenario is replaced with low-carbon technologies towards 2050. The Two-degree Climate Policy scenario shows an even larger shift away from coal and all other fossil fuels,
as almost all non-CCS fossil fuel consumption has disappeared by 2050.
Comparing China’s electricity sector projections to developments in Europe and global developments, a few differences stand out. First, China’s Green Transition Pathway policy included in the non-baseline scenarios is relatively successful in reducing the share of fossil fuels in the electricity mix. The difference is especially large when it comes to China’s baseline projections on coal use. Introducing further climate policy in the Two-degree Climate Policy scenario removes almost all coal use in all regions in 2050. In this scenario, nuclear energy, and solar and wind power outcompete CCS, based on costs in China. Secondly, due to assumptions on the relatively low Chinese capital costs for nuclear power plants compared to those in Europe, China’s nuclear energy share in the Two-degree Climate Policy scenario becomes relatively large. In Europe, nuclear energy capital costs are considerably higher, contributing to a larger solar and wind share. Given the merit order dispatch of power technologies, the larger share of solar and wind, in turn, results in fewer full load hours available for nuclear energy, increasing the capital costs of nuclear energy per kWh of produced electricity even more. This is also true for fossil CCS technologies in Europe. Biomass CCS is competitive, but restricted due to limited biomass availability.
Effects of China’s Green Transition Pathway can also be identified in the total primary energy supply (see Figure 4.2 1990 2000 2010 2020 2030 2040 2050 0 4 8 12 16 MJ per USD (PPP, 2005) Source: IEA; PBL pb l.n l China region United States Korea
Western and Central Europe Japan
Scenarios China region Baseline Green China plus Two-degree Climate Policy Energy use per GDP
33
4 China’s development trajectory in a global context |
FOUR FOUR
Figure 4.3
2010 2030 Baseline Green China plus Two-degree Climate Policy 2050 Baseline Green China plus Two-degree Climate Policy
0 10 20 30 40 50 EJ pb l.n l Coal Oil Natural gas Fossil with CCS Bio-energy Bio-energy with CCS Solar and wind power Hydropower Other renewable energy Nuclear energy China region Electricity generation 2010 2030 Baseline Green China plus Two-degree Climate Policy 2050 Baseline Green China plus Two-degree Climate Policy
0 50 100 150 200 EJ Source: PBL pb l.n l Global 2010 2030 Baseline Green China plus Two-degree Climate Policy 2050 Baseline Green China plus Two-degree Climate Policy
0 5 10 15 20
EJ
pb
l.n
l
Western and Central Europe
The role of coal in electricity production shrinks in all scenarios except in the baseline scenario .
Figure 4.4a). The reduction in sectoral energy demand in the Green China plus scenario compared to the baseline scenario results in less demand for primary energy carriers. The Green China plus scenario deviates from the baseline scenario when it comes to the share of coal and carbon low technologies. Coal consumption in the Green China plus scenario shrinks by about 65% compared to the baseline scenario in 2050. This shrinkage is largely replaced with low-carbon sources, such as solar, wind and nuclear energy. The introduction of climate policy results in the use of CCS technologies, especially towards 2050. CCS is mostly applied outside the electricity sector. For Figure 4.4, primary energy source conversion factors for nuclear energy, hydropower, and, solar and wind
power are set to one. As a result, the contribution of renewable energy looks rather limited, compared to its share in final energy supply.
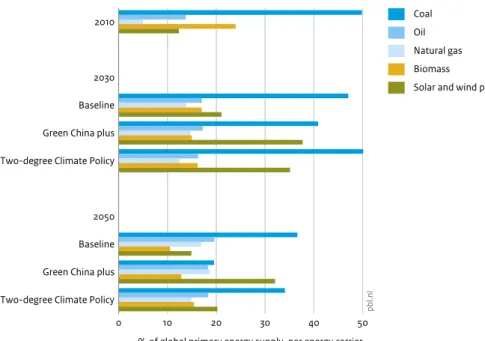
Figure 4.4b shows the shares of China, India, Europe and the United States in the global primary energy supply, as well as the per-capita primary energy supply for these regions. Towards 2050, China’s share in the global primary energy supply is expected to stay constant in the baseline projection. When introducing energy and climate policy, the global primary energy supply decreases in both the Green China plus and the Two-degree Climate Policy scenarios, by about 10% and 44%, respectively, compared to the baseline scenario in 2050. The figure shows that, also globally, a relatively large reduction in
34 | The worldwide context of China’s Green Transition to 2050
FOUR
Figure 4.4a 2010 2030 Baseline Green China plus Two-degree Climate Policy 2050 Baseline Green China plus Two-degree Climate Policy0 50 100 150 200 EJ Source: PBL pb l.n l Coal Oil Natural gas Fossil with CCS Bio-energy Bio-energy with CCS Solar and wind power Hydropower Other renewable energy Nuclear energy Primary energy supply in China region
Achieving a 2 °C target requires large additional reductions in non-CCS fossil fuel use compared to the Green China plus scenario.
Figure 4.4b
2010
2030 Baseline Green China plus Two-degree Climate Policy
2050 Baseline Green China plus Two-degree Climate Policy 0 100 200 300 400 EJ Source: PBL pb l.n l
China region United States
Western and Central Europe India
Rest of the world Absolute
Primary energy supply per region
2010
2030 Baseline Green China plus Two-degree Climate Policy
2050 Baseline Green China plus Two-degree Climate Policy 0 50 100 150 200 250 GJ per capita pb l.n l Per capita
The Green China plus scenario sees the primary energy supply in China decrease relatively strongly. The Two-degree Climate Policy scenario features a large reduction in per-capita energy use in the United States.