COMPARATIVE STUDY OF TESTIN AND
LMCD1, HOMOLOGOUS PROTEINS WITH A
POTENTIAL ROLE IN CANCER
.
Word count: 19800
Chiara Van Passen
Student number: 01504025
Supervisor(s): Prof. Dr. Marleen Van Troys, Prof. Dr. Christophe Ampe
A dissertation submitted to Ghent University in partial fulfilment of the requirements for the degree of Master of Science in Biomedical Sciences.
PREAMBLE
Measures taken to prevent the spread of the COVID-19 virus have had a substantial impact on the course of this master thesis. In the following section we elaborate on this impact and the coping mechanisms that were set in place.
Original plan: An extensive re-evaluation and comparison were planned of the large
set of interactome data for the proteins LMCD1 and testin that was previously generated in the group based only on data. This in silico study, mainly using Ingenuity® Pathway Analysis (IPA), would form a basis for a selection of specific interaction partners of interest. The selected interactions would subsequently be experimentally validated in multiple ways. A second aim was to study cytoplasmic-nuclear translocation of the protein LMCD1.
Originally planned schedule: The in silico study of the interactome data sets was mainly
scheduled in semester 1 and experimental validation was mainly scheduled for semester 2. This also fitted the agenda of the supervisor of this study which had a heavier educational work load in semester 1.
Semester 1 was finally used almost entirely for the data mining of the data sets. In the second semester we were just coming up to speed for 8-9 weeks of intense full time experimental work when Covid-19 unfortunately forced us to stop all lab activities. As a results only a limited number of experiments were performed and these were mostly still preparatory experiments (exploring test conditions, etc.). Where relevant, we report on these experiments.
As an alternative for the interrupted lab work, additional in silico analysis of the proteomics data guided by published as well as the unpublished data on LMCD1 and testin was executed from home. A drawback here was that IPA could not be accessed at home. In addition, we set out to mine additional publicly available databases to unveil new information on LMCD1 and testin (mutations in cancer patients, posttranslational modifications, etc.). This served a double purpose: they will become part of a planned review on Testin/LMCD1 (summer 2020) and will form a basis or provide new insights for future research lines on these proteins in the research group.
Altogether, the corona measures had a very significant impact on the validation experiments that could not be performed or optimized. In order to cope with these limitations, the master thesis was stirred in the direction of in silico data analysis. Fortunately, this alternative strategy has also been an enlightening road full of challenges and discoveries.
Chiara Van Passen
Marleen Van Troys (supervisor)
PREFACE
Before you lays the master’s thesis “Comparative study of testin and LMCD1, homologous proteins with a potential role in cancer”. It has been written as a completion of the master Biomedical Sciences at Ghent University.
First I would like to thank my supervisor Leen for her valuable input and support during this process. Without your patience and guidance this project wouldn’t have been possible. Furthermore I would like to thank prof Christophe Ampe and PhD student Elias Van de Vijver who were always ready to bat around ideas about my research and to debate issues. To all the other students and colleagues of the research group: I would like to thank you for the much appreciated distractions and breaks from time to time and the overall kindness and willingness to help. Finally my parents and sister deserve a special note of thanks: If I ever lost interest, you kept me motivated. Thank you for your continuous support and love during this time. I hope you enjoy reading my master’s thesis and that it may inspire you.
CONTENTS
SUMMARY ... 1
INTRODUCTION ... 2
Testin and LMCD1: a tale of similarities and differences ... 2
Protein module-based interactomics shows: LMCD1 shares interaction partners with testin, but also has distinct binding partners ... 5
Testin contains a nuclear location and a nuclear export signal (Vaccaroli et al., submitted) ... 8
A primer on the aminoacyl synthetase complex and tRNA charging ... 9
A primer on selected protein complexes involved in endocytosis signalling and COPI/II coated vesicles in secretion ... 11
MATERIALS AND METHODS ... 13
Cell culture, expression plasmids, transfection and fixation protocols ... 13
Selection of antibodies ... 14
Preparation of cell extracts and western blot analysis ... 14
Microscopy and image analysis ... 15
Pathway analysis using Ingenuity® Pathway Analysis ... 15
Public dataset analysis ... 15
Immunofluorescence ... 16
RESULTS ... 16
Specific versus aspecific protein in the LMCD1 complexomes: critical assessment of the threshold setting ... 16
A functional link between LMCD1 and not testin in the multi-aminoacyl-tRNA synthetase complex and tRNA Charging? New steps towards validation. ... 19
4.2.1 Curation of the complexome data: LMCD1 & Testin vs tRNA charging ... 19
4.2.2 Toward experimental validation of LMCD1 - tRNA charging relationship ... 21
Putative role of LMCD1 and testin in intracellular vesicle transport: new steps towards validation ... 22
4.3.1 Curation of the complexome data: LMCD1 and testins & Vesicle transport signalling ... 22
4.3.2 Validation of the role of LMCD1 and testin in intracellular vesicle transport signalling ... 25
LMCD1 contains NES and NLS sequences at the positions corresponding to the validated NES/NLS in testin ... 26
4.4.1 Conservation of the NES and NLS sites of testin in LMCD1 ... 26
4.4.2 Investigating the nuclear-cytoplasmic distribution upon leptomycin B treatment in HeLa cells ... 26
4.4.3 Towards the generation and testing of LMCD1 NES/NLS mutants. ... 27
Mutations and posttranslational modifications in the (putative) NES and NLS sites in testin and LMCD1 ... 28
Mutational analysis and post translational modifications in TES and LMCD1 .... 30
4.6.1 Frequency of mutation types in TES and LMCD1 in cancer patient samples: an overview ... 30
4.6.2 Point mutations in LMCD1 and TES proteins in cancer patients ... 31
4.6.3 Tumour types with gene alterations in the LMCD1 and TES genes ... 32
4.6.4 Analysis of the functional impact of the mutations in LMCD1 and testin ... 35
DISCUSSION ... 38
LMCD1 but not testin as a player in tRNA charging? ... 38
Putative role of LMCD1 and testin in intracellular vesicle transport ... 39
A NES and NLS for LMCD1? ... 39
Mutational analysis in TES and LMCD1 using cBioPortal ... 40
5.4.1 Mutational analysis in TES reveals a putative additional mechanism to downregulate expression ... 40
5.4.2 Mutational analysis in LMCD1 ... 41
GENERAL CONCLUSION ... 42
1
SUMMARY
The paralogous proteins testin and LMCD1 have a similar domain organisation and are coexpressed in human cells, yet they are claimed to have opposing effects on tumorigenesis. Testin is reported to be downregulated in multiple cancer types whereas the reports on LMCD1 suggest a role in transcriptional regulation and metastasis. Both in normal and cancer cells the information on the exact functions of LMCD1 and testin is, however, still limited. We present a comparative study on different levels. First, pathway analyses of interactome data of both full length proteins and their domains were critically reassessed and compared on the level of specific pathways. This established links to cellular functions and specific molecular complexes which LMCD1 but not testin may be uniquely associated with: tRNA-charging complexes and COPI coatomer complexes. Second, in-depth analysis of the alterations in the LMCD1 and testin genes in large numbers of cancer patient genomes resulted in a more diverse view on copy number changes and mutations than the one that currently dominates in literature. Finally, signal sequences for nuclear export and import and cancer-related mutation herein were compared in two proteins. This study provides new perspectives for future research on novel LMCD1 functional pathways, for generating clinically relevant LMCD1 and testin mutants and tools to compare the nuclear function of these proteins.
2
INTRODUCTION
As introduction to this comparative study we first provide an overview of the currently reported insights on the two proteins under study in which we mainly highlight key similarities and differences (§2.1). Subsequently, we provide more detailed information on specific recent or unpublished data that are relevant for this work: the currently derived catalogues of proteins that may form complexes with testin or LMCD1 (§2.2) and the cytosol-nuclear translocation of testin (§2.3). Finally, we describe molecular complexes and higher order structures essential for charging of tRNA with amino acids during protein synthesis in §2.4 and intracellular vesicle transport in §2.5 as background information for putative functions of LMCD1 investigated here.
Testin and LMCD1: a tale of similarities and differences
Testin and LMCD1 are paralogous intracellular proteins from the small testin family and mainly testin itself has been studied in the context of cancer. Since their discovery many functional correlations to specific functions in healthy and cancer cells as well as in cancer mouse models are reported. However, the exact role of these proteins in cells (either normal or tumour) is not yet known. Since they have never been studied in parallel, it is still insufficiently known whether testin and LMCD1 have (partly) redundant functions or whether they have evolved to function in different ways in cells. Figure 1 demonstrates that testin and LMCD1 are co-expressed in most human healthy tissues albeit at variable levels.
Figure 1 Proteome based relative expression in normal human tissues1. Skeletal muscle (not analysed in 1), but from 2 testin/LMCD1 transcript ratio is 1/37.
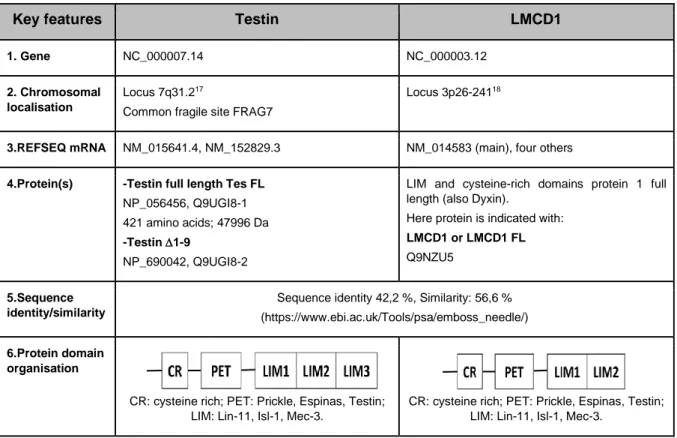
In Table 1 and Figure 2 we collected selected properties of these proteins and their genes/transcripts that illustrate how they are similar or different based on current published data. Note that Table 1 is far from exhaustive and compiles results of different studies in condense generalizing statements: this approach is taken on purpose to promote a comparison between the two proteins. We, however, refer to specific publications or reviews for more detailed information.
The domain structure of testin and LMCD1 is very similar as shown (see Table 16) but differs in the number of LIM domains. In testin the LIM domains are shown to be involved in recruiting the protein to focal adhesions, the anchor points of a cell with the extracellular matrix via integrins, by interacting with amongst others focal adhesion components zyxin and VASP3
(see also Figure 2). The N-terminal part and especially the CR domains of testin are involved in F-actin interactions (Medves et al. unpublished) and in cells this part indeed localizes to stress fibres (Figure 2). Conversely, LMCD1-FL nor any of its domains localize to F-actin rich
3 regions in cells (Master thesis Van Himst A.). In vitro both testin and LMCD1 are, however, shown to interact with actin filaments (unpublished). LMCD1 has been localized to Z-disks in skeletal muscle cells4. In cardiac muscle, testin and LMCD1 also appear to play opposing roles
in relation to cardiac hypertrophy via a different effect on calcineurin signalling (see table 1 n°10, 5,6).
Testin and LMCD1 have both been reported in the nucleus as well as in the cytosol. The role of testin in the nucleus is not known, but the testin signal sequences for nuclear import and export have been identified (§2.3). Conversely, many reports on LMCD1 consider it as a transcriptional regulator (see table 1 n°12) and it associates with different transcription factors in a context dependent manner. It has also been described as a factor in the regulation of epithelial-mesenchymal transition7.
Next to the differences in subcellular location, the dominating difference emanating from the published record is a difference in cancer. In many cancers testin is acting as a tumour suppressor (see 8 for recent review). Its gene is located at a well-documented fragile locus
and downregulation is also attributed to promotor methylation and/or loss of heterozygosity. For LMCD1, Chang et al9 propose an opposite role in tumorigenesis of hepatocellular
carcinoma as they identified the LMCD1 locus as an amplified region and observed more lung metastasis in a mouse model.
A fascinating feature of testin is that it can adopt different conformational states, both as a monomer and as a dimer in which the different domains display different accessibility to protein partners making the protein a more versatile nanomachine. An association between the PET and first LIM domain is an important determinant in this10. It is not known whether LMCD1 also
has this property but in any case differences will exist in the ultimate conformations due to the fact that LMCD1 has only 2 LIM domains.
Domain structure and protein conformations determine in which complexes a protein is participating and which partner proteins it interacts with. This is for testin and LMCD1 discussed in detail in §2.2.
Table 1 Selected features of testin and LMCD1 (4,6–8,10–16 and references therein).
Key features Testin LMCD1
1. Gene NC_000007.14 NC_000003.12
2. Chromosomal localisation
Locus 7q31.217
Common fragile site FRAG7
Locus 3p26-24118
3.REFSEQ mRNA NM_015641.4, NM_152829.3 NM_014583 (main), four others
4.Protein(s) -Testin full length Tes FL
NP_056456, Q9UGI8-1 421 amino acids; 47996 Da
-Testin 1-9
NP_690042, Q9UGI8-2
LIM and cysteine-rich domains protein 1 full length (also Dyxin).
Here protein is indicated with:
LMCD1 or LMCD1 FL
Q9NZU5
5.Sequence identity/similarity
Sequence identity 42,2 %, Similarity: 56,6 % (https://www.ebi.ac.uk/Tools/psa/emboss_needle/)
6.Protein domain organisation
CR: cysteine rich; PET: Prickle, Espinas, Testin; LIM: Lin-11, Isl-1, Mec-3.
CR: cysteine rich; PET: Prickle, Espinas, Testin; LIM: Lin-11, Isl-1, Mec-3.
4 7.Conformational
states
See Figure 2A. Unknown (indications for dimer formation)
8.Role in human cancer
-Proposed tumour suppressor in many cancer types: a.o. ovarian, lung, head and neck squamous cell cancer, breast, endometrial, colorectal, prostate and gastric cancers, leukaemia, etc. -Downregulation via loss of heterozygosity, promotor hypermethylation and mutations. -Re-expression inhibits tumour cell growth and induces apoptosis.
-Possible tumour promoting effect (in hepatocellular carcinoma (HCC) and cells). Somatic mutations in HCC: E135K (in PET), K273R (in LIM1).
-EMT-enhancing transcription factor.
9. Effect in mouse model
TES 'knock-out' mice show a significantly higher incidence of drug-induced gastric tumours compared to ‘wild-type' mice.
Higher incidence of lung metastasis upon tail vain injection of HCC cells expressing LMCD1-E135K (> wild type LMCD1 or K237R- LMCD1).
10.Biological roles (selection)
-Scaffold protein, interacts with components of the actin cytoskeleton and focal adhesions.
-Role in cell adhesion, cell spreading and in the reorganization of the actin cytoskeleton.
-Protects against cardiac hypertrophy by targeting a calcineurin-dependent signalling pathway.
-Corepressor of the GATA6 transcription factor in lung and cardiac tissue.
-Transcription cofactor in cardiopulmonary and vascular smooth muscle tissue.
-Promotes development of cardiac hypertrophy via activation of calcineurin/nuclear factor of activated T-cells signalling pathway.
-Z-disk protein in striped muscle cells.
11.Subcellular localisation
Localizes to actin rich structures (focal adhesions and stress fibres) in cytosol, reported in nucleus (figure 2B).
-Apparent homogeneous distribution in cytosol: no enrichment to focal adhesions, stress fibres, etc.
-Present at as yet undefined dot-like structures (figure 2B).
12.Role in nucleus (See §2.3)
-Undergoes nuclear-cytoplasmic transport actively regulated by a nuclear export signal (NES) and a nuclear localisation signal (NLS).
-Variant interacts with glucocorticoid receptor (GR).
Role as a transcriptional regulator (GATA6, NFAT, E2F1). 13.Binding partners links (See §2.2) https://thebiogrid.org/117572/summary/homo-sapiens/tes.html
299 putative partners (95% from high throughput studies).
https://thebiogrid.org/119020/summary/homo-sapiens/lmcd1.html
9 putative interactors (44% from high throughput studies) (+ see § 2.2 for unpublished).
14.Validated binding partners
VASP, Zyxin, alfa-actinin, Ena, alfa-Spectrin, HIC5 (TGFB1I1), F-actin and ACTL-7A.
GATA 6
5
Protein module-based interactomics shows: LMCD1 shares interaction
partners with testin, but also has distinct binding partners
In the research group of the supervisors the putative interaction partners for testin and LMCD1 were recently investigated using AP-MS (affinity purification mass spectrometry).
AP-MS delivers long lists of putative partner proteins of which a subset is known to be false positive or aspecific. The complexomes were obtained using the proteomics-based approach iMixPro AP-MS (“intelligent Mixing of Proteomes”–affinity purification–mass spectrometry) using affinity purified material from cell cultures that were isotope labelled using “Stable Isotope Labelling with Amino acids in Cell culture” (SILAC). iMixPro uses the mixed SILAC proteomes of a culture of cells expressing a control (in casu GFP labelled with light isotope), four cultures expressing the bait (in casu GFP-LMCD1 and GFP-TES variant) of which three are labelled with light and one with heavy isotopes. Upon mixing all the lysate of all cultures the resulting light/heavy isotope ratios of the identified peptides and proteins should allow to discriminate peptides from ‘specific’ partners from those of aspecifically associated proteins19
In reality, this is less obvious and additional measures need to be taken to distinguish specific from aspecific proteins (see also results).
As shown in Figure 3 the bait for these affinity purifications was either GFP-tagged full length (FL LMCD1 and testin) or various GFP-tagged variants (or modules): CR, PET and LIM1-2 for LMCD1 and CR, NT, PET, LIM1-3 and deltaPET for TES. TES-CR was analysed together with LMCD1 (Master thesis Van Himst A,11). Since the list of specific interaction partners that were
identified included direct as well as indirect interaction partners and were part of larger complexes of which LMCD1 and TES are one component, we refer to ‘complexomes’ instead of ‘interactomes’. Using the modules ensured we also identified domain specific partners that may not be permanently accessible in the FL protein and/or are domain specific.
This modular approach proved successful. Figure 3 demonstrates that the strategy to analyse not only full length but also the modules contributes to the number of identified complexome partners. No less than 105 and 197 new proteins were picked up for TES and LMCD1, respectively, that would have been missed otherwise. These findings support the hypothesis that LMCD1, similar as testin, may exist in different conformational states as well. Ultimately data filtering and initial analysis led to the identification of 390 potentially new members of LMCD1 domain-dependent complexomes (Figure 3). In comparison, the same approach led to the expansion of the testin complexome with 227 new proteins. Compared to the
data-Figure 3 Strategy and outcome of the interactomics study of testin (TES) and LMCD1.
Modules are coloured as followed: CR - blue, PET - red, 3 or 2 LIM domains - yellow. Full length (FL) and modules (NT, ∆PET, PET, 3LIM, CR (not shown) for testin and NT, PET, 2LIM for LMCD1) were used as ‘bait’ in affinity purification (AP) and the composition of the resulting complexomes was determined by mass spectrometry (MS).
The number of hits in the module
Figure 2 (left) Subcellular location in HeLa cells of GFP-fusions of testin and LMCD1 full length (FL), N-terminal (CR+PET domain) and C-N-terminal (3 or 2 LIM domains) halves. Note that testin NT is enriched at stress fibres (SF) and Tes-3LIM at focal adhesion (FA), whereas this is not the case for LMCD1 protein halves. If in testin the PET domain is deleted, the resulting protein TES∆PET (see §2.2) localizes to both FA and SF (not shown). (right) Current model for the conformational states of testin. Each state presents its domains in different ways to partner proteins. Adapted from Master thesis Van Himst A. and 10,11.
6 output for LMCD1 and testin CR that were generated at a later time point, using a different mass spectrometer and with a higher coverage, the data-output for testin was smaller. In addition the analysis of the specific complexomes showed that there is a variation in the level of overlap between the complexomes of one protein (Figure 4A). The level of overlap was quantified by calculating the pairwise similarity factor (SF) using the formula in Figure 4B (Master thesis Van Himst A. and 11). Figure 4 shows that for testin the complexomes of the
PET and LIM1-3 pair are most similar followed by the FL and ∆PET pair and the ∆PET and NT pair11. Note that ∆PET contains the CR domain and the 3LIM domains. For LMCD1 the FL
and CR pair are most similar as well as the PET and LIM1-2 pair, followed by the CR and PET domain pair.
Before the interactome study described above, most of the binding partners that were known for TES were related to the actin cytoskeleton. The expansion of the complexome by Sala and coworkers and subsequent pathway analysis confirms the connection to the cytoskeleton (actin and tubulin) but also points to a role in cell-cell junction signalling pathways, in glucocorticoid receptor pathways and in cellular metabolic and immune signalling11. The newly
identified interactions with transforming growth factor β1-induced1 (TGFβ1I1, ARA55 or HIC-5) and with a low abundant isoform of the glucocorticoid nuclear receptor (GR) were functionally validated.
Interestingly, the linkage of TES FL, NT and deltaPET with the canonical cell-cell junction pathways can be traced back to alpha and beta tubulin isoforms, whereas the linkage of TES PET and LIM1-3 to these same pathways depends on actin cytoskeleton associated proteins. Many new putative interactions of testin to cytoskeletal proteins or complexes containing these cytoskeletal proteins may help to explain how testin contributes to cell migration, cell adhesion and cell growth (which involves actin and tubulin dependent cell division) and why cancer cells have a benefit to downregulate this protein.
LMCD1 TES
A. B.
Figure 4 Similarities between complexomes of TES (upper) and LMCD1 (under). A Number of shared specifically associated proteins identified for the TES and LMCD1 variants (SX ∩ SY). B Pairwise similarity factor (SF) for different TES and LMCD1 variants. Highly and moderately similar combinations are shown in dark and light grey, respectively.
7 As stated above, 390 potential complexome partners were identified for LMCD1. These complexome partners were used for pathways analysis. This resulted in new cellular pathways and functions in which LMCD1 and its interaction partners are implicated. The top 5 pathways are shown in Figure 5. Amongst others, LMCD1 FL and CR complexomes contain players in tRNA charging and in vesicle transport signalling (Master thesis Van Himst A.). Important to keep in mind is that the enrichment doesn’t necessarily imply an active role of the bait protein (in casu LMCD1) in the pathway nor does it immediately shed light on the nature of the interaction of the bait protein with pathway components.
Figure 5 Enriched pathways for LMCD1 domains and testin CR by Ingenuity Pathway Analysis. Upper panel: 5 most significantly enriched canonical pathways for the LMCD1 FL and their corresponding enrichment for the other LMCD1 variants. Lower panel: idem for testin CR domain (1) and the LMCD1 CR domain (2) that were tested in parallel. Dark to light purple squares indicate a high to low enrichment of the pathway for the indicated bait, i.e. a high to low significance of the number of genes encoding proteins identified in relation to the number of genes that define the pathway in IPA.
Figure 6 Functional networks composed of 25 high ranked canonical pathways (IPA analysis) linked with at least 2 common genes are shown for LMCD1 modules FL, CR, PET and LIM1-2 and TES CR. Colours indicate six major functional networks. Selected genes that are relevant members of a certain functional group or that are responsible for the connection or overlap between different pathway groups are shown. Figure adapted from Masterthesis Van Himst A.
8 Taking into account the 25 enriched canonical pathways connected by minimally 2 genes and the tRNA charging pathways (which is not connected but ranks high) allowed to compare the LMCD1 complexomes and TES CR complexome (Master thesis Van Himst A.). Next to tRNA charging, major networks can be distinguished i.e. cytoskeleton~tubulin, cytoskeleton~actin, proteasome-related functions, ribosomal proteins and vesicle formation transport.
As shown in Figure 6, all modules of LMCD1 seem to be ‘interacting’ with the tubulin and the actin cytoskeleton. These networks are for different complexomes represented by - in part - different partners. Whereas known focal adhesions proteins are more associated with LMCD1 PET (and surprisingly less with LMCD1 LIM1-2), FL and CR are more associated with actin regulators or actin proteins that have a crucial role in cortical actin formation. Vesicle formation and transport is represented for LMCD1 CR and PET and TES-CR. tRNA-charging uniquely for LMCD1 FL and CR but not for TES-CR. Finally, a role for LMCD1 and TES within the proteasome activity or signalling, potentially in stress-related functions or disturbance of protein homeostasis, is suggested.
This project aims to further investigate the complexomes of LMCD1 and testin and to increase the insight into differences and similarities between both proteins.
Testin contains a nuclear location and a nuclear export signal (Vaccaroli et
al., submitted)
In addition to its localisation at focal adhesions and actin stress fibers, testin has also been reported in the nucleus14. Its molecular weight of ~48 kDa suggests that passive nuclear
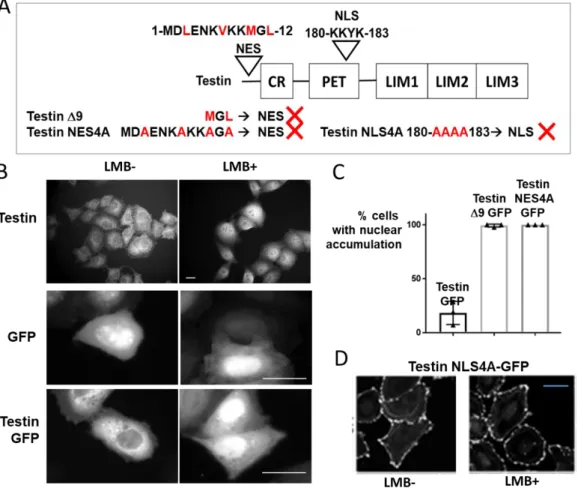
transport through the nuclear pore complex, with a cut-off limit of 40-60 kDa, is possible. However, recent unpublished findings by Vaccaroli et al. evidence that testin is actively translocating between the nuclear and cytoplasmic compartment and contains a nuclear export (NES) at its N-terminus and a nuclear localisation signal (NLS) in the PET domain (PhD thesis Raffaella Vaccaroli, 2017, University of Luxembourg and Vaccaroli R, submitted) (Figure 7).
As shown in Figure 7B HeLa cells show nuclear accumulation of both endogenous and GFP-tagged testin upon treatment with the Streptomycin cytotoxin Leptomycin B (LMB) (Vaccaroli R, submitted). LMB is an inhibitor of CRM1-mediated (chromosome region maintenance 1, also known as Exportin 1 or Xpo1) nuclear export. This suggests that the nuclear export of testin is actively regulated and depends on CRM1.
Based on the fact that even in the absence of LMB the GFP-tagged testin Δ9 variant (see table 1 no11 and Figure 2) displays nearly complete nuclear accumulation in HeLa cells
compared to the low nuclear presence of the GFP-tagged full length testin indicates that information for nuclear export is contained in the N-terminal region of testin (Figure 7C). Amino acids 3-12 harbour hydrophobic amino acids that in combination resemble a Nuclear Export Signal (NES) consensus sequence (Figure 7A). Mutation of these residues to alanine, resulting in the mutant testin-4ANES, confirmed that these residues are essential for nuclear accumulation, since these mutations resulted in a redistribution from the cytoplasm to the nucleus (Figure 7A,C).
Vaccaroli et al. similarly identified a nuclear localisation signal (NLS) 180-KKYK-183 in the PET domain of testin based on sequence homology with the known consenus sequence for NLS and with the use of deletion and substitution mutants of testin (Figure 7A). They convincingly demonstrated the function of the NLS by showing that the mutant of testin GFP, in which the residues 180-183 were substituted by alanine (testin-4ANLS-GFP), is excluded from the nucleus, also upon treatment with LMB (Figure 7A,D) (Vaccaroli R, submitted). The importin(s) involved in importing testin into the nucleus has not yet been identified.
Altogether these findings support the hypothesis that testin harbours a functional NES and a functional NLS and that the nuclear import and export of testin is an active process with the latter depending on the exportin CRM1.
9 The nuclear-cytoplasmic distribution of the testin ortholog LMCD1 will be further analysed in this project and Testin and the Tes mutants described here will be a useful tool in this investigation.
Figure 7 Regulation of the nuclear-cytoplasmic transport of testin by NES and NLS sites. A Overview of the mutant testin NES/NLS constructs. The original, functional NES/NLS sequence is shown on top of the domain structure of testin. In the mutant constructs substituted amino acids are indicated in red and the red cross indicates that the NES and NLS sites are disrupted. B Confocal Images of endogenous testin in parental HeLA cells (top) or HeLa cells expressing testin GFP (bottom). Untreated (-LMB) or treated (+LMB, blocks nuclear export). Note nuclear accumulation upon treatment. GFP expressing cells (middle) are used as control. Scale bar 20 µm. C Quantification of the nuclear accumulation of the GFP constructs (Tes GFP, Tes Δ9 GFP and Tes NES 4A GFP). Triangles illustrate the average percentage of each experiment and error bars indicate s.e.m. D Subcellular localisation of the GFP-tagged testin NLS4A mutant. Untreated (-LMB) or treated (+LMB ). Note exclusion from the nucleus, both in -LMB and +LMB conditions. Scale bar 20 µm. Adapted from Vaccaroli R, submitted.
A primer on the aminoacyl synthetase complex and tRNA charging
Since the pathway ‘tRNA charging’ is strongly enriched in the LMCD1 complexome as described in §2.2 and will be further addressed in this work (see results), we here introduce this cell function.
Aminoacyl-tRNA synthetases (AARS) are a family of 20 enzymes, one for each amino acid, responsible for interpreting the genetic code and pairing a specific amino acid to its cognate tRNA20. Nine synthetases specific for the amino acids Arg, Asp, Gln, Glu, Ile, Leu, Lys, Met
and Pro, together with three structural auxiliary proteins p43, p38 and p18 (AIMP1, AIMP2 and AIMP3 respectively) associate into the multi-aminoacyl-tRNA synthetase complex (MSC) (Figure 8).
10
Figure 8 (left) Composition of the multi-aminoacyl-tRNA synthetase complex (MSC). (right) Process of tRNA charging requires ATP. The charged tRNA is captured by the Elongation Factor1alpha-GFP-complex and delivered to the ribosome. Adapted from 21,22.
The MSC is proposed to provide a ‘channel’ through which tRNAs reach bound aminoacyl-tRNA synthetases to receive their cognate amino acid and transit further to the translation machinery23. The channelling model for translation is supported by the observation that
Arg-tRNA generated by the synthetase complex is a more efficient precursor for protein synthesis than Arg-tRNA generated by free ArgRS thus suggesting that the Arg-tRNAs generated by the two forms of ArgRS do not mix24. Aminoacyl-tRNAs are proposed to be transferred from ARSs
to ribosomes as ternary complexes of EF-1α, GTP and aminoacyl-tRNA21. The GDP-bound
form of EF-1α could be involved in the capture of deacylated tRNA at the exit site of ribosomes and its ‘re’delivery to AARSs.
The organisation of the AARS components at the periphery of the MSC allows concomitant functioning of all the synthetase components of the complex in the tRNA aminoacyl reaction, to accomplish their primary and essential translation function20. In addition, the non-compact
and probably flexible shape of the MSC attributes to the dissociation of several components of the complex to fulfil non-translational functions. The fine-tuning between the translational and non-translational functions requires a tight control of the AARS’ spatio-temporal organization. Also non-MSC AARS are described to have multiple functions.
Interestingly, multiple MSC components are suggested to be functionally involved in the pathophysiology of tumorigenesis23. AIMPs show tumour suppressive activities through
unique mechanisms. For instance, secreted AIMP1 stimulates immune responses and suppresses tumour vascularization. The C-domain of AIMP1 can be released from the MSC after cleavage and has been identified as the endothelial-monocyte-activating polypeptide II (EMAP II), a tumour-derived inflammatory cytokine25. Accordingly, systemic administration of
AIMP1 is shown to exert a potent tumour-suppressive activity23. AIMP2 may function as a
tumour suppressor through its interaction with TGF-β, TNFα, Wnt and p53 pathways. Moreover, cancer cells produce a splicing variant of AIMP2 lacking exon 2 without tumour suppressor activities. Finally, deletion of AIMP3 in embryonic or adult stages induces severe and lethal DNA damage, suggesting a vital function in maintaining the integrity of cellular DNA. Specific aminoacyl-tRNA synthetases in the complex appear to control cancer-associated pathways as well23. For instance, LRS promotes cellular protein synthesis and proliferation
upon leucine treatment through stimulation of mTOR activity. KRS enhances cancer metastasis by augmenting laminin-dependent cell migration at the cell membrane. Additionally the protein is secreted by cancer cells to attract immune cells. The role of aminoacyl-tRNA synthetases in cancer-associated pathways is further illustrated by MRS, which stimulates rRNA synthesis upon growth signals and binds and stabilizes CDK4 to promote the cell cycle. QRS can play a role in the regulation of apoptosis and EPRS can repress VEGF-A synthesis at the translational level. Interestingly, aminoacyl-tRNA synthetases and AIMP expression levels seem to significantly affect survival of cancer patients, although the relationship varies depending on the type of aminoacyl-tRNA synthetase or AIMP and cancer.
11
A primer on selected protein complexes involved in endocytosis signalling
and COPI/II coated vesicles in secretion
Since the pathway caveolae mediated endocytotic signalling is strongly enriched in the LMCD1 complexome as described in §2.2 and this pathway will be further addressed in this work (see results), we here introduce this cell function.
Endocytosis involves the de novo production of internal membranes from the plasma membrane lipid bilayer and the internalisation of plasma membrane lipids, integral proteins and extracellular fluid into the cell26. Control of endocytosis from and exocytosis to the plasma
membrane allows a precise regulation of the interactions between the cell and its environment. Based on the reliance of endocytosis pathways on certain proteins and lipids and on their differential abilities to internalise particular cargos, endocytosis has been further dissected into distinct pathways. These distinct pathways involve vesicles with characteristic lumina and surfaces to allow the differential delivery of cargoes to distinct intracellular destinations. Herein vesicle coat proteins, such as clathrin and the coat protein complexes II and I (COPII and COPI) are crucial for vesicle formation and the selection of protein and lipid cargo to be packaged within them27.
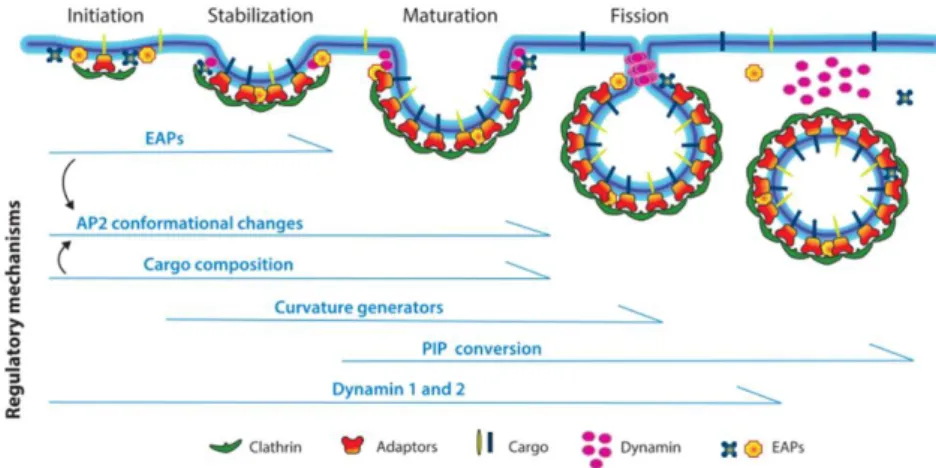
Clathrin-mediated endocytosis is an important endocytic mechanism, accounting for a large proportion of endocytic events26. The four stages of Clathrin-mediated endocytosis; initiation,
stabilisation, maturation and membrane fission are displayed on Figure 928. Initiation and
stabilization of the clathrin-coated pit largely depend on the adaptor protein AP2 as it binds PI4,5P2 and on endocytic sorting motifs on cargo. This triggers clathrin assembly and recruits
endocytic accessory proteins (EAPs). Clathrin polymerizes into curved lattices and the GTPase dynamin is recruited at low levels to the nascent clathrin coated pits and plays a crucial role in the regulation of their initiation and maturation as well28. During the subsequent
maturation of the pits different goals have to be achieved including cargo loading, curvature generation and phosphatidyl phosphate (PIP) conversion (from PI4,5P2-enriched composition of the plasma membrane to PI3P-enriched composition of early endosome). Afterwards, the GTPase dynamin polymerizes around the necks of the invaginated clathrin-coated pits and catalyses membrane fission. This process is aided by the polymerisation of clathrin as it helps to bring the membranes surrounding the neck into close proximity26. Finally, the
clathrin-coated vesicle is released into the interior of the cell and unclathrin-coated to form a naked vesicle. The naked vesicles undergo further trafficking, multiple fusion events and ultimately the cargo is delivered to early endosomes28.
F-actin is known to accumulate immediately prior to or shortly after vesicle scission and a role of F-actin is suggested in the invagination (by providing mechanical force) or post-scission (by aiding in the propulsion of the vesicle away from the plasma membrane). Finally, the interaction of Dynamin with the actin-binding protein Cortactin and with the RhoGEF Intersectin that can induce activation of Cdc42 seem to have a relevance for CME as well29.
Figure 9 The four stages of clathrin-mediated endocytosis (CME) and the regulation by multiple factors at each stage. Abbreviations: AP2, adaptor protein-2; EAPs, endocytic accessory proteins; PIP, phosphatidyl-inositol phosphate. Modified from Mettlen M.28.
12 A cellular alternative for clathrin-dependent endocytosis is the formation of caveolin-coated buds26. Caveolin-coated buds consist primarily of caveolins and cavins, particularly
caveolin-1 (CAVcaveolin-1) and cavincaveolin-1/PTRF30. Cavin proteins form hetero-oligomeric complexes in the cytosol
and associate with CAV1-enriched domains at the plasma membrane to generate metastable caveolae structures. Caveolae either bud from the plasma membrane in a process dependent on amongst others dynamin and F-actin and fuse with the early endosome (cycling pathway) or disassemble in response to an increased plasma membrane tension. In the latter, caveolar flattening aids to maintain plasma membrane integrity in response to physical challenges. Figure 10 illustrates these proteins associated with caveolin coated buts including the actin binding proteins filamin in direct association with Cav1.
Figure 10 The proteins associated with or involved in budding of a caveolae coated bud. (see text for details). EDH2 is a dynamin- like protein. Modified from 31.
The IPA canonical pathway caveolae-mediated endocytosis signalling still contains a caveosome with COPI-coatomer complex. Existence of caveosomes is, however, no longer accepted32. However, different proteins associated with the coatomer protein complex I and II
(COPI and COPII) are present on vesicles that ensure bidirectional transport at the endoplasmic reticulum (ER)-Golgi interface. COPII-coated vesicles on the one hand are involved in the anterograde ER-to-Golgi transport of newly synthesized secretory proteins and proteins destined for organelles other than the ER33 as shown in Figure 11. On their way to
the Golgi apparatus, COPII-coated vesicles fuse together to form the pleiomorphic ER-Golgi intermediate compartment (ERGIC)34. Ultimately, the ERGIC membranes move to the Golgi
and release their contents for onward transport. COPI vesicles on the other hand mediate the retrograde transport of ‘escaped ER residents’ and the recycling of anterograde cargo receptors from the ERGIC and cis-Golgi cisternae towards the ER, as well as in intra-Golgi transport (Figure 11).
13
Figure 11 COPI and COPII vesicles mediate traffic in the early secretory pathway. (left) Retrograde and anterograde transport. (right) Structure and assembly of COPI and COPII-coats. Modified from Gomez-Navarro N34; see main text for details.
The biogenesis of COPII vesicles, shown on Figure 11, is initiated by the activation of the small GTPase Sar1 by the ER resident membrane protein Sec12 at the ER exit sites (ERES), i.e. discrete membrane domains of the ER coated with COPII vesicles, 33,34. Afterwards,
ER-bound Sar1 recruits the inner COPII coat subcomplex consisting of the Sec23/24 heterodimer through an interaction with Sec23. Together with cargo proteins recruited via the direct binding of Sec24 with their ER export signals or via receptor proteins that forge a connection between soluble secretory proteins contained within the ER lumen and Sec24, Sar1 and Sec23/24 assemble into pre-budding complexes. Finally, outer coat subcomplexes, comprising heterotetrameric Sec13/31 complexes are recruited onto pre-budding complexes via an interaction between Sar1-Sec23 and Sec31 thereby completing the two-layered COPII coat. The biogenesis of COPI vesicles occurs in two steps: activation and binding of proteins of the Arf family to membranes of the ERGIC or Golgi and en bloc recruitment of the heptameric coat complex coatomer comprising the subunits ɑ-, β-, β’-, γ-, δ-, ε-, and ζ-COP33. The en-bloc
mode of membrane recruitment of coatomer is unique for COPI coats as the membrane association of clathrin and COPII coats occurs in multiple steps27. Upon GTP-hydrolysis,
catalysed by ArfGAPs, COPI-coated vesicles are scissioned from membranes. Once the COPI coated vesicle is released from the donor compartment the presence of the coat, having successfully achieved membrane deformation, cargo-sorting and separation from the donor membrane, is no longer necessary27. The vesicle is uncoated allowing engagement and fusion
with the acceptor membrane.
MATERIALS AND METHODS
Cell culture, expression plasmids, transfection and fixation protocols
The epithelial cell line HeLa from a cervix carcinoma (HeLa ATCC®CCL-2TM, RRID:CVCL 0030) was grown in Dulbecco’s modified Eagle Medium (DMEM-GlutaMAX, Invitrogen) supplemented with 10 vol% fetal calf serum (HyClone) and the antibiotics penicillin-streptomycin (Invitrogen) at 37°C in an atmosphere supplemented with 5% CO2.
The plasmids that are used code for a GFP-fused testin variant (full-length (FL) or specific domain), a mCherry fused LMCD1 (full-length (FL) or specific domain) or a pCherry β-actin (Table 2). These plasmids were transfected in HeLa cells via calcium phosphate transfection following the standard procedure. To this purpose, 150.000 cells were seeded one day before transfection in 6-wells plates. For subsequent immunofluorescence, the cells were seeded on sterile glass coverslips (diameter 12 mm, thickness 0,17 mm) present in the wells. Cells were processed 24 or 48 hours after transfection, depending on the experiment.
14 When applicable, cells were incubated with 20 nM of LMB for 3 h at 37°C to block the CRM1-dependent nuclear active export.
HeLa cells were fixed and permeabilized in 4% PFA (paraformaldehyde, Merck), 0,1% triton X-100 in PBS (5 min., room temperature) followed by an extra fixation step (4% PFA in PBS during 10 min. at 37°C).
Table 2 Expression plasmids that were used in the thesis project.
Selection of antibodies
Primary antibodies were selected for the colocalization of LMCD1 and testin with COPI vesicles and the multi-aminoacyl-tRNA synthetase complex (MSC), but also with unbound aminoacyl-tRNA synthetases (AARS) and for the western blot analysis. These antibodies included anti-COPB, anti-EMAPII, anti-AIMP2 and anti-HRS and were used at a 1/100 dilution as specified in Table 3. For the visualisation of the primary antibodies in the colocalization experiments (immunofluorescence §3.4) Alexa Fluor 647-labeled anti-mouse and anti-rabbit antibodies (Invitrogen) were used as secondary antibodies at 1/200 dilutions. For western blot analysis IRdye-labeled anti-mouse and anti-rabbit antibodies (Westburg) were used at a 1/10.000 dilution.
Table 3 Specifications of the antibodies used for immunostaining and western blot analysis.
Preparation of cell extracts and western blot analysis
Whole cell extracts were prepared by detaching cells with trypsin/EDTA, collecting them by centrifugation at 1500 × g for 5 min and washing them twice PBS. Cellular lysis was performed in ice-cold lysis buffer (7M ureum, 2M thioureum, 1%Triton, freshly added 0,03 M DTT) and
Vector testin cDNA Tag Remark Source
pEGFP-N3 FL (Sala S, 2017)
FL ΔNES Deletion of 1-9 ULux. Vaccaroli et al. Submitted
FL NLS4A AAAA replaces 180-KKYK-183
pEGFP-C3 TES 3LIM N-terminal tag (Sala S, 2017)
Vector LMCD1 cDNA Tag Remark Source
pmCherry-N1 FL
pmCherry-C1 2LIM N-terminal tag Master thesis Locy Hanne 2015; Davy Waterschoot
pEGFP-N1 FL EGFP
Vector cDNA Tag Remark Source
pEGFP-N1 / EGPF Clontech
pCherry β-actin pCherry (Simiczyjew A, 2015)
EGFP
mCherry
Antibody DilutionCompany Catalogue
number Specifications EMAPII antibody (G-2) (AIMP1) 1/100 Santa Cruz technology
sc-271115 Mouse monoclonal IgG1 (kappa light chain) raised against amino acids 221-312 at the C-terminus of human EMAP II.
AIMP2 antibody 1/100
SIGMA-Aldrich
HPA019098Rabbit polyclonal
antibody.Validated in the Human Protein Atlas.
COPB Antibody (D-10) 1/100 Santa Cruz Technology
sc-393615 Mouse monoclonal IgG2b COPB antibody; antigen amino acids 2-19 at the N-terminus of rat COPB.
HRS antibody 1/100
SIGMA-Aldrich
HPA036539Rabbit polyclonal antibody. Validated in the Human Protein Atlas.
15 home-made Protease Inhibitor Cocktail). After 30 minutes on ice and sonication (2 mm tip, 40% amplitude, 2-2 pulse), the total cellular extract was isolated as supernatant after 10 min of centrifugation at 10 rpm at 4°C. Total protein concentrations were measured by colorimetry by the Bradford method using BSA as standard (Bio-rad).
Protein separation was performed by SDS-PAGE (SDS-Polyacrylamide-Gel-Electrophoresis 27 mA), followed by wet transfer of the proteins in the SDS-gel on a nitrocellulose membrane (pore size 0.45 μm, Hybond-C, Amersham Biosciences) for 2h at 45-55 V in blotting buffer (3g 25mM Tris, 11,2g 150mM glycine/litre). After blocking the membrane in a 1/1 mix of blocking buffer (Odyssey, Lycor) and PBS at room temperature, primary antibodies were incubated overnight at 4°C in a 1/1 mix of blocking buffer and PBS-Tween (PBS with 0.1% Tween-20). After three washes with PBS-Tween 0.1% the membrane was incubated for 45 minutes at room temperature with the secondary fluorescent antibodies (see §3.2). The membrane was washed multiple times with TBS-Tween 0.1% buffer, PBS and deionized water before detection of the signals using the Odyssey® Infrared imaging system (Licor-Westburg). The images were further processed in Image Studio software (LI-COR).
Microscopy and image analysis
For imaging a confocal microscopy (Olympus FV1000) with an UPlanSApo infinity corrected 60× objective (NA: 1.35, Olympus) and the Fluoview FV10-ASW software were used.
Pathway analysis using Ingenuity® Pathway Analysis
Ingenuity® pathway analysis (IPA, QIAGEN Inc., https://digitalinsights.qiagen.com/products-overview/discovery-insights-portfolio/analysis-and-visualization/qiagen-ipa/) was used to perform new analyses on the datasets generated by the iMixPro experiments on the protein level. A specific data set, where relevant a grey zone data set, and an aspecific dataset, based on different thresholds (see §4.1), were used as input for different analyses by IPA in parallel using the IPA default settings (default statistical Fisher exact test). The “canonical pathways” and their respective p-values of overlap were extracted and used for the interpretation of the data.
The above mentioned p-values of overlap demonstrate the probability of finding a certain amount of genes within the dataset associated with a pathway, e.g. the chance of finding 12 genes in the specific LMCD1 full length dataset associated with tRNA charging. The right tail fisher test determines the significance of the enrichment for a pathway in the dataset, i.e. whether the overlapping genes are the result of chance (null hypothesis) or not (reject null hypothesis). In order to make this decision the right tail fisher exact test takes into account the proportion of the reference set, the Ingenuity® Knowledge Base (IKB), that overlaps with the pathway.
Public dataset analysis
cBioPortal for Cancer Genomics (http://www.cbioportal.org/) is the open-access, open-source resource that was used to interrogate large-scale cancer genomics datasets from a curated set of non-redundant studies35,36. It was used to extract, visualise, analyse and download
specific genetic data, related to the testin and LMCD1 genes. More specifically, genetic alterations, i.e. mutations and copy-number alterations, in the TES and LMCD1 genes were analysed (see Digital Addendum S1). In total, 46697 samples from 44347 patients in 176 studies were searched.
For all of the identified genetic alterations the predicted functional impact on the structure and function of a protein according to Mutation Assessor (http://mutationassessor.org/r3/)37, SIFT
16 http://genetics.bwh.harvard.edu/pph2/)39 was retrieved and analysed. Mutation Assessor and
SIFT predict the functional impact of amino-acid substitutions based on the sequence homology and, in case of SIFT, based on physical properties of amino acids as well, whereas polyPhen-2 uses features comprising the sequence, phylogenetic and structural information characterizing the substitution.
For analysis of post translational modifications (PMTs), we used http://dbptm.mbc.nctu.edu.tw/index.php40. The data in this database can be accessed via
cBioPortal. In addition we used PhosphoSitePlus® (https://www.phosphosite.org/) which provides comprehensive information on phosphorylation, but also on other PMTs41.
Immunofluorescence
Cells were washed, fixed and permeabilized in a solution containing 4% PFA (paraformaldehyde, Merck) and 0.1% Triton X-100 in PBS for 5 min. at room temperature and in a second solution containing 4% PFA in PBS for 10 min. at 37°C. Cells were saturated by incubating them with a blocking buffer (10% BSA in PBS). Next, cells were either stained with antibodies or stained for F-actin. In the first case, cells were incubated with primary antibodies (1/100) overnight, washed three times for 5 minutes with PBS-Tween 0.1% and incubated with suitable secondary antibodies labelled with Alexa Fluor 647 for 45 minutes at room temperature. In the second case, cells were incubated with Phalloidin-Alexa Fluor 594 (Invitrogen, 1/200 in 1% BSA in PBS) for 1h and washed for 5 minutes. Cells were briefly dipped in 1µg/mL DAPI (4′,6-diamidino-2-phenylindole, Sigma) and washed in MQ. The cells were mounted onto slides using a DABCO-based mounting medium (13% (w/v) polyvinyl alcohol, 2.5% DABCO Sigma D-2522, 1,4-Diazabicyclo-[2.2.2]Octane, 33% glycerol). After immunofluorescence staining, fixed cells were analysed by confocal microscopy.
RESULTS
Specific versus aspecific protein in the LMCD1 complexomes: critical assessment of
the threshold setting
In the introduction the results of the interactomics studies for LMCD1 using LMCD1 domain modules as bait are presented (§2.2). The input for these analyses was a strongly filtered subset of the data that was obtained from the iMixPro approach using specific isotopic labelling strategies. The latter should in ideal cases results in a specific and aspecific subset of identified proteins when plotted based on light (L) over heavy (H) ratio (see 19 for details).
However the experimentally obtained distribution of L/H-values is much more complex and also variable for the complexomes of the different LMCD1 domains. As a consequence, choices were made to filter out as much aspecific proteins as possible.
An empirical, step-wise thresholding strategy was applied consisting of a deconvoluting distribution in hypothetical subpopulations, defining threshold 1 (T1) followed by threshold 2 (T2). By applying T2, the proteins not assigned to the aspecific subset were divided into a ‘~50% top’ and a ‘~50% bottom’ list. The ‘top’ subset was for each dataset considered as the new ‘specific’ interactor list and the ‘bottom’ subset as the ‘grey zone subset’ (Master thesis Van Himst A. 2018-2019). Note that the T2 threshold was chosen to make the filtering sufficiently stringent, i.e. better depleted from false positives. This eventually enabled to restructure the raw complexome data of each module into a set of aspecific interactors, a list of specific hits and a grey zone in between as illustrated in Figure 12.
17
Figure 12 Filtering strategy used to obtain specific (S), grey zone (G) and aspecific subsets in the LMCD1 complexome data sets (see dissertation Van Himst A.). The threshold T1 was defined by the one-sided 95% confidence interval (CI) on the major sub-distribution. For the T2: see main text.
The current division implies that there will be both false positives and false negatives in the grey zone subset. Since T2 was previously chosen fairly at random, we set out to evaluate its position and thus to analyse whether it might be useful to expand the specific subdata set with part of the grey zone. The LMCD1 FL data was used for this analysis. A comparative IPA analysison 11 lists of increasing size was performed. Starting from the specific interactor list of the LMCD1 FL dataset, 11 lists named S1 to S11 were created by stepwise addition of 10% of the proteins from the grey zone (i.e. 20 proteins). S1 is the specific set as defined by threshold 2 (T2), S2 is S1 + the 20 proteins from the grey zone (10%) with lowest log2 L/H ratio, S3 is S1 + 40 (20%) grey zone proteins, etc. The last list, S11, contains all the specific and grey zone subset proteins. The number of proteins in each list is indicated in Table 4. Using a similar method, this process was repeated by starting from the aspecific fraction and adding 10% fractions of grey zone proteins. The data sets AS1-AS11 thus have an increasingly lower log2L/H as lower limit. AS11 contains all the aspecific and grey zone subset proteins.
The IPA analysis on S1-S11 and AS1-AS11 results in a ranking of canonical pathways based on increasing -log2(p-value). The p-value reflects the probability that the overlap between the data set and the canonical pathway list is based on chance. The evolution of the p-values for canonical pathways normally ranked in the top 40 of the S1 or AS1 for S1-S11 and/or AS1-AS11, respectively is shown in addenda 1 and 2. Figure 13 show this only for a selection of pathways .
Table 4 Table 4 LMCD1 FL lists of proteins with increasing size for comparative IPA analysis.
18
Figure 13 Results of the comparative IPA analysis on proteins from the specific interactor list and grey zone subset. The 40 canonical pathways with the highest probability for the dataset S1 and the associated p-value for each dataset is shown. The colour code reflects from blue to red the –log2 (p-value) with the highest to the lowest value.
Figure 13 displays the enrichment for the 40 canonical pathways that are most significantly enriched for the specific dataset (S1) of LMCD1 (see also graphical representation in Addendum 1 for first 15 pathways). Both figures show that the enrichment remains relatively stable for most of the pathways with the addition of extra proteins from the grey zone subset. The changes in -log2(p-value) are mostly small and evolve in a steady manner form S1 to S11 as e.g. in the pathways tRNA charging, caveolar-mediated or clathrin-mediated endocytosis signalling which are further studied below (in bold in Figure 13). This suggests that a shift from threshold T2 towards T1 provides little benefit for these pathways although a few putative false negatives are present in the grey zone (see §4.2-§4.3).
There are three pathways for which the significance evolves differently. The enrichment of the pathways ‘mTOR signalling’, ‘EIF2 signalling’ and ‘regulation of EIF4 and p70S6K signalling’ increases strongly (7-14-fold) as more genes from the grey zone subset from LMCD1 FL are added (blue in Figure 13). For all three of these pathways the increased enrichment seems to be related to the addition of elongation factors and ribosomal proteins from the grey zone as shown in Table 5.
Figures A2 and A3 in Addendum 2 show the result of the inverse analysis, i.e. gradually expanding the AS-subset of LMCD1 FL with fractions of the grey zone subset. Again almost all pathways remain stable during this exercise. Surprisingly, the ‘EIF2 Signalling’, that previously gained significance in the specific datasets, gets a boost in significance in the aspecific datasets upon expansion (5,3 fold) due to the addition of the same elongation factors and, especially, ribosomal proteins abundantly present in the grey zone subset. We note that this pathway also ranked first in the original AS subset of LMCD1 FL (Figure A2 in Addendum 2) and had a high rank in the grey zone of LMCD1 CR (although this was not the case for the grey zones of LMCD1 PET and LIM) (data not shown, figure 13 in master thesis Van Himst A.). Since biologically speaking tRNA signalling is precedent of ribosomal events and physical contact between MSC and the ribosome is reported42, the presence of many ribosomal
Canonical Pathways S11 S10 S9 S8 S7 S6 S5 S4 S3 S2 S1
Protein Ubiquitination Pathway 17.052 17.426 17.184 16.000 16.731 17.479 16.292 16.118 15.921 16.863 15.699 tRNA Charging 11.884 12.034 12.318 11.148 9.994 10.263 10.567 10.896 11.235 11.624 12.054 Caveolar-mediated Endocytosis Signaling 6.357 6.474 6.696 5.898 6.123 6.353 6.612 6.894 7.186 7.522 7.895
Unfolded protein response 6.385 6.491 6.694 6.911 7.142 7.376 6.442 6.696 6.957 7.259 7.593 Regulation of eIF4 and p70S6K Signaling 44.634 42.350 40.569 37.381 37.055 29.686 26.622 23.594 15.598 12.790 5.965
Remodeling of Epithelial Adherens Junctions 5.595 5.700 5.898 6.110 6.336 5.502 5.732 4.909 5.131 5.388 5.673 EIF2 Signaling 71.464 66.364 51.952 41.020 34.441 26.803 24.239 21.697 14.691 12.303 5.398
NRF2-mediated Oxidative Stress Response 3.966 4.086 4.317 3.893 4.133 3.692 3.943 4.219 4.507 4.843 5.220
Epithelial Adherens Junction Signaling 5.634 5.774 6.042 6.329 6.638 6.089 6.417 5.880 6.216 6.606 5.140 mTOR Signaling 34.346 32.428 30.963 29.507 29.291 22.984 19.258 17.843 12.103 9.738 4.839
Germ Cell-Sertoli Cell Junction Signaling 4.383 4.506 4.743 4.280 4.527 4.047 4.304 3.832 4.091 4.393 4.731
BAG2 Signaling Pathway 4.074 4.144 4.278 4.420 4.572 4.726 4.901 5.090 4.094 4.280 4.485
Sertoli Cell-Sertoli Cell Junction Signaling 5.397 4.842 4.407 3.975 4.216 3.767 4.020 3.578 3.832 4.129 4.463
Breast Cancer Regulation by Stathmin1 2.626 2.719 2.897 3.089 3.298 2.892 3.108 3.347 3.597 3.889 4.218
14-3-3-mediated Signaling 7.429 7.587 7.890 8.213 5.788 5.184 4.598 4.861 4.257 4.534 3.936
Phagosome Maturation 2.954 3.043 2.592 2.155 2.299 2.448 2.619 2.806 3.003 3.233 3.491
Endoplasmic Reticulum Stress Pathway 2.284 2.319 2.387 2.458 2.535 2.613 2.700 2.795 2.893 3.006 3.131
Sirtuin Signaling Pathway 2.793 2.907 2.636 2.848 2.573 2.786 3.034 3.308 3.598 2.708 3.006
ILK Signaling 4.587 4.720 4.974 4.542 4.809 4.359 4.641 4.200 3.745 4.041 2.870
Thioredoxin Pathway 2.240 2.265 2.312 2.362 2.415 2.469 2.530 2.595 2.662 2.740 2.825
Gap Junction Signaling 1.686 1.753 1.884 2.027 2.182 1.815 1.970 2.143 2.325 2.539 2.781
Aldosterone Signaling in Epithelial Cells 6.242 5.617 5.116 4.620 4.871 4.357 3.150 2.678 2.206 2.394 2.606
Systemic Lupus Erythematosus Signaling 1.755 1.830 1.974 2.131 2.303 2.481 2.687 2.337 2.543 2.786 2.418
Huntington's Disease Signaling 1.293 1.354 1.472 1.602 1.745 1.894 2.068 2.260 1.916 2.118 2.347
Vitamin-C Transport 1.527 1.551 1.596 1.643 1.694 1.746 1.804 1.867 1.932 2.007 2.090
Acetyl-CoA Biosynthesis III (from Citrate) 1.768 1.781 1.805 1.831 1.858 1.886 1.916 1.950 1.984 2.023 2.066
Glucocorticoid Receptor Signaling 1.882 1.974 2.154 2.351 2.122 2.321 2.086 2.312 1.610 1.818 2.058
FAT10 Signaling Pathway 1.432 1.455 1.499 1.546 1.596 1.647 1.705 1.768 1.833 1.907 1.989
Actin Cytoskeleton Signaling 3.976 4.104 4.348 3.968 4.226 3.204 3.445 3.064 3.308 2.921 1.928
Granzyme A Signaling 3.489 3.538 3.630 3.727 3.831 3.937 4.056 4.185 2.957 1.818 1.900
Uridine-5'-phosphate Biosynthesis 1.471 1.484 1.508 1.533 1.560 1.587 1.618 1.651 1.685 1.724 1.767
Antiproliferative Role of TOB in T Cell Signaling 2.020 2.055 2.121 2.191 2.266 2.342 2.429 1.466 1.529 1.601 1.681
Axonal Guidance Signaling 1.129 1.206 1.361 1.236 1.403 1.265 1.448 1.658 1.885 1.744 1.602
Oxidized GTP and dGTP Detoxification 1.299 1.311 1.335 1.360 1.387 1.414 1.445 1.477 1.511 1.550 1.593 Clathrin-mediated Endocytosis Signaling 1.745 1.813 1.946 1.604 1.735 1.387 1.514 1.656 1.291 1.430 1.589
Renal Cell Carcinoma Signaling 0.807 0.833 0.885 0.940 1.001 1.063 1.134 1.213 1.296 1.392 1.500
Creatine-phosphate Biosynthesis 1.084 1.097 1.120 1.145 1.171 1.198 1.228 1.260 1.294 1.332 1.375
Antigen Presentation Pathway 1.544 1.577 1.639 1.706 1.777 1.039 1.092 1.149 1.209 1.278 1.355
eNOS Signaling 1.258 1.307 1.404 1.510 1.624 1.744 1.350 1.470 1.075 1.187 1.314
19 proteins in the grey zone subset of LMCD1 FL (and CR) may enforce the idea that LMCD1 via its CR domain could play a significant role in protein synthesis.
Table 5 Identified proteins in S1 (bold) and S11 (all) of the LMCD1 FL complexome (see text for details). Elongation factors and ribosomal proteins from the grey zone are highlighted in blue and pink, respectively.
Together the analysis on the specific and on the aspecific datasets shows that the division of the proteins using threshold T2 results in a relatively correct assignment of specific proteins with only a minimum of false negatives in the grey zone subset and that there are no indications that T2 should be shifted to higher L/H ratios. However, this analysis does indicate that proteins from the grey zone subset can be purposely picked up to support the role of a LMCD1 domain in a specific pathway, e.g. the additional AARS in the grey zone subset support the role of LMCD1 FL in the tRNA Charging system. This type of manual curation is addressed for specific pathways in §4.2 and §4.3. Second, the analysis of the grey zone suggests it may also be interesting to investigate LMCD1 in relation to translational events downstream of tRNA charging.
A functional link between LMCD1 and not testin in the multi-aminoacyl-tRNA
synthetase complex and tRNA Charging? New steps towards validation.
4.2.1 Curation of the complexome data: LMCD1 & Testin vs tRNA charging
Figure 5 demonstrated that based on an IPA analysis of the ‘top-specific’ data set the LMCD1 FL and CR complexomes are enriched for the canonical pathway ‘tRNA charging’, whereas this is not the case for the complexomes of LMCD1 PET and LIM-domains nor for TES-CR domain. §2.4 introduced that the pathway ‘tRNA charging’ involves the 20 aminoacyl-tRNA synthetases (AARS) of which nine are forming the multi-aminoacyl synthetase complex (MSC) in the cytosol and others are not associated with this complex.
As a next step towards the functional validation of the observed results and in light of the re-evaluation of the thresholding of the complexome data set (§4.1), we decided to manually curate the complexome data sets of LMCD1 taking into account not only the ‘top-specific’ but also the ‘grey zone’ subset (see §4.1). The analysis performed in §4.1 indeed justifies the usage of protein partners from the ‘grey zone subset’ to further evaluate the correlation of the LMCD1 protein to this specific pathway. The analysis will involve the different domain variants of LMCD1 and also the testin data sets from 11.
Prior to this, we first annotated the gene/protein list of the IPA tRNA-charging pathway from a functional perspective and further extended it based on a literature survey. For the extension we relied on https://reactome.org/PathwayBrowser/#/R-HSA-379724 where all IDs of the proteins can be accessed and associated information retrieved. As shown in Figure 14 the extended list was divided in four subgroups: components of the MSC, non-MSC cytosolic AARS, mitochondrially encoded AARS and additional proteins. Note that we collectively use the symbol XARS-2 for the mitochondrial AARS.
mTOR signalling CDC42,FAU,MAPK1,PPP2R1A,RPS11,RPS23,RPS25,RPS26,RPS27,RPS27L,EIF3A,EIF3B,EIF3C,EIF3D,EIF3F,EI F3G,EIF3I,EIF3J,EIF3L,EIF4B,EIF4G1,RPS10,RPS12,RPS13,RPS14,RPS15,RPS16,RPS17,RPS18,RPS19,RPS2,R PS20,RPS21,RPS24,RPS28,RPS3,RPS3A,RPS4X,RPS5,RPS6,RPS7,RPS8,RPS9,RPSA EIF2(elongation initation factor) signalling EIF2S1,EIF5B,FAU,HSPA5,MAPK1,RPS11,RPS23,RPS25,RPS26,RPS27,RPS27L,EIF2S2,EIF2S3,EIF3A,EIF3B,EI F3C,EIF3D,EIF3F,EIF3G,EIF3I,EIF3J,EIF3L,EIF4G1,HNRNPA1,PABPC1,RPL10A,RPL11,RPL12,RPL13,RPL13A,R PL17,RPL18,RPL21,RPL22,RPL23A,RPL24,RPL26,RPL28,RPL29,RPL31,RPL32,RPL34,RPL36,RPL37A,RPL38,RP L6,RPL8,RPL9,RPLP1,RPS10,RPS12,RPS13,RPS14,RPS15,RPS16,RPS17,RPS18,RPS19,RPS2,RPS20,RPS21,R PS24,RPS27,RPS28,RPS3,RPS3A,RPS4X,RPS5,RPS6,RPS7,RPS8,RPS9,RPSA regulation of EIF4 and p70S6K signaling EIF2S1,FAU,MAPK1,PPP2R1A,RPS11,RPS23,RPS25,RPS26,RPS27,RPS27L,EIF2S2,EIF2S3,EIF3A,EIF3B,EIF3C ,EIF3D,EIF3F,EIF3G,EIF3I,EIF3J,EIF3L,EIF4G1,ITGB1,PABPC1,RPS10,RPS12,RPS13,RPS14,RPS15,RPS16,RPS 17,RPS18,RPS19,RPS2,RPS20,RPS21,RPS24,RPS28,RPS3,RPS3A,RPS4X,RPS5,RPS6,RPS7,RPS8,RPS9,RPSA