ACCOUNTING FOR BIODIVERSITY: A CASE
STUDY FOR THE PALM OIL SECTOR
Maite Vanden Bulcke
Student number: 01410059Promotor: Prof. Dr. Ignace De Beelde
A dissertation submitted to Ghent University in partial fulfilment of the requirements for the degree of the Master Business Economics
I
Confidentiality clause
I declare that the content of this Master’s Dissertation may be consulted and/or reproduced, provided that the source is referenced.
II
Preamble
At the beginning of 2020, different measures were taken to diminish the further spread of the Covid-19 virus. All the information needed for this master dissertation could be found online, so the research was not affected by the Covid-19 virus. This preamble is drawn up in consultation between the student and the supervisor and is approved by both.
III
Foreword
In this master dissertation I explored the extent to which companies in the oil palm sector take accountability for their impact on biodiversity. The last decade, the use of palm oil has been under a lot of pressure as being unsustainable and one of the main causes of deforestation. Palm oil is present in an extensive range of products and some voices were raised to ban the use of palm oil. After reading a lot of information on this topic, I can conclude that I do not believe that banning palm oil would be a good solution. Instead, I believe we need to ensure to produce sustainable palm oil, in which certification and accountability can play a key role. Because of my curiosity and interest in this topic, I was highly motivated to investigate the scope of accounting for biodiversity in the palm oil sector and compare my findings with previous research. I have broadened my knowledge on this controversial product and I am confident that I developed a well substantiated opinion.
I would like to thank Professor Dr. De Beelde to give me the opportunity to investigate this subject. I appreciated the freedom he gave me in exploring this topic. Also, when necessary, he made time to provide me with useful feedback.
I also would like to thank my family and friends for all their support. It pleases me to have people around me who believe in me and let me chase my dreams.
IV
Abstract
In how far palm oil companies incorporate accounting for biodiversity has only been investigated to a limited extent. Nevertheless, the palm oil sector has with its business operations a direct impact on biodiversity. Production takes place in tropical areas, regions that are typically occupied by moist tropical forests which are particularly rich in biodiversity (IUCN, 2018). In this master dissertation the annual and sustainability reports of 53 listed companies active in the palm oil sector are analysed on biodiversity disclosure. Based on quantitative and qualitative analysis, the extent to which palm oil companies report and account for biodiversity-related information is investigated. From 2015 to 2019 an upward trend of sustainability and biodiversity reporting was noticeable. Nevertheless, in 2018, still 7 of the 53 analysed companies (13,2%) did not mention biodiversity at all. In general, large differences in disclosure on biodiversity were found. One quarter of the investigated companies indicated biodiversity as a key material issue and mentioned they were aware that their business formed a threat for biodiversity. However, the content of the biodiversity disclosures was rather limited, indicating that palm oil companies still have a long way to go to incorporate biodiversity into their accounts. To be able to account for their impact on biodiversity, palm oil companies will need to monitor and assess the status of species affected by their operations, assess the performance and costs of actions taken to conserve biodiversity and report this information transparently.
V
Samenvatting
In hoeverre palmoliebedrijven hun impact op biodiversiteit in rekening brengen is slechts in beperkte mate onderzocht. Desalniettemin heeft de palmoliesector door haar activiteiten een directe impact op biodiversiteit. Productie van palmolie gebeurt namelijk in tropische regio’s, die gekenmerkt worden door een hoge biodiversiteit (IUCN, 2018). Voor deze masterproef werden de jaar- en duurzaamheidsrapporten van 53 beursgenoteerde bedrijven actief in de palmoliesector geanalyseerd op de mate waarin ze informatie met betrekking tot biodiversiteit rapporteerden en dit gebaseerd op een kwantitatieve en een kwalitatieve analyse. Van 2015 tot 2019 werd een stijgende tendens in zowel duurzaamheids- als biodiversiteitsrapportering waargenomen. Echter vermelden in 2018 nog 7 van de 53 geanalyseerde bedrijven (13,2%) geen woord over biodiversiteit. Over het algemeen werden grote verschillen gevonden in rapportering tussen de onderzochte bedrijven. Eén vierde van de bedrijven gaf aan biodiversiteit als een materiële kwestie te zien en rapporteerde dat ze zich bewust waren dat hun activiteiten een bedreiging vormden voor biodiversiteit. Nochtans was de inhoud van de rapportering over biodiversiteit eerder beperkt. Dit geeft aan dat palmoliebedrijven nog een lange weg te gaan hebben om hun impact op biodiversiteit in rekening te brengen. In de toekomst zal meer gerapporteerd moeten worden over de status van de aanwezige soorten in de omgeving, de acties die ze ondernemen om biodiversiteit te beschermen en de resultaten en kosten van deze acties.
VI
Content
1
INTRODUCTION ... 1
2
LITERATURE REVIEW ... 2
2.1 Introduction... 2
2.2 Biodiversity: definition, importance and threats ... 2
2.2.1 What is biodiversity? ... 2
2.2.2 Importance of biodiversity ... 3
2.2.3 Threats to biodiversity ... 4
2.3 Accounting and biodiversity ... 5
2.3.1 Accounting as a tool to protect biodiversity ... 5
2.3.2 National biodiversity accounting ... 6
2.3.3 Biodiversity accounting in business ... 8
2.4 Organisations and approaches related to biodiversity accounting ... 11
2.4.1 International organisations focusing on biodiversity accounting ... 11
2.4.2 Practical tools for biodiversity accounting ... 12
2.5 Problems underlying accounting for biodiversity ... 15
2.5.1 Valuing biodiversity ... 15
2.5.2 Scientific uncertainty ... 15
2.5.3 Normative uncertainty ... 15
2.5.4 Impression management ... 16
2.6 An alternative for biodiversity accounting: extinction accounting ... 16
2.7 Biodiversity and the palm oil sector ... 16
2.7.2 Global palm oil use ... 17
2.7.3 Palm oil cultivation and the consequences for biodiversity ... 17
2.7.3 The importance of sustainability disclosure in the palm oil sector ... 18
3
OBJECTIVES ... 21
4
METHODS ... 22
4.1 Data collection ... 22
4.1.1 Annual and sustainability reports ... 22
4.1.2 Other company specific data ... 22
4.2 Analysis of the reports ... 23
4.2.1 Theme codes... 23
4.2.2 Quantitative analysis ... 25
VII
4.3 Data analysis ... 26
4.3.1 Processing of the company specific data ... 26
4.3.2 Quantitative data analysis ... 26
4.3.3 Qualitative data analysis ... 26
5
RESULTS ... 27
5.1 Description of the dataset ... 27
5.2 Quantitative biodiversity assessment ... 28
5.2.1 A first exploration of the dataset... 28
5.2.2 Ratios on quantitative biodiversity and sustainability reporting ... 29
5.3 Qualitative biodiversity assessment ... 30
5.3.1 Certification ... 30
5.3.2 Qualitative biodiversity disclosure ... 31
6
DISCUSSION ... 35
6.1 Reporting on biodiversity ... 35
6.2 Accounting for biodiversity ... 36
6.3 Possible explanations for limited biodiversity reporting and accounting ... 37
6.4 Other ways of biodiversity conservation commitment ... 38
7
CONCLUSION ... 40
8
STRENGTHS AND LIMITATIONS ... 42
9
REFERENCES ... X
10
APPENDIX ... XV
Appendix 1: Overview of the general information of the different companies ... XV Appendix 2: Data of the quantitative biodiversity analysis ... XIX Appendix 3: Data of the qualitative biodiversity analysis ... XXV
VIII
List of abbreviations
BAP Biodiversity Action Plan
BBOP Business and Biodiversity Offsets Programme CBD Convention on Biological Diversity
CISL Cambridge University for Sustainability Leadership
GDP Gross Domestic Product
GRI Global Reporting Initiative
HCV High Conservation Value
IPCC International Panel on Climate Change
IPM Integrated Pest Management
ISCC International Sustainability and Carbon Certification ISPO Indonesian Sustainable Palm Oil
IUCN International Union for Conservation of Nature MSPO Malaysian Sustainable Palm Oil
RSPO Roundtable on Sustainable Palm Oil
SAN Sustainable Agriculture Network
SDG Sustainable Development Goal
SEEA System of Environmental-Economic Accounting
SEEA-EEA System of Environmental-Economic Accounting Experimental Ecosystem
Accounting
SNA System of National Accounts
SPOTT Sustainability Policy Transparency Toolkit STAR Species Threat Abatement and Recovery
UN United Nations
UNEP-WCMC UN Environment Programme World Conservation Monitoring Centre WBCSD World Business Council for Sustainable Development
IX
List of tables and figures
Table 1: The relationships between business and biodiversity (Source: Cambridge Institute for
Sustainability Leadership, 2015) ... 8 Table 2: Threats and opportunities when producing (un)sustainable palm oil (Source: Spencer et al., 2019) ... 18 Table 3: Overview of the pre-determined themes, topics and their explanations (Based on Grabsch et al., 2012) ... 23 Table 4: Overview of the publication and content of annual and sustainability reports over the period 2015-2019 ... 28 Table 5: Quantitative reporting on biodiversity and sustainability for the years 2018 and 2019. For every year the minimum, mean and maximum over all the reports is given. ... 29 Table 6: Amount of companies certified with RSPO, MSPO, ISPO and ISCC certification in the years 2018 and 2019 ... 30 Table 7: Overview of the different biodiversity topics and how many companies discussed them in their annual and sustainability reports ... 31
Figure 1: Components of biodiversity: ecosystem diversity, species diversity and genetic diversity (Source: Houde, 2007) ... 3 Figure 2: Pyramid of hierarchical criticality to measure changes in biodiversity (Source: Jones, 1996) . 9 Figure 3: The mitigation hierarchy (Source: BBOP, 2018 (adapted from Rio Tinto & Govt of Australia)) ... 10 Figure 4: Biodiversity disclosure as percentage from the annual reports ... 29
1
1 Introduction
Through human activities extinction rates have become at least 100 times higher compared to natural extinction rates (Rawat & Agarwal, 2015). Among others, land use changes, overexploitation and climate change form huge threads for biodiversity. Concerns are raised regarding the consequences of biodiversity loss. In addition to its aesthetic value, biodiversity is important for ecosystem services, food security and the health of human populations. Conservation of biodiversity is more and more seen as a critical part of sustainability and companies receive increasing pressure to take measures to manage biodiversity. Especially companies working with natural resources - like palm oil plantations - have business operations which significantly and directly impact ecosystems and local biodiversity. Most researches on this topic have investigated general sustainability reporting and only a few studies focused on reporting and accounting for biodiversity. Especially in the palm oil sector, this subject is underexplored. However, palm oil has been under a lot of pressure by NGO’s for being unsustainable and is often seen as an important cause of deforestation and biodiversity loss. In this context, this master dissertation explores to which extent palm oil companies report on biodiversity and incorporate accounting for biodiversity.
A first objective is to determine the quantitative reporting on biodiversity. Do palm oil organisations report on biodiversity and how much attention do they give biodiversity in comparison with other sustainability issues? For the second research question more attention is given to the content of the biodiversity reporting. Is the disclosed information relevant and to which degree do palm oil companies account for their impact on biodiversity?
The master dissertation starts with a literature study in which an overview is given of the concept biodiversity, existing accounting methods and the relation between biodiversity and the palm oil sector. For the practical part, the annual and sustainability reports of companies in the palm oil sector were investigated to explore the extent to which they reported and accounted for biodiversity. The results of the study were compared with previous research in this field and the master dissertation is closed with a general conclusion and the discussion of its strengths and limitations.
2
2 Literature review
2.1 Introduction
Biodiversity conservation forms a huge challenge all around the world. Higher demand for resources, a more and more global community and changing climate conditions lead to high pressures on natural capital. As a response on the losses of biodiversity we face, questions raise how we can diminish negative effects on nature and protect biodiversity. In this master dissertation, the use and potential of accounting for biodiversity in the oil palm sector is investigated. The first chapters of the literature review handle a description of the definition and use of biodiversity, and some threats to biodiversity are discussed. In the next part the concept of accounting for biodiversity and existing initiatives supporting this are explored. Also attention is given to some problems faced by biodiversity accounting and an alternative method is presented. The literature review finishes with an analysis of the palm oil sector, in which the effects of oil palm cultivation on biodiversity and the existing certification systems in the sector are discussed.
2.2 Biodiversity: definition, importance and threats
2.2.1 What is biodiversity?
Different definitions of biodiversity exist, often re-defined according to the purpose and context of the author (Swingland, 2001). Some authors discuss that biodiversity should not include abiotic components and processes, as this aspect does not meet the biological part of the definition. However, ecological processes are crucial to maintaining biodiversity (Swingland, 2001).
The definition presented below is the definition of biological diversity adopted by the Convention on Biological Diversity (CBD), a multilateral treaty established by the united nations.
"Biological diversity means the variability among living organisms from all sources including, inter alia, terrestrial, marine and other aquatic ecosystems and the ecological complexes of which they are
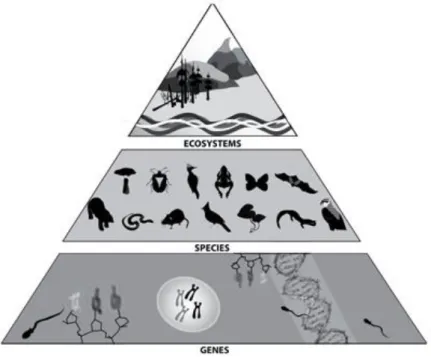
part; this includes diversity within species, between species and of ecosystems.” (CBD, 1992) This definition divides biodiversity into three parts: genetic diversity, species diversity and ecosystem diversity (Figure 1). Genetic diversity includes the variation of genes within species and populations (Rawat & Agarwal, 2015). It can change from generation to generation as a result of natural selection and mutations (Swingland, 2001). Species diversity is defined as the variety of species. It can be
3
measured as species richness or species abundance, respectively the total and the relative number of species in a defined area (Rawat & Agarwal, 2015). Ecosystem diversity includes the variety of communities, habitats and ecological processes in the biosphere (Rawat & Agarwal, 2015).
Figure 1: Components of biodiversity: ecosystem diversity, species diversity and genetic diversity
(Source: Houde, 2007)
2.2.2 Importance of biodiversity
Biodiversity delivers benefits in several areas. In the next paragraphs the importance of biodiversity and different values which can be attributed to it are discussed.
2.2.2.1 Utilitarian benefits
Biodiversity contributes to the well-being of the human population, by the provision of among other things medicines, food and industrial raw materials (Rawat & Agarwal, 2015). For thousands of years, plants have formed the basis of traditional medicine systems. Today not only plants, but also microorganisms, vertebrates and invertebrates, are examined as sources for new medicines (Chivian, 2002). An example is the discovery of antibiotics, produced by microorganisms, and now used over the whole world to treat infections. Also our production of food is based on a rich biodiversity. Breeders have been using and are still using biodiversity to improve crops. In this way, biodiversity contributes to the productivity of crops, the improvement of the nutritional value of food and the resilience in farming systems (Thrupp, 2000).
2.2.2.2 Ecosystem services
Ecosystems are defined as the dynamic complexes of living organisms and their non-living environment interacting as a system (CBD, 1992). Ecosystem services are activities or functions of the ecosystem
4
that provide benefits to humans (Mace, Norris, & Fitter, 2012). Examples of services are purification of water and air, regulation of climate and decomposition of wastes (Chivian, 2002). In many cases, healthy ecosystems work on large scales and are very complex. Disruptions of ecosystems can have catastrophic results, as the complexity makes it impossible for humanity to substitute for them (Chivian, 2002).
2.2.2.3 Ethical and moral benefits
Every organism on earth is unique and has an inherent right to exist, regardless of its value to humans. In addition, current human generations have the social responsibility of the well-being of all future generations (Rawat & Agarwal, 2015).
2.2.2.4 Aesthetic value
Natural environments can have value for humankind, namely people can derive enjoyment of its presence (Rawat & Agarwal, 2015). This can range from cultural value, by example appreciation of wildlife, to educational, recreational and religious values (Mace et al., 2012).
2.2.3 Threats to biodiversity
Threats to biodiversity refer to processes or events that are likely to cause adverse effects on the sustainable use or the status of components of biodiversity (Rawat & Agarwal, 2015). Species extinction is something that occurs naturally, without the intervention of humans (Swingland, 2001). However, through human activities extinction rates have become at least 100 times higher compared to natural extinction rates (Rawat & Agarwal, 2015). In the next paragraphs, the most important drivers of biodiversity loss are listed.
2.2.3.1 Land-use changes and habitat loss
Habitat alteration and destruction is the main factor directly driving worldwide biodiversity losses (Rawat & Agarwal, 2015). Humans use technologies to modify their environment and make it habitable, while other species cannot do this. When a habitat is eliminated, it will kill the individuals living in the habitat. When the entire habitat is removed the species can become extinct unless they can adapt to another habitat. The destruction of habitats by humans has accelerated in the second part of the 20th century (Fisher, 2018), especially by the increased demand for resources leading to
land use changes (Mutia, 2009). Some examples of habitat destruction are the clearing of forests for agriculture, the construction of hydroelectric projects on rivers, mining, logging, urbanization and the construction of highways.
5 2.2.3.2 Overharvesting / overexploitation
Overharvesting is the result of a higher exploitation of individuals of a particular species than can be sustained by the natural reproductive capacity of its population (Mutia, 2009). It will lead to population decline and species extinction (Belgian National Focal Point to the Convention on Biological Diversity (ed.), 2013). Overharvesting often occurs with common resources. As exploiters do not own the exploitation site of the resources, they have a limited motivation to restrain their harvesting, also known as tragedy of the commons (Fisher, 2018). Overharvesting forms especially to aquatic species a serious threat (Fisher, 2018).
2.2.3.3 Climate change
Atmospheric greenhouse gas concentrations have increased since the start of the 20th century,
contributing to global warming. Examples of resulting climate changes are warming of land and ocean surface temperatures, changes in spatial and temporal precipitation patterns and the rising of sea water levels (IPCC, 2002). Most species have to deal with a narrow physiological limit. When climatic limits are exceeded, species can suffer extinction (Rawat & Agarwal, 2015). Climate change has already shown significant impacts on biodiversity and ecosystems, by affecting migration and species distribution, timing of reproduction and population sizes, length of the growing season and the frequency of pest and disease outbreaks (IPCC, 2002). By 2050 projected climate changes may lead to the extinction of species in certain regions, by the end of the century climate change may become the most important direct driver of overall biodiversity losses (Rawat & Agarwal, 2015).
2.2.3.4 Introduction of invasive species
Invasive species are non-native organisms who alter the present communities of an area (Fisher, 2018). They can threaten present communities by out competition, predation and disease transmission and in some situations they can lead to extinction (Rawat & Agarwal, 2015). The introduction of invasive species by humans can be intentionally or accidentally (Fisher, 2018).
2.3 Accounting and biodiversity
2.3.1 Accounting as a tool to protect biodiversity
National information systems supporting environmental policy have been largely ad hoc., generally relying on academic research institutions, seldom underpinned by long-term monitoring and with most policy agencies poorly supplied to use the information (Vardon, Keith, Obst, & Lindenmayer, 2019). As discussed in chapter 2.2.3, biodiversity faces many threats, however biodiversity conservation forms a major challenge for government and business.
6
Accounting is defined as “the process of recording financial transactions pertaining to a business” (Tuovila, 2020) and is a necessary part of business. Two important accounting types are managerial accounting and financial accounting (Stolowy & Yuan, 2017). A company’s managerial account plays a key role in its decision making process, however relationships with the environment are mostly not included in standard accounting practices meaning its role is often not considered when important decisions are made (Bolt et al., 2016). A better representation of biodiversity in accounts may clarify the inter-dependencies of the organisation with natural resources and lead to a better management (Bolt et al., 2016).
A company’s financial account is important for communication with stakeholders (Stolowy & Yuan, 2017). Stakeholders play a role in conserving biodiversity, as they can contribute to biodiversity initiatives and provide benefits for the company which the company would not achieve independently (Boiral & Heras-Saizarbitoria, 2017). Examples of contributions of stakeholders are the implementation of research programs, the creation of protected areas and the development of new standards and their certification (Boiral & Heras-Saizarbitoria, 2017).
2.3.2 National biodiversity accounting
The System of National Accounts (SNA) is an international standard system by the United Nations which provides an integrated, complete system of accounts to facilitate international comparison (United Nations, n.d.-a). The SNA is the source of the Gross Domestic Product (GDP) and is an important tool assisting management and planning (Vardon et al., 2019). However, it does not provide all the information required to determine whether current levels of economic activity can be sustained (UNEP-WCMC, 2015a). The System of Environmental-Economic Accounting (SEEA) follows a similar accounting structure as the SNA, but also integrates environmental data. It provides a more thorough and multiuse perspective of the interrelationship between the economy and the environment. The SEEA focuses on different thematic areas, examples are air emissions accounts, energy, and ecosystem accounts. The System of Environmental-Economic Accounting Experimental Ecosystem Accounting (SEEA-EEA) focuses on organizing biophysical data, measuring ecosystem services and tracking changes in ecosystem assets. While the SEEA central framework puts attention on individual environmental assets, the SEEA-EEA examines how individual environmental assets interact as part of natural processes (United Nations, n.d.-b). With traditional approaches mostly only the economic value of products or services derived from nature is captured. Ecosystem accounting on the other hand aims to assess quantitative measures to determine the condition of ecosystem assets and the development of service flows, which can help to improve the management of ecosystems and their services (European Union, 2016).
7
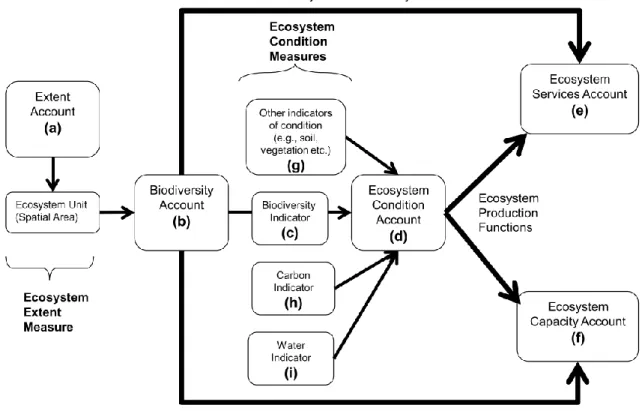
One component of the SEEA-EEA is Experimental Biodiversity Accounting. The SEEA-EEA considers ecosystems as assets, characterised on the basis of their extent, condition and capacity to provide ecosystem services. Figure presents the location of biodiversity accounts within the SEEA-EEA framework.
The Extent Account (a) is used for defining spatial boundaries of ecosystem units, based on similar ecosystem characteristics. Spatial units form the structural framework for the different accounts in the framework, once they are distinguished the biodiversity account can be determined. The biodiversity account (b) provides biodiversity measures based on a temporally and spatially structure. It contributes to the Ecosystem Condition Account (d), the Ecosystem Services Account (e) and the Ecosystem Capacity Account (f). The Ecosystem Condition Account includes data fundamental for the functioning, integrity and ability to produce ecosystem services of an ecosystem unit. The Ecosystem Services Account captures the ecosystem service flow from the ecosystem unit into the economy. The Ecosystem Capacity Account considers the capacity to deliver a sustainable service (UNEP-WCMC, 2015a).
Figure 2: Location of biodiversity and linkages with other accounts within the SEEA-EEA (Source: UNEP-WCMC, 2015)
Using the SEEA-EEA framework information on biodiversity is organized in a spatial format in accordance to other national statistical frameworks. This makes it possible to compare data on
8
biodiversity and ecosystem services with other economic data and understand the relationship between economic development and biodiversity (UNEP-WCMC, 2015b).
2.3.3 Biodiversity accounting in business
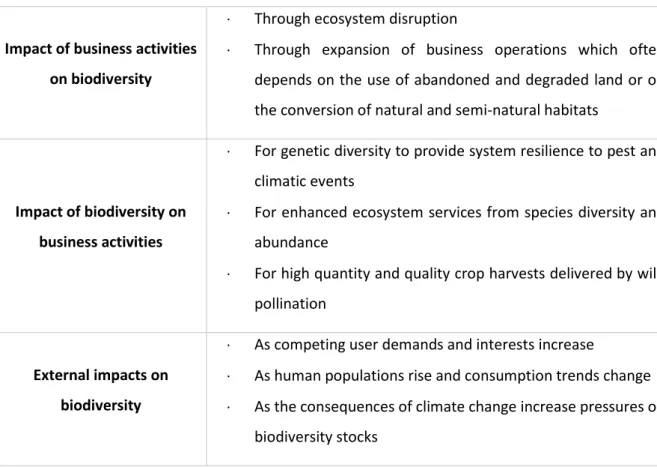
2.3.3.1 Importance of biodiversity for businessesIn businesses, biodiversity is historically considered from a reputational perspective, as an issue of corporate social responsibility, but not as an important part of a company’s performance. However, it is becoming more and more clear that loss of biodiversity can affect business operations (Bolt et al., 2016). The interrelationships between business and biodiversity, as represented by the Cambridge Institute for Sustainability Leadership, are given in Table 1.
Table 1: The relationships between business and biodiversity (Source: Cambridge Institute for Sustainability Leadership, 2015)
2.3.3.2 Recording and accounting for biodiversity
Before being able to analyse the effects of specific actions on biodiversity, the present biodiversity has to be known. Two opposing approaches are common to record biodiversity: the natural inventory approach of Jones (1996) and the ecosystem approach of Houdet (2008). The first approach is simple and objective, but focuses on species and not on ecosystems. The second approach deals more
Impact of business activities on biodiversity
Through ecosystem disruption
Through expansion of business operations which often depends on the use of abandoned and degraded land or on the conversion of natural and semi-natural habitats
Impact of biodiversity on business activities
For genetic diversity to provide system resilience to pest and climatic events
For enhanced ecosystem services from species diversity and abundance
For high quantity and quality crop harvests delivered by wild pollination
External impacts on biodiversity
As competing user demands and interests increase
As human populations rise and consumption trends change As the consequences of climate change increase pressures on
9
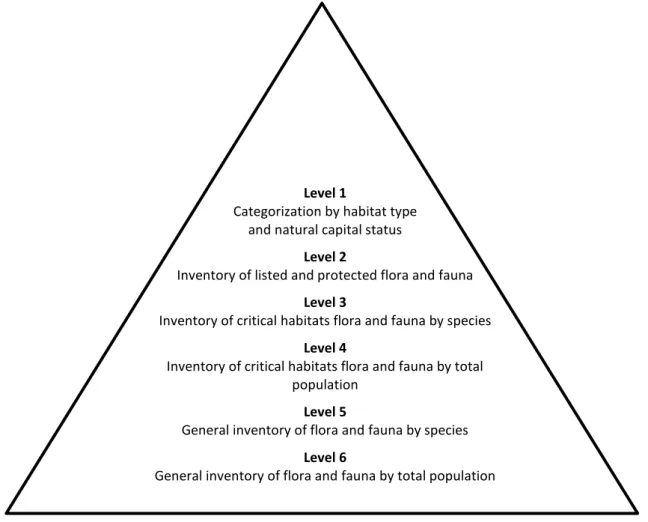
Level 1
Categorization by habitat type and natural capital status
Level 2
Inventory of listed and protected flora and fauna
Level 3
Inventory of critical habitats flora and fauna by species
Level 4
Inventory of critical habitats flora and fauna by total population
Level 5
General inventory of flora and fauna by species
Level 6
General inventory of flora and fauna by total population
holistically with biodiversity, but is subjective and more difficult to operationalise (Jones & Solomon, 2013).
Jones (1996) used a pyramid of hierarchical criticality to measure changes in biodiversity (Figure 2). The pyramid exists of six levels, moving from critical to non-critical natural capital and from species to population level. At the first level, the inventory is categorised by habitat type and natural capital status (e.g. is it a protected habitat?). The second level focuses on critical species by species and by total population and this on all habitat types, critical as well non-critical. Level three and four record flora and fauna on critical habitats by species respectively by total population. Level five focuses on a general inventory of flora and fauna by species and level six on a general inventory by total population.
Figure 2: Pyramid of hierarchical criticality to measure changes in biodiversity (Source: Jones, 1996)
Further, Jones (1996) added a simplified grading system. Habitats were classified with a grade of one (habitats with very great ecological worth) to five (habitats with very little ecological worth). Finally, a market or equity value would be placed on the habitats. Jones (1996) suggested that companies should produce an annual statement to disclose the results of the organisation’s natural inventory. By recording this information every year over time changes can be established and reported.
10
In contrast to the natural inventory approach, the ecosystem approach is more top-down deconstructing ecosystems and habitats (Jones & Solomon, 2013). Houdet, Trommetter, Pavageau, & Jacques (2009) broke their analysis for the ecosystem model into four complementary steps. In the first step biodiversity inputs to the company are assessed. Secondly ecosystem services and benefits for the company are determined. In a third step biodiversity and ecosystem services losses and gains are investigated. In the last step interactions between companies and other agents which result in changes of biodiversity and ecosystem services are determined. Houdet et al. (2009) argued that with this method it is possible for companies to quantify business practices and associated costs or revenues which lead to changes in biodiversity.
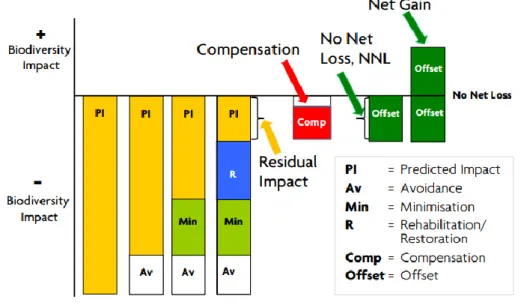
2.3.3.3 The mitigation strategy
More and more attention is given to natural capital and biodiversity, and businesses are expected to take responsibility for negative impacts and mitigate them. The mitigation strategy (Figure 3) is a tool developed to protect biodiversity when planning and implementing development projects (CSBI, 2015).
Figure 3: The mitigation hierarchy
(Source: BBOP, 2018 (adapted from Rio Tinto & Govt of Australia))
The mitigation strategy’s goal is to achieve no net loss, or even a net gain in biodiversity (BBOP, 2018). The strategy is made of a sequence which can be used to mitigate biodiversity loss. The first step in the sequence is to avoid any biodiversity loss. If biodiversity loss does occur, it is important to minimize the loss and to restore possible impacts. If after restoring there are still remaining losses, this can be compensated by offsetting through positive conservation actions in another place (CSBI, 2015).
11
2.4 Organisations and approaches related to biodiversity accounting
Biodiversity conservation is raising global concern, and many organisations are set up to offer tools to address this problem. In the next paragraphs a sample of organisations focusing on biodiversity reporting and some existing accounting approaches for business are presented.2.4.1 International organisations focusing on biodiversity accounting
2.4.1.1 Global Reporting Initiative (GRI) and the GRI standardsThe Global Reporting Initiative is an independent and international organization, established in 1997, which focuses on sustainable reporting. With their sustainability reporting standards they deliver a modular structure for reporting on a range of economic, environmental and social impacts (Global Reporting Initiative, n.d.). They consider four key elements in reporting on biodiversity: the relationship with biodiversity and ecosystem services, the perceived role and responsibilities of the company, the policy and management and the actual performance and results. In a first step, the relationship between the organization’s activities and biodiversity is established. This relationship is important to define the expectations of the company, the approaches to be implemented and the performance goals to be achieved. Secondly, the organization’s approach and performance are placed in the context of its perceived roles and responsibilities regarding conservation and sustainable use of biodiversity. For many stakeholders the CBD objectives will be key reference points. When the relationship with biodiversity and the organization’s role and responsibilities are identified, the specific policies and management approaches that are put in place can be reported. Important when reporting on actions is to do this as well forwards as backwards, meaning assessing new approaches but also assessing whether previous approaches were successful. The last step is to communicate the outcomes achieved. For doing so performance indicators are used, examples are indicators on inputs/outputs to the environment and on changes in biodiversity conditions (Global Reporting Initiative, 2007).
A critic on the GRI is that there is no generally accepted basis for defining, identifying and measuring changes in biodiversity (Mansoor & Maroun, 2016). Instead, principles are explained very broadly, which makes it difficult for organisations to apply them and can lead to the interpretation as a disclosure checklist rather than a framework for reducing biodiversity risks (Maroun & Atkins, 2018). 2.4.1.2 The Natural Capital Coalition and the Natural Capital Protocol
Together with the Social & Human Capital Coalition, the Natural Capital Coalition is part of the Capitals Coalition, a global collaboration covering more than 300 organizations and focusing on including value provided by society, people and nature in decision making (Natural Capital Coalition, n.d.). In 2016, the Natural Capital Protocol was presented, a decision making framework which enables organizations to
12
incorporate its influence and dependency on natural capital. The Protocol is not a formal reporting framework, but aims at improving internal decision making (Natural Capital Coalition, 2016b). However, one of the key challenges the Protocol still faces is how to incorporate biodiversity. To address this challenge, a project has been set up in collaboration with the Cambridge Conservation Initiative, a collaboration between the University of Cambridge and different conservation organisations. The goal is to develop robust and biodiversity-inclusive capital assessments (Natural Capital Coalition, 2016a).
2.4.1.3 The Business and Biodiversity Offsets Programme (BBOP)
The Business and Biodiversity Offsets Programme was established in 2004 by Forest Trends, a non-profit organisation focusing on incorporating nature conservation into economic activity (Forest Trends, n.d.). The BBOP brings different organisations together with as goal to offer a solution for the trade-off between economic and social benefits and nett biodiversity loss (BBOP, 2018). Its focus is on the mitigation strategy (no nett loss/net gain in biodiversity) and they have developed principles, standards and guidelines for companies and governments. In 2018, they published the ‘Roadmap for Governments’ and ‘Roadmap for Business’, accompanied by a resource paper demonstrating how corporations can prepare balance sheets in which biodiversity net gain is incorporated. For showing net biodiversity gain they make use of biodiversity metrics, but also additional benefits, by example improved air quality, are brought into account by using monetary value (BBOP, 2018).
2.4.1.4 The United Nations (UN) and the Sustainable Development Goals (SDG’s)
The SDG’s were developed in 2015 by the United Nations. With 17 SDG’s and setting targets for 2030, they aim to bring back sustainability in an economic, social and ecological perspective. Goal 15 is devoted to “protect, restore and promote sustainable use of terrestrial ecosystems, sustainably manage forests, combat desertification, and halt and reverse land degradation and halt biodiversity loss” (UN, n.d.). The SDG’s do not offer tools for biodiversity accounting, but can act as a driver for companies to conduct biodiversity conservation effort.
2.4.2 Practical tools for biodiversity accounting
Different tools have been developed to assist companies in their biodiversity journey. However, there are no generally accepted and applied methodologies for companies on how they can measure and value their impacts and dependencies on ecosystem services and biodiversity (Lammerant, Müller, & Kisielewicz, 2018). In the next paragraphs some methods will be discussed. The first approach relies on qualitative information, while the other approaches are based on quantitative indicators.
13 2.4.2.1 The Biodiversity Check
Companies can use the Biodiversity Check as an initial guide to determine their direct and indirect impacts on biodiversity. The check provides information on the relationship between the company and biodiversity, but also proposals for goals and measures to reduce risks and negative impacts, to protect biodiversity or to compensate for negative impacts (Global Nature Fund, Dokeo, Triple E, & FGN, n.d.). 2.4.2.2 The Global Biodiversity Score
The Global Biodiversity Score is a metric developed by the CDC Biodiversité and based on internationally recognised scientific research. It is transparent, easy to estimate and understandable by non-specialists. The assessment exists of two steps: the determination of pressures caused by specific economic activities on biodiversity, followed by the estimation of the impacts of these pressures on ecosystems. For linking the economic activities to environmental pressures an analysis of the business’s complete value chain is conducted. Two important, external tools are life cycle analysis and matrix-based input-output models. For the second step the GLOBIO model, based on pressure-impact relationships, can be used. The GLOBIO model is a tool which can be used to assess the pressure-impact of environmental drivers on biodiversity in the past, present and future (GLOBIO, n.d.).
The Global Biodiversity Score can be used for calculating the footprint of a financial asset portfolio, but also for corporate level assessments. It is still under development and some important drivers for biodiversity loss, like overexploitation, invasive species, chemical pollution and soil degradation, are not factored in yet. The first biodiversity footprint audits will be conducted in 2020 (Mission Economie de la Biodiversité & CDC Biodiversité, 2017).
2.4.2.3 The Biodiversity Impact Metric
The Biodiversity Impact Metric is an approach developed by a collaboration between the Cambridge Institute for Sustainability Leadership (CISL) and the Natural Capital Impact Group, a global network of companies concerned with the improvement and integration of biodiversity into corporate decision making. The Biodiversity Impact Metric is a quantifiable and easy to use measure that can help companies assessing and tracking their impact on biodiversity in a given area. It can be calculated by multiplying the area land needed to produce a commodity with the proportion of biodiversity lost through production and the relative global importance of the biodiversity loss. The basic idea is that the largest impacts on biodiversity tend to occur on farms where raw materials are produced, in the upstream value chains of companies. As such, the metric is specifically useful for companies involved in bringing a product from raw material to market (Lammerant et al., 2018; University of Cambridge, 2017).
14
2.4.2.4 The Biodiversity Indicator for Extractive Companies
The Biodiversity Indicator for Extractive Companies is a project by the UN Environment Programme World Conservation Monitoring Centre (UNEP-WCMC) and Proteus. Starting of the needs and current practices used by the extractive sector they are looking to create effective indicators able to establish corporate biodiversity performance. The methodology is still being finalized and pilot studies have to be executed (Lammerant et al., 2018; UNEP-WCMC & Proteus, 2017).
2.4.2.5 The Agrobiodiversity Index
The Agrobiodiversity Index is a tool developed by Bioversity International, a global research-for-development organization focusing on agriculture and the food sector. The tool finds it use in food and agriculture companies, but is also useful for governments and investors. The index is calculated based on three levels of measurement, each determined based on different indicators. The first, commitments, assesses the level of commitment as expressed in publicly available documents (e.g. strategies, guidelines, declarations, policies). The second, actions, includes the performance for a list of agrobiodiversity supporting practices. The third one, status, determines the actual state of agrobiodiversity at different levels (Bioversity International, 2018).
2.4.2.6 The Biodiversity Footprint and the Biodiversity Footprint Calculator
The Biodiversity Footprint is a method developed by the Consortium of Plansup, Wageningen Environmental Research (Alterra), Netherlands Environmental Assessment Agency (PBL), CREM and JSScience. Its goal is to calculate the biodiversity footprint of a company or product and assess changes in impact and effectiveness of pro-biodiversity actions. For doing so the indicator determines for each part of the production chain the combination of the area of impact and the impact on the quality of biodiversity in the impacted area. The larger the footprint, the higher the impact (Plansup, 2017). The Biodiversity Footprint Calculator is a free calculation tool by Plansup which can be used by companies to test the effectiveness of presumed biodiversity friendly measures. It is a limited version of the full Biodiversity Footprint method, only the impact of land use and greenhouse gas emissions are considered (Plansup, 2018).
2.4.2.7 The Species Threat Abatement and Recovery Metric
The Species Threat Abatement and Recovery (STAR) Metric is a metric designed by the IUCN which measures the contribution investments can make to reduce species extinction risk. The calculations are based on the IUCN Red List of Threatened Species. The STAR metric can be calculated before investment activities start and as such be used to compare investments. It can also serve for measuring the achieved impact of past conservation interventions over time (IUCN, 2017).
15
2.5 Problems underlying accounting for biodiversity
2.5.1 Valuing biodiversity
The lack of visibility of biodiversity and the difficulty of representing its true vale makes it difficult to integrate biodiversity into natural capital assessments (Bolt et al., 2016). Alho (2008) assigns seven different kinds of value to biodiversity: intrinsic, anthropocentric, aesthetic, mitigation and compensation, market, political and scientific value. Because biodiversity possesses divergent values, this leads to different conservation priorities (Maris & Béchet, 2010). Further it is questioned if biodiversity should be monetized. Jones & Solomon (2013) state that, from an ecology perspective, it is morally unacceptable to place a financial value on biodiversity.
2.5.2 Scientific uncertainty
Scientific uncertainty refers to factors related to how to preserve biodiversity and the unexpected outcomes when working with biological relationships. First, there is theoretic uncertainty, already starting with defining biodiversity. Many definitions exist for biodiversity, ranging from focusing on the species themselves to a complete anthropocentric view on biodiversity (Maris & Béchet, 2010). However, for conducting biodiversity conservation planning an accepted definition of biodiversity is needed (Swingland, 2001). Another reason of theoretic uncertainty is that when you are working with a complex thing as biodiversity, you cannot be completely certain which theoretical hypotheses are the most relevant (Maris & Béchet, 2010).
Second, there also is a practical limit, namely the outcome of practical measures is difficult to predict (Maris & Béchet, 2010). Courchamp et al. (2006) showed how rarity of wildlife can make species more valuable, making exploitation more profitable and leading to even a higher chance of extinction. Hence declaring a species endangered may result in an opposite and adverse effect, namely making the species more desirable leading to overexploitation.
2.5.3 Normative uncertainty
Normative uncertainty refers to the uncertainty considering which biodiversity to preserve and why, a result of the complexity of biodiversity as a concept that can be applied at different spatiotemporal scales and different levels of an organization (Maris & Béchet, 2010). An example of this complexity is shown in the research of Sax & Gaines (2003): they investigated biodiversity across spatial scales and concluded that global biodiversity was decreasing, but local biodiversity was increasing.
16
2.5.4 Impression management
It is not because organisations release information considering biodiversity management, that this information is reliable and contributes to greater accountability (Boiral, 2016). Companies want to show an auspicious picture of their accomplishments, and are more likely to present items with favourable than unfavourable trends (Cho, Michelon, & Patten, 2012). Bansal & Kistruck (2006) investigated stakeholder responses on impression management tactics. They found two techniques that made participants believe that a company was credible in its commitment to the natural environment. Half of the participants was influenced by illustrative (using images and/or comments) tactics, the other half by demonstrative (using facts and details) tactics. This indicates that sustainability reports can be misused by company leaders to manage the impressions of stakeholders instead of using it as a transparent tool for communication on sustainability performance (Cho et al., 2012).
2.6 An alternative for biodiversity accounting: extinction accounting
Extinction accounting can be used as an alternative for biodiversity accounting. It has as purpose the creation of awareness of the importance of managing biodiversity loss, including the risk of extinction (Maroun & Atkins, 2018). A first step is the description of the extinction risk and the reporting on actions, including partnerships, that are taken to mitigate extinction. Secondly also the successes and failures are analysed in detail and on each aspect of the accounting framework reporting is executed (Maroun & Atkins, 2018). Extinction accounting considers biodiversity as more than a disclosure element, and tries to chart the importance of biodiversity loss in terms of environmental, social but also economic impact (Atkins & Maroun, 2018).2.7 Biodiversity and the palm oil sector
Oil palm is a crop produced in tropical areas, which typically have a rich biodiversity (IUCN, 2018). The conversion of tropical forests to oil palm plantations forms a huge threat to local biodiversity (Wilcove & Koh, 2010) and several non-profit organisations have raised concerns about the expanding cultivation (Greenpeace, 2019; IUCN, 2018). With the increasing pression on the sector traceability, sustainability disclosure and certification gain importance.
In the next paragraphs global palm oil use, the consequences of oil palm cultivation for biodiversity and the most important sustainable standards used in the sector are discussed.
17
2.7.2 Global palm oil use
Palm oil is an edible oil produced by the fruit of oil palm trees (Elaeis guineensis). It is one of the world’s most popular vegetable oils, present in a wide range of products. Production of palm oil is very efficient compared to other equivalent vegetable oil crops: production per hectare amounts 3,3 tons per hectare, compared to 0,4 ton per hectare for soy and 0,7 ton per hectare for coconut, sunflower and rapeseed (WWF, 2020). In 2019 global palm oil production was estimated covering a surface of 25 million ha with a corresponding production of around 75 Million Metric Tons (United States Department of Agriculture, 2020). It is produced in 44 countries, from which Indonesia and Malaysia make up over 85% of the global supply (WWF, 2020).
2.7.3 Palm oil cultivation and the consequences for biodiversity
Palm oil is produced in tropical areas, regions that are typically occupied by moist tropical forests which are particularly rich in biodiversity (IUCN, 2018). A negative consequence of oil palm cultivation is deforestation. Cultivation of oil palm can lead to deforestation for direct land use, but also indirect reasons like constructing roads to access the plantations can play an important role in deforestation (Fitzherbert et al., 2008). However, the effect of oil palm plantations on deforestation is not clear. Roda (2019) states that oil palm is only responsible for a small part (3%) of global deforestation, as deforestation peaked decades ago and palm oil plantations are replacing other agricultural uses. Vijay, Pimm, Jenkins, & Smith (2016) determined the same trend for some countries situated in Mesoamerica and Africa, but for other countries in South America and Asia they found a scenario in which deforestation matches with recent palm oil plantation expansions.
Conversion of forest to oil palm results in a significant decrease of species richness, combined with a shift to species with low conservation value (Danielsen et al., 2008). The adverse effects do not only occur in the area used for plantations, but also biodiversity in nearby habitats is affected through edge effects, pollution and fragmentation (Fitzherbert et al., 2008). Concerns raise that future oil palm plantations will lead to more deforestation (Fitzherbert et al., 2008; Vijay et al., 2016), especially as demand for palm oil is rising (Gan & Li, 2012).
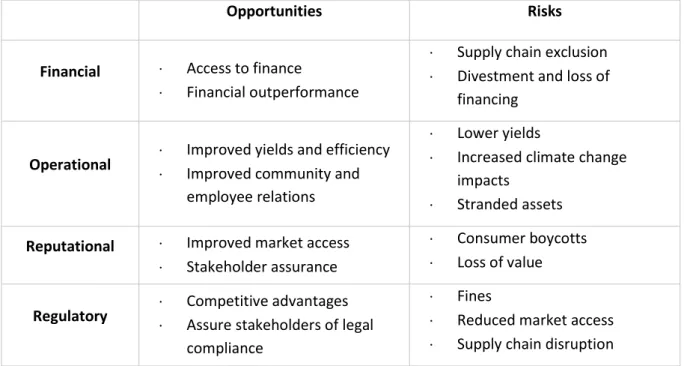
As banning palm oil production is not a good solution, because alternative oil crops need more surface to yield the same production resulting in even more biodiversity loss (WWF, 2020), the other alternative is to produce palm oil in a sustainable way (IUCN, 2018). With increasing pressure from different stakeholders, companies face different risks producing unsustainable palm oil (Spencer, Guindon, & Melot, 2019). Table 2 gives an overview of different risks and opportunities when producing (un)sustainable palm oil.
18
Table 2: Threats and opportunities when producing (un)sustainable palm oil (Source: Spencer et al., 2019)
2.7.3 The importance of sustainability disclosure in the palm oil sector
The Sustainability Policy Transparency Toolkit (SPOTT), an initiative by the Zoological Society of London, is an online, free platform which assesses the public disclosure of commodity producers and traders, such as companies active in the palm oil sector. One of the ten categories on which they score oil palm producers is deforestation and biodiversity (SPOTT, n.d.). Spencer, Guindon, & Melot (2019) compared during 2014-2019 the disclosure of palm oil producers with their financial results. They found that companies scoring higher on SPOTT had on average a higher total return compared to lower scoring companies, and the highest scoring companies also showed lower levels of volatility. These results emphasize the importance of executing sustainability enhancement in combination with a transparent disclosure.
Also sustainability standards and certification form a tool to address sustainability problems in the palm oil sector. Different sustainability standards for certification exist in the palm oil sector. The four with the largest market share in certified palm oil production (Tinhout & van den Hombergh, 2019) are discussed in the next paragraphs.
2.7.3.1 Roundtable on Sustainable Palm Oil (RSPO)
The RSPO is a non-profit organisation working together with different stakeholders in the palm oil industry to develop and implement global and sustainable standards for palm oil. The first RSPO standards date from 2008, but they keep reviewing them to make sure the standards remain relevant.
Opportunities Risks
Financial Access to finance
Financial outperformance
Supply chain exclusion Divestment and loss of
financing
Operational Improved yields and efficiency Improved community and
employee relations
Lower yields
Increased climate change impacts
Stranded assets
Reputational Improved market access
Stakeholder assurance
Consumer boycotts Loss of value
Regulatory Competitive advantages Assure stakeholders of legal
compliance
Fines
Reduced market access Supply chain disruption
19
Certification is based on standards in which the requirements are set out and can only be accredited by certified bodies. The RSPO addresses biodiversity conservation by zero deforestation, environmental impact assessments and monitoring and protection of High Conservation Value (HCV) areas. End 2018 the RSPO adapted its deforestation approach: before they had a zero deforestation policy for primary forests, now this is expanded to ‘the High Carbon Stock Approach’ in which also secondary forests are protected (RSPO, 2018).
HCV areas include among others areas with a high species biodiversity, areas with large and intact natural vegetation and little human activity and ecosystems and habitats that are rare (RSPO, n.d.-a). The HCV approach is twofold. Before certified palm oil companies can conduct new planting, both growers and certification bodies have to conduct a HCV assessment to receive approval from the RSPO. In this way the RSPO wants to prevent that new plantings have a negative environmental or social impact (RSPO, 2015). To address previous land clearance and plantation development conducted without prior HCV assessment, they developed a Remediation and Compensation Procedure. The environmental liability of the land clearance is calculated and compensated by onsite or offsite remediation (RSPO, n.d.-b).
2.7.3.2 International Sustainability and Carbon Certification (ISCC)
ISCC is a multi-stakeholder initiative focusing on sustainable, traceable and deforestation free supply chains. It offers two certification systems: ISCC EU and ISCC PLUS. ISCC EU is used to demonstrate compliance with the Renewable Energy Directive and Fuel Quality Directive, ISCC PLUS covers all other markets and sectors. ISCC PLUS uses a modular approach: in addition to the core requirements also add-ons are available, amongst others an add-on related to environmental management and biodiversity (ISCC System GmbH, 2018).
2.7.3.3 Indonesian Sustainable Palm Oil (ISPO)
The ISPO is introduced in 2011 by the government of Indonesia to improve the competitiveness of the Indonesian palm oil industry, but also to draw attention to environmental issues and reduce greenhouse gas emissions. Objectives are, among others, to protect forests and enhance biodiversity conservation. Certification with ISPO is mandatory for large palm companies and voluntary for small farmers (ISPO, n.d.).
2.7.3.4 Malaysian Sustainable Palm Oil (MSPO)
MSPO is the national certification scheme for oil palm plantations and processing facilities in Malaysia. The certification is based on standards and run by an accredited third party. Certification is mandatory for both smallholders and large plantation owners by the end of 2019. MSPO standards include
20
commitment to no deforestation and protection of rare, threatened or endangered species and high biodiversity value areas (MPOCC, n.d.).
2.7.3.5 Comparison of the sustainability standards in the oil palm sector
Tinhout & van den Hombergh (2019) compared different palm oil standards considering their relevance for protecting biodiversity. They based their comparison of the standards on two criteria: the provisions on biodiversity and the level of assurance criteria, namely if the standard gives confidence that its criteria are met. They concluded that RSPO showed the best results for both investigated criteria, and consequently the RSPO should be preferred as certification standard. The ISPO and MSPO on the other side did not score well, where the RSPO scored 70% on biodiversity provisions, the ISPO and MSPO only did 16% and 18 % respectively. For level of assurance the RSPO scored 85%, the MSPO 55%. However, the ISPO and MSPO are national standards and play an important and global role in the sustainability of oil palm. The ISCC had an average score of about 45% for biodiversity protection and around 63% for the level of assurance.
21
3 Objectives
The focus of this master dissertation is to examine to which extent organisations in the palm oil industry attempt to demonstrate their accountability for biodiversity. Past research is investigated to explore the extent of conducted research in the domain and to determine which tools are available for biodiversity accounting. From literature it is clear that awareness is rising that biodiversity loss is occurring at high rates and that measures have to be taken. However, only limited research is conducted to assess the accountability of companies towards biodiversity loss, especially for the palm oil sector.
In the practical part of this master dissertation, annual and sustainability reports of companies active in the palm oil sector are examined. Because of the exploring nature of this research, a narrative investigation is conducted. The objective of the practical investigation can be split up in two research questions. The first one explores quantitative reporting: are palm oil organisations reporting on biodiversity and how much attention do they give biodiversity in comparison with other sustainability issues.
The second research question focuses on a qualitative assessment: which kind of information is reported and how meaningful is this information. Especially for answering this research question it is useful to compare the biodiversity disclosure in the annual reports with biodiversity accounting techniques found in literature.
22
4 Methods
4.1 Data collection
The data collection consisted of annual and sustainability reports of organisations with palm oil plantations for the period 2015 - 2019. The choice for palm oil plantations can be explained by the major impact the sector has on biodiversity, as has been explained in the literature study.
Different stock markets were explored for palm oil companies, as for listed companies there is a more severe regulation to disclose information. Bursa Malaysia was found to be the most important stock market for organisations with palm oil plantations, which makes sense as Indonesia and Malaysia are the main palm oil producers worldwide (statista, 2020). Latin American palm oil companies are mostly privately-held (McMahon, 2017), resulting in a lower transparency. Because of these reasons the focus of the data collection was on palm oil companies with plantations in Malaysia and Indonesia.
In total a dataset with 54 palm oil plantation companies was distinguished: 43 were listed on Bursa Malaysia, 8 on the Singapore Stock Exchange and 1 on the London Stock Exchange, the Indonesia Stock Exchange and the Stock Exchange of Thailand. The websites of the corresponding companies were searched for more information and to obtain the annual and sustainability reports.
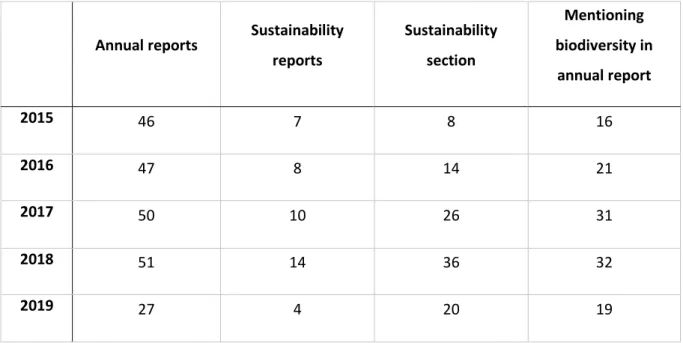
4.1.1 Annual and sustainability reports
The annual and sustainability reports were downloaded and categorized per company. However, not all the annual reports were found online. For 2015, 2016, 2017 and 2018 respectively five, four, one and two reports were not found. For 2019 many more annuals reports could not be downloaded: 26 of the 54 analysed companies were not (yet) available.
In total 41 separate sustainability reports were published over the period 2015-2019. This was done by 14 companies.
4.1.2 Other company specific data
Beside the search for the annual and sustainability reports, also other company specific data was collected. Preferably the annual reports were used to look this information up, as on a website there is more uncertainty about the accuracy. In case the information was not available in the annual report, the website of the corresponding company was used.
23
For every company information on the following topics was gathered: • Stock market
• If they are active in other sectors than the palm oil sector • Palm oil surface and total surface
• Countries in which they have palm oil plantations • Market capitalization
Market capitalization was found on the websites of the stock markets on which the companies were registered. The information on market capitalization was gathered in the week of 3-9 February 2020 and all converted to euro.
4.2 Analysis of the reports
In the next step the available annual reports of the companies in the dataset were analysed. For companies that issued a sustainability report this report was also analysed. The reports of 2015-2017 were only used to investigate if a trend in biodiversity reporting could be determined. The reports of 2018 and 2019 were studied in more detail. Excel was used to list the investigated companies and the relevant information.
4.2.1 Theme codes
To make the analysis as objective as possible, it was decided in advance which topics to consider as a topic related to biodiversity and which not. Based on previous research in literature (Grabsch, Jones, & Solomon, 2012), a classification with eight pre-determined theme codes was applied. First the annual reports were swiftly investigated in order to get an idea on how biodiversity was mentioned. Based on this exploratory analysis a list was made with topics on biodiversity. Each topic was then assigned to a theme. Table 3 gives an overview of the different themes, topics and a short explanation for each topic. In total a checklist of eight themes and 26 topics was established.
Table 3: Overview of the pre-determined themes, topics and their explanations (Based on Grabsch et al., 2012)
Theme Topic Explanation
Scene-setting
Definition Whether the company reports a definition on biodiversity
Mission statement
Whether the company has a biodiversity-related mission statement or a general aim relating to biodiversity
Certification Whether the company explains the importance of biodiversity conservation for certification
24 Sustainable Development
Goal 15: Life on land
Whether the company refers to SDG 15 to explain the importance of biodiversity conservation
Topic on biodiversity Whether the company has a topic dedicated to biodiversity
Species related
Monitoring Reporting of surveys conducted
Case-studies Reporting of case studies of species information relating to specific sites
Specific species Mention of specific species
IUCN Redlist Whether the company mentions the IUCN Redlist
Social engagement
Partnerships Organisations with which the company has partnerships on biodiversity (NGOs, universities, governments) Awards Awards/prizes gained by the company in relation to
biodiversity
Stakeholder engagement
Reporting relating to engagement by the company with stakeholder groups on biodiversity issues (engagement with local communities and schools, employee training and away days)
Performance evaluation
Targets Reporting of any biodiversity targets
Performance Reporting of status and achievement of targets
Costs Reporting of costs specifically for biodiversity conservation
Commitment
Zero deforestation Commitment to zero deforestation Zero burning Commitment to zero burning
HCV Commitment to the protection and restoration of High Conservation Value (HCV areas)
IPM Commitment to Integrated Pest Management (IPM) Protection of peatland Commitment to the protection of peatland
Risk
Stakeholder analysis Reporting of a stakeholder analysis in which biodiversity is seen as a concern
Materiality matrix Reporting of a materiality matrix in which biodiversity is seen as a material risk for the company
Internal management
Biodiversity unit Whether a team or a biodiversity manager responsible for biodiversity conservation is appointed
Biodiversity policy Whether a policy on biodiversity conservation is implemented
BAP Information relating to Biodiversity Action Plans
25
4.2.2 Quantitative analysis
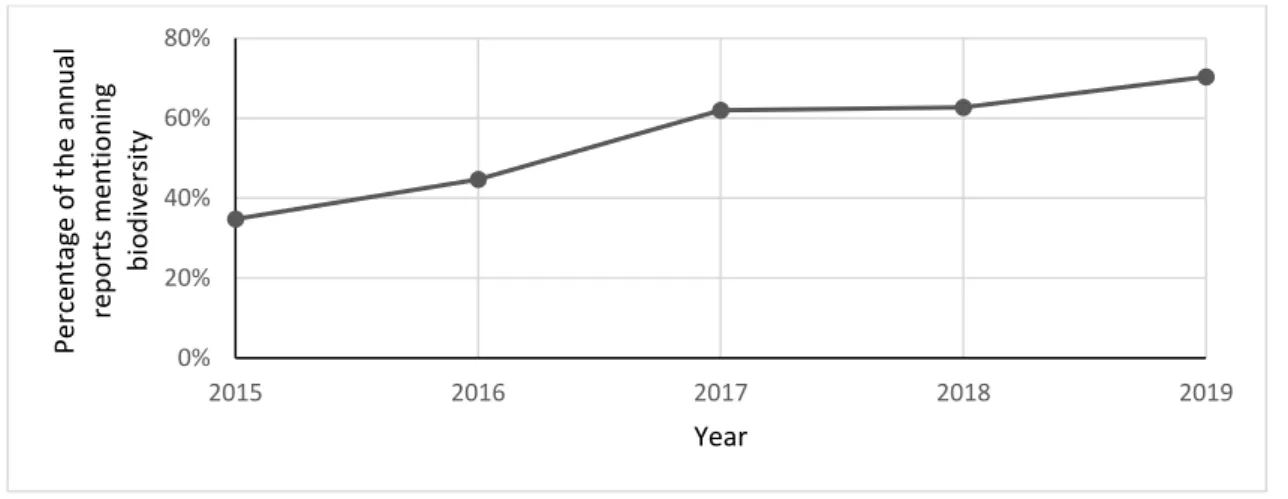
To start it was investigated if the companies of the dataset mentioned biodiversity in their reports. If available, reports of the past five years (2015-2019) were analysed. For making this task easier, the reports were searched for the keywords ‘biodiversity’ and ‘biological diversity’. For this exploration it was only checked if the reports mentioned biodiversity and not if they mentioned other topics like presented in Table 3.
In a second step the quantity on biodiversity disclosure was examined for the years 2018 and 2019. The quantitative assessment was executed using the word count function in Word. First the reports were converted to a word document by using a PDF to Word converter. For the annual reports the words related to biodiversity, the part of the report related to sustainability in general and the total amount of words were counted. For the sustainability reports the words related to biodiversity and the total amount of words were counted. Counting the words related to sustainability in the annual reports was quite straightforward, as most reports had a section dedicated on sustainability.
Counting the words on biodiversity on the other hand was more difficult, as the information on biodiversity was more scattered over the reports. The predefined topics of Table 3 were used to determine which topics to include for the counting. For every analysed report, the paragraphs and sentences which related to one of these topics were copied in a separate Word document. Finally, the total amount of words in the Word document were calculated to determine the amount of words on biodiversity.
4.2.3 Qualitative analysis
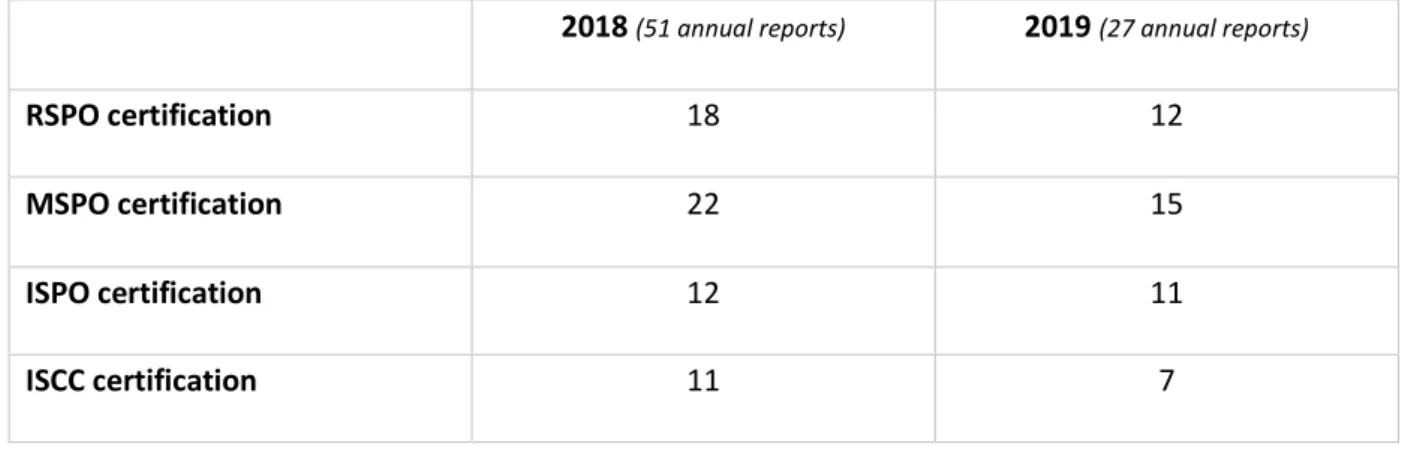
For this part only the annual and sustainability reports of 2018 and 2019 were used. For the qualitative data gathering a more thorough analysis of the content on biodiversity reporting was executed. First it was determined for each company with which certification standards it was certified.
Further, the list with topics, given in Table 3, was used to investigate the qualitative reporting of the companies. This was used as a checklist which made it possible to analyse the reports in an as objective and consistent way as possible. The excel file was expanded with extra columns and for every report it was indicated if the topics of the checklist were discussed or not. In total 26 topics were considered, which means a company’s score could range between 0 and 26.