Committed to
Published by:
National Institute for Public Health and the Environment, RIVM
P.O. Box 1 | 3720 BA Bilthoven The Netherlands
www.rivm.nl/en december 2017
Committed to
ConsExpo Web
Consumer Exposure models
model documentation
ConsExpo Web
Consumer exposure models Model documentation
Update for ConsExpo Web 1.0.2
Colophon
© RIVM 2017
Parts of this publication may be reproduced, provided acknowledgement is given to: National Institute for Public Health and the Environment, along with the title and year of publication.
DOI 10.21945/RIVM-2017-0197
This is a publication of:
National Institute for Public Health and the Environment
P.O. Box 1 | 3720 BA Bilthoven The Netherlands
www.rivm.nl/en
J.E. Delmaar (author), RIVM A.G. Schuur (author), RIVM Contact:
Christiaan Delmaar VSP/CPV
consexpo@rivm.nl
This investigation has been performed by order and for the account of ConsExpo 2015 project. This project is financed by:
Synopsis
ConsExpo Web. Consumer exposure models – model documentation
Update with regard to new features in ConsExpo Web – version 1.0.2 RIVM has developed a manual for ConsExpo Web. This web application has been developed for use by exposure experts and risk assessors to estimate exposure to chemical substances from various products under various exposure conditions. Exposure assessments provide necessary information for the evaluation of the safety of chemical substances in consumer products. ConsExpo Web is the successor to ConsExpo 4. Using ConsExpo Web, exposure experts and risk assessors from
authorities, institutes and companies can assess consumer exposure in a transparent, standardized fashion.
There is a wide variety of consumer products, ranging from cosmetics to cleaning products and pest control products. Their use (e.g. how much of the product is used and how frequently) also varies among
consumers. ConsExpo Web provides a number of generally applicable exposure assessment models and a database of exposure factors. Together, the models and the database provide a basis on which exposure from a specific product can be estimated.
This document provides an overview of ConsExpo Web, an explanation of the exposure and absorption models available in ConsExpo Web and guidance for the careful analysis of the exposure assessment. ConsExpo Web is available via rivm.nl/consexpo. After registration, the use of ConsExpo Web is free.
Keywords: ConsExpo, consumer products, exposure assessment, manual, mathematical models
Publiekssamenvatting
ConsExpo Web. Consumenten blootstellingmodellen – documentatie
Actualisatie naar aanleiding van nieuwe mogelijkheden in ConsExpo Web – versie 1.0.2
Het RIVM heeft een handleiding opgesteld voor het gebruik van
ConsExpo Web. Deze internetapplicatie is ontwikkeld om de blootstelling aan chemische stoffen te schatten voor uiteenlopende producten en omstandigheden waaronder consumenten aan ze worden blootgesteld. De blootstellingsberekeningen geven informatie die nodig is om de veiligheid van chemische stoffen in consumentenproducten te kunnen beoordelen. ConsExpo Web is de opvolger van ConsExpo versie 4 en is bedoeld voor blootstellingsexperts en risicobeoordelaars van overheden, instituten en bedrijven. Met ConsExpo Web kunnen zij
blootstellingschattingen op een transparante en gestandaardiseerde manier uitvoeren.
Er bestaat een grote verscheidenheid aan consumentenproducten, van schoonmaakmiddelen en ongediertebestrijdingsmiddelen tot verf en cosmetica. Ook de manier waarop consumenten de producten gebruiken verschilt, zoals de doseringen en de frequentie. ConsExpo Web biedt een aantal algemeen toepasbare blootstellingsmodellen en een database met gegevens over blootstellingsfactoren. Tezamen bieden zij een basis van waaruit de blootstelling van een specifiek product geschat kan worden. De handleiding geeft een overzicht van ConsExpo Web, een uitleg van de in ConsExpo Web beschikbare blootstelling- en opname modellen en aanbevelingen om de blootstellingsschatting zorgvuldig te analyseren. ConsExpo Web is beschikbaar via rivm.nl/consexpo en is, na registratie, gratis te gebruiken.
Kernwoorden: ConsExpo, consumentenproducten,
Contents
Summary — 9Additions or changes to the manual – version December 2016 — 11 1 Introduction — 13 2 ConsExpo framework — 15 2.1 General considerations — 15 2.2 Definitions — 15 2.3 Available models — 16
2.4 ConsExpo fact sheets — 16
3 Using ConsExpo — 19
3.1 The Assessments screen — 19
3.1.1 Specifying scenarios — 20
3.1.2 Specifying input parameters — 22
3.2 Simulation — 24 3.2.1 Results — 24 3.2.2 Graphs — 24 3.2.3 Sensitivity analysis — 25 3.2.4 Probabilistic results — 26 3.3 Output measures — 27 3.3.1 Inhalation — 28 3.3.2 Dermal — 28 3.3.3 Oral — 28 3.3.4 Integrated — 29 3.4 Report — 29 4 The models —31 4.1 Inhalation route — 31
4.1.1 Exposure to Vapour model — 31 4.1.2 Exposure to Spray model — 38 4.1.3 Emission from Solid Materials — 44 4.1.4 Modelling inhalation and absorption — 46
4.2 Dermal route — 47
4.2.1 Direct Contact with Product model — 47 4.2.2 Dermal absorption models — 52
4.3 Oral route — 52
4.3.1 Direct Product Contact model — 53
4.3.2 Migration from Packaging Material model — 54 4.3.3 Oral absorption model — 55
5 Analysis of the results — 57
5.1 Worst case estimates — 57
5.2 Distributions — 57
5.2.1 Parametric distributions in ConsExpo — 57 5.3 Sensitivity analysis — 58
Appendix I. Adaptations with respect to ConsExpo 4 — 63 Appendix II. Updated terminology — 64
Summary
Consumers are exposed to chemical substances in consumer products. To assess the risks of such exposures, an estimate of their magnitude is required. ConsExpo is a modelling tool that can be used to estimate consumer exposure to a wide variety of products in a wide variety of circumstances. The ConsExpo tool has been made available as a web application, ConsExpo Web. This application succeeds ConsExpo 4, a stand-alone consumer exposure modelling software tool.
This document provides user guidance and background information on the ConsExpo Web tool. ConsExpo Web provides a number of generally applicable exposure models and a database of exposure factors for a broad set of consumer products. Together, the models and the database provide the tools needed to assess exposure for a wide range of
consumer products. Only basic additional information on product
composition and the physicochemical properties of the substance under assessment are needed.
This report describes in detail how the ConsExpo Web tool is to be used to conduct consumer exposure assessments. It describes how to add multiple scenarios to an assessment, how to select models and how to specify model inputs. Different output measures and methods of evaluating and visualizing exposure are also discussed.
A detailed description of the ConsExpo models is also provided. ConsExpo Web contains models to estimate exposure via inhalation, dermal contact and oral ingestion. The exposure models vary in complexity, from simple screening models to more advanced, physics-based models.
Additionally, it is discussed how ConsExpo can be used to obtain insight into the factors affecting exposure to substances in consumer products by using the sensitivity analysis and probabilistic evaluation tools.
Additions or changes to the manual – version December
2016
December 2017
Necessary additions or changes are made to this manual (Delmaar & Schuur, 2016), because of next versions of ConsExpo Web, which are published in July 2017 and December 2017.
See Appendix III for features added in ConsExpo Web version 1.0.1 and 1.0.2.
This manual is changed at:
• Section 3.1 Inclusion of a preview panel of selected models, default values including the Q-factors when a scenario is selected from the default fact sheet database
• Section 3.1. Possibility to choose default from database for body weight
• Section 3.1 Export functionality to Chesar (see separate help document, and reporting function adapted to a functionality to report to Excel
• Section 3.1.1. Possibility to duplicate scenario
• Section 3.2.2 Possibility to export graph data to Excel
• Section 3.2.2. Explanation on how to export data from graphs • Section 3.3.1. Inclusion of an additional endpoint “peak
exposure” for the inhalation models “exposure to spray” (instantaneous, spraying) and “exposure to vapour”
(instantaneous release, constant release and evaporation) as a time-weighted average of 15 min.
• Section 4.1.1.2 “Limit concentration to saturated air concentration” is checked by default.
• Section 4.1.1.4. Information of mass transfer coefficient,
possibility to choose default of 10 m/hr instead of using outcome of model estimation
• Section 4.1.1.4 Inclusion of the parameter dilution
• Section 4.1.2.2 15 µm included as standard default for inhalation cut off diameter
• Section 4.1.4. Possibility to choose default from database for inhalation rate
1
Introduction
Consumer products contain chemical substances. Consumers using these products may be exposed to these substances. To assess the risks of such exposure, an exposure estimation has to be performed. The assessment of exposure to substances in consumer products is
complicated by the wide variety of consumer products and variation in the behaviour of consumers. ConsExpo Web is a web application that features a set of models that assist in the assessment of exposure to substances in consumer products.
ConsExpo Web is the successor to the ConsExpo 4 computer program. This program was initially developed at the request of the Netherlands Food and Consumer Product Safety Authority (NVWA). The ConsExpo Web application was developed with the help of the RIVM’s counterpart institutes ANSES (France), BfR (Germany), FOPH (Switzerland) and Health Canada and the Netherlands Food and Product Safety Authority and the Dutch Ministry of Health, Welfare and Sport.
What is the rationale behind the exposure models in ConsExpo?
Exposure to consumer products is characterized by a great diversity in the chemical composition and usage of products. The questions
encountered during the process of human risk assessment are manifold. How can exposure be estimated? What exposure data are available? Are they representative of the situations in which the product is used? Which factors determining exposure are important? Which dose measure to calculate? How should multi-route exposure be assessed? How should risk be characterized? What effects cause the main risks? On what time scale are effects relevant? ConsExpo Web (hereafter referred to as ConsExpo) is designed to facilitate indoor exposure estimates for the process of exposure and risk assessment.
ConsExpo implements a range of generally applicable mathematical models describing exposure processes via inhalation, dermal contact and oral ingestion. For all routes of exposure, ConsExpo provides models of increasing complexity from simple screening models to more detailed mechanistic models. This allows the exposure assessment to be carried out using a tiered approach, starting with simple, first-order models used to estimate maximum exposure, and moving on to more detailed and complex models when the exposure estimation needs to be refined. As a rule, the more detailed the exposure assessment, the more data is needed. Whereas the simple, first-order models require only limited, general information, the more advanced models often require very specific data, which may be hard to obtain.
To assist in exposure assessments, ConsExpo is equipped with a database of default products for which exposure scenarios have been defined and a set of default values for use as model input parameters is provided. The database may serve as a starting point for the exposure assessment. The justifications for the default values are given in fact sheets for specific product categories. Fact sheets have been published
2006a) and cosmetics (Bremmer et al. 2006b), among other products. For a complete overview and the most recent versions of the fact sheets, see the ConsExpo website (www.consexpo.nl).
ConsExpo outputs different measures of estimated exposure. Depending on the route of exposure, ConsExpo calculates (mean) air
concentrations, external doses and internal doses. Different periods of exposure are also considered: the exposure event, the day on which exposure takes place and the average annual exposure (mean air concentration or dose). The application can produce graphs of the different exposure measures over time. In addition, ConsExpo can generate probabilistic evaluations, using distributions of input values for a (set of) parameter(s) rather than deterministic values. Furthermore, the application enables sensitivity analyses to be carried out.
ConsExpo Web consolidates to a large extent features of the ConsExpo 4 software tool. In addition, it features a model for assessing exposure to substances emitted from solid materials and a low-tier model for the assessment of exposure to substances in sprays, which was added next to the more complex spray model included in ConsExpo 4.
ConsExpo also allows the combination of multiple scenarios in a single assessment, where ConsExpo 4 allowed only the evaluation of one scenario for one substance in one product.
The aim of this report is to provide guidance on how to use ConsExpo. It includes a description of the models included in the application, as well as some important notes to enable a careful analysis of the results. The report is an update of the documentation on ConsExpo 4 (Delmaar et al. 2005).
Contact
ConsExpo is accessible via www.consexpoweb.nl. Information on the ConsExpo program and supporting products is available at
www.rivm.nl/consexpo. To make comments, ask questions or report problems or bugs, please contact us at ConsExpo@rivm.nl.
Proclaimer for use of the ConsExpo Web tool
ConsExpo Web is an online tool designed to estimate the consumer exposure to substances in several consumer products.
New knowledge or insights may lead to model changes and updates of the tool. Adjustments to the model to a new version will be clearly communicated via the website. The actual version is mentioned in the footer of the webpage.
The application of ConsExpo Web, including the evaluation and selection of data, requires expert knowledge on consumer exposure assessment and risk assessment. When used as a starting point for risk assessment adequate interpretation of the results of the model calculation is
required.
RIVM is not responsible for the consequences of the operational use of ConsExpo Web.
2
ConsExpo framework
ConsExpo is a web application developed for the assessment of exposure of consumers to substances in consumer products. The ConsExpo tool implements a set of models that facilitate the estimation of chemical substance exposure arising from the use of consumer products. There is a wide variety of consumer products. In order for it to be applicable to most of these products, the ConsExpo software was set up to be generic, in the sense that, rather than exposures related to
specific products, it models general exposure processes that may be relevant to different types and groups of products.
Specific data on factors determining exposure are scarce. As a result exposure assessments are often based on limited data. The ConsExpo framework was designed to provide the models and the information on exposure factors needed in these situations.
2.1 General considerations
The level of exposure to a substance in a consumer product is determined by factors such as the use of the product and the contact with the
substance after its release from the product. The assessment of the exposure starts by specifying emission of the substances from the consumer product and transport to other parts of the residential
environment. Emission and transport determine the concentration–time profiles of the substances, during and after use of the product.
There are various ways in which a person can be exposed to a substance in a consumer product. For example, a volatile substance may be
emitted into air that is subsequently inhaled. A product may be applied to the hands, resulting in dermal exposure to a substance in the
product. By hand-to-mouth contact some of the substance can be transferred to the mouth, resulting in oral exposure. Consequently, a substance may be absorbed into the body via these different routes, resulting in an internal dose.
The user should be aware that the ConsExpo models, like all models, are only a simplified representation of reality, valid only as an
approximation and only in limited conditions of application. The results of an exposure assessment obtained by modelling should always be treated with caution.
2.2 Definitions
ConsExpo distinguishes between external and internal exposures.
External exposure within the ConsExpo framework is defined as: contact of the substance with the outer boundary of the body (i.e. skin or lung or gut wall). Internal exposure is defined as the amount absorbed over this boundary. ConsExpo implements separate models for calculating the external exposure and for assessing the absorption of the substance.
As for the time scales, ConsExpo considers exposure during the exposure event, on the day of exposure and year average exposure.
2.3 Available models
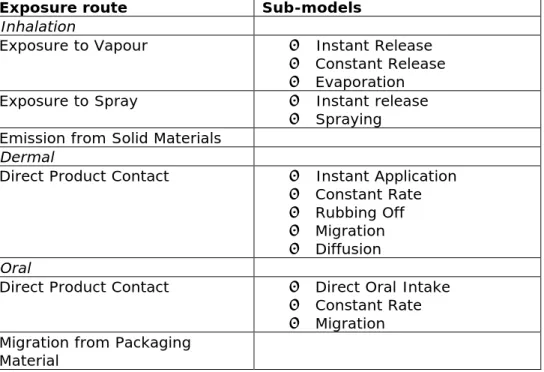
An overview of all the models available in ConsExpo and the input parameters that apply to each model is presented in Table 1. All models and their boundary conditions are described in more detail in Chapter 4.
Table 1. Available exposure models in ConsExpo
Exposure route Sub-models
Inhalation
Exposure to Vapour • Instant Release
• Constant Release • Evaporation
Exposure to Spray • Instant release
• Spraying Emission from Solid Materials
Dermal
Direct Product Contact • Instant Application • Constant Rate • Rubbing Off • Migration • Diffusion Oral
Direct Product Contact • Direct Oral Intake • Constant Rate • Migration Migration from Packaging
Material
2.4 ConsExpo fact sheets
A number of fact sheets has been published that bring together relevant exposure information for a main category of consumer products.
Currently, fact sheets are available for cleaning products, cosmetics, paint products, pest control products, disinfectant products, do-it-yourself products and children’s toys (Bremmer et al. 2002; 2006a; 2006b; 2007; Ter Burg et al. 2007; Prud’homme de Lodder et al. 2006a; 2006b). These fact sheets will be updated in the coming years and extended to cover, for example, air fresheners. A General Fact Sheet (te Biesebeek et al. 2014), which deals with subjects that are relevant to several main categories, has already been updated. It gives, for instance, anthropometric data and details on residential buildings: data that are needed in all product fact sheets.
The consumer product categories consist of products for which exposure takes place in a similar fashion. For each category the relevant
ConsExpo models are described, default parameter values are provided for a typical scenario and the choice of these default values is justified. When using the database, the user should always consult the
corresponding fact sheet, in order to be aware of the basis of the selected parameter values and their limitations.
The default parameters are an integral part of ConsExpo. When the user selects a product, the program provides default models and input values for those models. The defaults can serve as a starting point for exposure estimation but should be used in the absence of accurate scenario data only. Whenever more detailed information for the product is available, these data should be used instead.
The fact sheets describe a high-exposure scenario in which consumers frequently use the relevant product under relatively unfavourable circumstances. The basic assumptions are: relatively frequent use, application of a relatively large amount in a small room with a low ventilation rate, and a relatively long stay in that room. However, when conservative estimates of all input parameters are made, the overall estimate may easily become unrealistically high.
For this reason, in the ConsExpo fact sheets it was decided to make somewhat less conservative assumptions for the default values for the input parameters. Whenever a distribution of data on the exposure factor is given, a 75th percentile is chosen as a value to represent the distribution of this particular exposure factor. This yields more realistic, yet still conservative, estimates of exposure. It should be noted, that also by following this approach the exact degree of conservatism applied is still unknown. This can only be revealed by including uncertainty and variability in the exposure factors explicitly in the calculations and performing probabilistic estimations (see Section 5.2 for details).
3
Using ConsExpo
Using ConsExpo, an exposure assessment is conducted for one substance in a single product. The exposure is assessed for a single target population. Considering multiple populations or products requires the creation and evaluation of multiple separate exposure assessments. ConsExpo defines ‘assessment’ and ‘scenario’ data structures to
organize an exposure assessment. The user may create and store multiple assessments. The assessment contains information on the substance, the product and the target population. An assessment may contain one or more exposure scenarios. An exposure scenario contains information on the frequency of occurrence of an exposure event. In addition, the scenario specifies the exposure models and parameter input that are used to estimate exposure.
Scenarios can represent exposure during different uses, or different phases of use, of the same product (e.g. preparation of a product, actual use of the product, post-application exposure), or different tiers of an iteratively refined exposure assessment.
3.1 The Assessments screen
When ConsExpo is opened, the first screen is the ‘Assessments’ screen (see Figure 1). This screen provides an overview of all the assessments (if any have been made already) of the current user.
The user may create a new assessment, import an assessment from a file or create a new assessment using information from the fact sheets, using the ‘Use Fact Sheet’ button.
Figure 1. The ConsExpo Assessments pane gives an overview of available assessments.
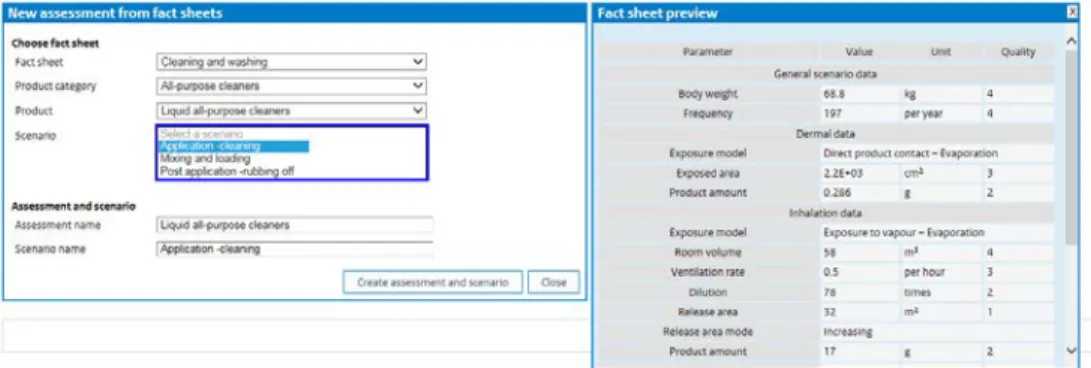
In the case that an assessment is created from the fact sheet, a panel is opened on which a fact sheet, a product category, product, and scenario can be selected. After selection a preview of the selected scenario, including the input parameter defaults and Q-factors is given in a separate panel (see Figure 2).
Figure 2. Fact sheet preview as shown when a fact sheet – product category – product – scenario is selected.
Selecting a specific assessment from the list of available assessments opens the ‘Assessment settings’ window (Figure 3). Here the user may edit substance, product and population properties.
For the population, default body weights may be selected from three available databases; Canadian (adapted by Health Canada from CCHS, 2005 and National Health and Nutrition Examination Survey (NHANES) using data from 1999-2010), ConsExpo General fact sheet (te Biesebeek et al. 2014) or EU Biocides Framework (ECHA, 2017).
The user may delete the assessment and/or export the assessment to a file that can be shared with other users.
Export is possible to a ConsExpo Web file (.ce), as export file to Chesar (see manual for export RIVM, 2017; .chr), and as report (in .csv format) to Excel.
Figure 3. The Assessment settings window shows the settings for the selected assessment and allows the user to edit, delete or export the assessment to file. Additionally, if an assessment has been completely specified, a report may be generated by using the ‘Report’ button.
3.1.1 Specifying scenarios
Selecting a particular assessment opens the ‘Scenarios’ window. In the ‘Scenarios’ window (Figure 4), a list of available scenarios is displayed.
Figure 4. The Scenarios window.
From the list of scenarios the user may select an existing scenario for editing or simulation, add a new blank scenario, create a new scenario based on defaults from the ConsExpo fact sheets, or duplicate an available scenario.
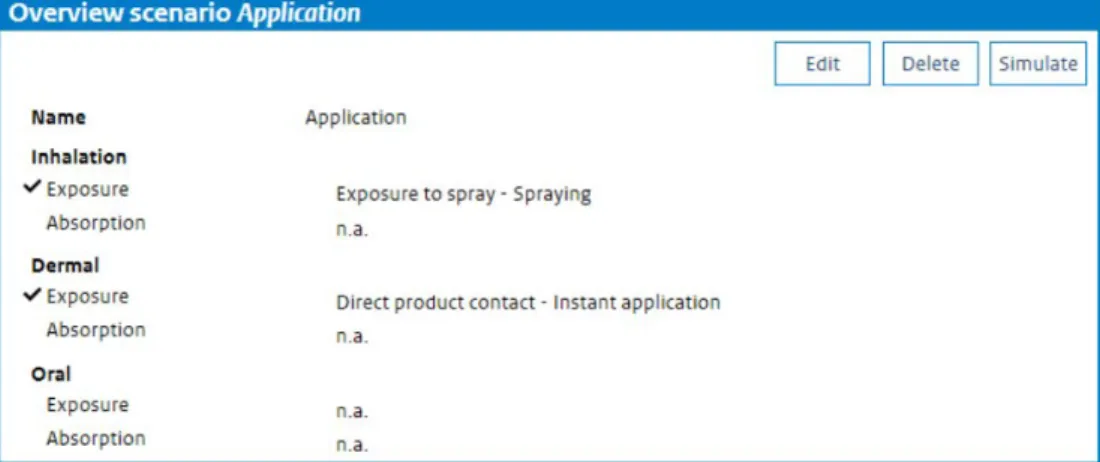
Selecting a scenario or creating a new scenario brings up the ‘Overview scenario’ window (Figure 5), displaying a summary of the exposure scenario created or selected. It shows which routes of exposure have been included and which exposure models have been selected for simulation.
Figure 5. The Overview scenario window shows the selected routes for the scenario and the models chosen to model exposure and absorption for each route.
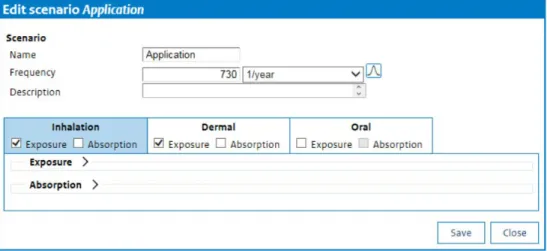
From the ‘Overview scenario’ window, the scenario may be edited (i.e. models for simulation can be selected for the scenario and input for the models can be provided), the scenario can be deleted or different aspects of the scenario can be evaluated by pressing the ‘Simulate’ button. Clicking on ‘Edit’ opens the ‘Edit scenario’ window (Figure 6). Here the scenario name and the exposure frequency should be set, a description of the scenario can be provided and models to simulate exposure for the different routes (inhalation, dermal and oral) can be specified.
When a specific exposure or absorption route is to be included, the user should check the box in front of the required route.
Figure 6. The Edit scenario window allows the user to name the scenario, specify the exposure frequency and select models for each route of exposure.
3.1.2 Specifying input parameters
Different models require different inputs. Data input is done by specifying a single (point) value in the box after the parameter, e.g. ‘Exposure duration’, name and selecting the appropriate unit from the units dropdown (see Figure 7).
Figure 7. Specifying a parameter input
Alternatively, parameters may be specified as distributions rather than single, deterministic values. This enables ConsExpo to perform
probabilistic evaluations by Monte Carlo simulation.
Distributions of parameter values are specified by pressing the Distributions button . This opens the Distribution editor, where a distribution type can be chosen (none, uniform, triangular, normal or log normal) and parameters to define the distribution can be specified. Pressing the button will show a preview of the specified distribution (Figure 8).
Figure 8. Specifying a distribution as parameter input rather than a deterministic value. The specified distribution is used to perform a probabilistic (Monte Carlo) simulation of the scenario.
The parameter probability distributions supported by ConsExpo are described below.
Normal
Specify the mean µ and standard deviation σ. The distribution is defined by the probability density function:
2 1 1 ( ) exp( ( ) ) 2 2 x P x µ σ σ p − = − Log Normal
Specify the median µ and arithmetic coefficient of variation C.V. The probability density is defined as:
2 1 1 ln( ) ln( ) ( ) exp( ( ) ) 2 2 x P x x µ σ σ p − = − and 2
. .
1
C V
=
e
σ−
UniformSpecify a lower bound xo and an upper bound x1 of the distribution. The
1
1
( )
oP x
x
x
=
−
TriangularSpecify (a) location (minimum), (b) scale (maximum) and (c) shape (maximal probability). The probability density varies between the minimum and maximum values and has maximum probability at the ‘shape’. It is defined as:
2( ) ( ) ; ( )( ) x a P x a x c b a c a − = ≤ ≤ − − 2( ) ( ) ; ( )( ) b x P x c x b b a b c − = ≤ ≤ − − 3.2 Simulation
From the ‘Scenario overview’ window, the user may evaluate different aspects of the specified models for the selected scenario.
3.2.1 Results
If the user has specified single (point) values for all model parameters, clicking the ‘Simulate’ button will generate a deterministic calculation. ConsExpo displays the results in the ‘Output scenario’ window (Figure 9) with an overview of calculated point values for all specified end points (see Section 3.3 for an overview of the calculated end points in ConsExpo).
Figure 9. The Output scenario window features three sub-sections: ‘Results’, ‘Graphs’ and ‘Sensitivity analysis’. The ‘Results’ section displays end point estimates of exposure for all included routes.
3.2.2 Graphs
Clicking on ‘Graphs’ shows the exposure during a single event via
automatically be set to the exposure duration specified by the user. For models that do not depend on time, the graph option is not available.
Figure 10. The Graphs section of the Output scenario window shows the results of the simulation of exposure during the exposure event. A plot of the time series for a selected end point is made against exposure duration.
From the graph options, it is possible to export the data to Excel. This can be done by left-mouse clicking the icon in the upper right corner of the graph’s panel. The dropdown menu features a ‘Download Excel’ option, which downloads the graph data in a comma separated file.
3.2.3 Sensitivity analysis
Sensitivity analysis allows the user to investigate graphically the sensitivity of the model outcome to changes in one single parameter (Figure 11). The user should select the required calculation end point (exposure measure), select the parameter for which the sensitivity analysis is to be performed from the ‘Parameter’ drop-down list and set the range of variation and the units for the requested parameter. A graph is plotted showing the outcome of the calculations for the range of values given for the chosen parameter.
Figure 11. The Sensitivity analysis section in the Output scenario window enables the assessment of sensitivity of the selected model(s). The parameter value is shown for the specified range of values of the parameter, giving insight into the change in the end point with changes in the input parameter
considered.
3.2.4 Probabilistic results
If the user has specified at least one parameter as a distribution, ConsExpo will perform a probabilistic evaluation. When simulating a probabilistic scenario, the user is asked to specify the number of random samples that will be taken in the Monte Carlo simulation (Figure 12). Currently, the number of samples (or ‘iterations’) that can be chosen in ConsExpo varies from 1,000 to 50,000.
Figure 12. When a user specifies a distribution for an input parameter rather than a single, deterministic value, a probabilistic evaluation is conducted. When
Scenario’ window, the user is first asked to specify the number of samples (or ‘iterations’) that are to be taken in the probabilistic simulation. After
specification of the number of iterations and pressing the ‘Simulate’ button again, a probabilistic evaluation is conducted.
When the user presses the ‘Simulate’ button again, a Monte Carlo
simulation is run. The ‘Results’ tab on the output window summarizes the resulting distributions of probabilistic end points. For these the mean, median, standard deviation and 90th and 99th percentiles are presented. A complete plot of the distribution as a frequency histogram and a cumulative probability distribution can be viewed by pressing ‘Plot distribution’.
Figure 13. The results of a probabilistic assessment, including a histogram and cumulative plot of the distribution of exposure.
3.3 Output measures
ConsExpo calculates various measures for each route of exposure. Integrated doses (i.e. doses summed over various routes) are also evaluated if absorption models are used in the assessment.
3.3.1 Inhalation
For the inhalation route the following exposure measures are given: • Mean event concentration: average air concentration on
exposure event. Note: depends strongly on chosen exposure duration;
• Peak concentration: peak concentration is the 15 minute time
weighted average of the air concentration around its maximum. In case the exposure duration is less than 15 minutes, the mean event air concentration is given instead.
• Mean concentration on day of exposure; average air
concentration over the day (accounts for the number of events on one day)
• Year average exposure; mean daily air concentration averaged
over a year
• External event dose: the amount that can potentially be
absorbed by inhalation per kg body weight during one event. • External dose on the day of exposure: the amount that can
potentially be absorbed per kg body weight during one day. The external doses for multiple events that take place on the same day are added.
• Internal event dose: tabsorbed dose per kg body weight during
one event.
• Internal dose on day of exposure: the absorbed dose per kg
body weight during one day Note: these can be higher than the ‘event dose’ for exposure frequencies larger than 1 per day. • Internal year average dose: daily absorbed dose per kg body
weight averaged over a year.
3.3.2 Dermal
The following dermal exposure measures are given:
• Dermal load: the amount of substance per cm2 of exposed skin. • External event dose: the amount that can potentially be
absorbed per kg body weight during one event.
• External dose on day of exposure: the amount that can be
absorbed per kg body weight on the day exposure occurs. The external doses for multiple events that take place on the same day are added.
• Internal event dose: absorbed dose per kg body weight during
one event.
• Internal dose on day of exposure: absorbed dose per kg body
weight during one day. Note: these can be higher than the ‘event dose’ for exposure frequencies larger than 1 per day.
• Internal year average dose: daily absorbed dose per kg body
weight averaged over a year.
3.3.3 Oral
Oral exposure measures given by ConsExpo are:
• External event dose: the dose that can be absorbed orally per
kg body weight during one event.
• External dose on day of exposure: the dose that can be
absorbed orally per kg body weight on the day exposure occurs. • Internal event dose: the absorbed dose per kg body weight
• Internal dose on day of exposure: the absorbed dose per kg
body weight on the day exposure takes place.
• Internal year average dose: the absorbed dose per kg body
weight averaged over a year.
3.3.4 Integrated
The integrated doses are the sums of the corresponding doses per route. These are given only for internal exposure (i.e. when absorption is included in the calculation). Measures given are:
• Internal event dose: the total absorbed dose per kg body
weight during one exposure event.
• Internal dose on day of exposure: the absorbed dose per kg
body weight during one day. Note: these can be higher than the ‘event dose’ for exposure frequencies larger than 1 per day. • Internal year average dose: the daily absorbed dose per kg
body weight averaged over a year.
3.4 Report
A report of the assessment is generated by pressing the ‘Report’ button in the ‘Assessment settings’ pane (see Figure 3). The ConsExpo report gives a complete (textual) overview of the exposure calculation. It displays all parameter values and the calculated exposures.
4
The models
ConsExpo includes exposure and absorption models for each exposure route. This chapter describes in more detail the available models and their parameters.
In the description of the model equations the units of the parameters are given according to the standard S.I. system. These units are used only for description purposes. The user can choose more appropriate units when using the program.
4.1 Inhalation route
Many consumer products contain substances that may reach the body via the inhalation route. A simple example is a spray containing a volatile substance. After spraying, the substance may be present in the air inhaled by the product user or by other people. Subsequently, a
substance may enter the body by absorption in the lungs. Three exposure models – Exposure to Vapour, Exposure to Spray and Emission from Solid Materials – and one absorption model are available in ConsExpo to
describe indoor inhalation exposure to substances in consumer products.
4.1.1 Exposure to Vapour model
The Exposure to Vapour model describes a situation in which a
substance evaporates from a liquid product into the room air. Examples include the evaporation of substances from an open tin of paint or from a freshly painted wall. The substance may comprise 100% of the
product, or be part of a mixture of substances.
The concentration of the substance in the room air will depend on the amount of substance present in the room, the room size, the ventilation of the room air, the vapour pressure of the substance and the rate at which the substance is released into the air.
Depending on the information available on the use of the product, different modes of release of the substance from the product can be selected to calculate the release of the substance into the room air. The different release modes are the Instantaneous Release, Constant Rate and Evaporation.
In some cases, the amount that actually is released into indoor air is limited by the saturated vapour pressure of the substance. The resulting air concentration will depend on this vapour pressure, the substance’s molecular weight and the temperature during application. The latter may represent typical room conditions, but may also be the temperature at which the substance is handled (e.g. the temperature of a solvent), which may be higher than room temperature. In all cases, care should be taken that the vapour pressure is specified at the temperature at which the substance is handled. For example, if a substance is solved in water of a temperature of 40 oC, the vapour pressure at this
4.1.1.1 General parameters
Parameters that are used for all options within the Exposure to Vapour model are:
• Exposure duration: the total time the exposed person is in the
room where the substance is being released.
• Product amount: the amount of product used in one event.
• Weight fraction substance: the fraction of substance in the
product.
• Room volume: the volume of the room in which the exposure
occurs.
• Ventilation rate: the number of total air changes in the room
per unit of time. For example, if it takes 20 minutes for all the air in the room to be exchanged, the ventilation rate is 3 times per hour.
4.1.1.2 Exposure to Vapour: Instantaneous Release
The Instantaneous Release mode is the mode of release that will usually result in a relatively high exposure, and can therefore be used as a first tier to establish the upper level of exposure. The scenario assumes that all substance is released from the used product at once into the room and is subsequently removed by ventilation.
The air concentration of the substance at time t for the Instantaneous Release mode is calculated as:
1. A qt C V
wf
o
air
e
− ××
=
where:Cair concentration of substance in the room air [kg/m3]
Ao product amount [kg]
wf weight fraction of the substance in the total product [fraction]
V room volume [m3]
q ventilation rate of the room (number of air changes
per time unit) [1/s]
t exposure duration [s]
In reality, there is a limit to how much of the substance can evaporate in the air, depending on its vapour pressure. By default, the checkbox in front of the phrase ‘Limit concentration to saturated air concentration’ is checked. When the box is checked, air concentrations as calculated by the Instantaneous Release mode are limited by the saturated air
concentration of the pure substance.
This air concentration, Csat, is calculated from the saturated vapour
pressure using the ideal gas law: 2. Csat = MPsat/RT
where:
M molecular weight of the substance [kg/mol] Psat saturated vapour pressure [Pa]
R universal gas constant [J/mol/K]
T temperature [K]
4.1.1.3 Exposure to Vapour: Constant Rate
In contrast to the Instantaneous Release mode, which describes the release of a substance into the air at once, the Constant Rate mode describes the release of a substance at a constant rate over a certain period. During this time, the substance may be removed from the air by ventilation of the room.
This mode of release can be used if information on the evaporation properties of the substance is not available, but the period during which the substance evaporates can be estimated. In addition to the
parameters used in the Instantaneous Release mode, the Constant Rate mode uses the ‘emission duration’ parameter: a reasonable estimate of the time during which the substance is released.
The air concentration of the substance at time t for the Constant Rate release mode is calculated as:
3a. f / (1 qt
)
Ao tr C ew
air
qV
− × −×
=
For exposure t < tr (i.e. during release)
3b. / ( ) (1 ) f A t qt q t t o r r r C e e air qV
w
− − − =×
× − ×For exposure t > tr (i.e. after release)
In the case of no ventilation (i.e. q=0) these equations reduce to
3c.
𝐶𝐶
𝑎𝑎𝑎𝑎𝑎𝑎=
𝐴𝐴𝑜𝑜× 𝑤𝑤𝑓𝑓𝑉𝑉
×
𝑡𝑡 𝑡𝑡𝑟𝑟
For exposure t < tr (i.e. during release)
3d.
𝐶𝐶
𝑎𝑎𝑎𝑎𝑎𝑎=
𝐴𝐴𝑜𝑜× 𝑤𝑤𝑓𝑓 𝑉𝑉where:
Cair concentration of substance in the room air [kg/m3]
tr emission duration [s]
Ao amount of product used [kg]
wf weight fraction of the substance in the product [fraction]
V room volume [m3]
q ventilation rate of the room (number of air changes per
time) [1/s]
4.1.1.4 Exposure to Vapour: Evaporation
The Evaporation mode describes the release of the substance from the surface of the product by a physics based description of evaporation. The Evaporation mode explicitly models the evaporation of the substance from the product. Evaporation is driven by the difference between the vapour pressure in the room air and the saturated vapour pressure of the substance. The rate of evaporation is proportional to this pressure
difference and depends on the surface area of the product and the mass transfer coefficient. This mass transfer coefficient is a measure of how fast the evaporated substance is transferred from the product surface into the room air It accounts for the fact that emission from a product is limited due to the presence of a stagnant layer of air over the product’s surface through which the substance diffuses to reach indoor air. The mass transfer coefficient depends on a number of factors including the diffusivity of the substance through air (dependent on molecular weight), the air flow over the product, and the surface roughness of the product. Estimating the mass transfer coefficient
ConsExpo offers two models that give an approximate estimate of this mass transfer coefficient. The first is Langmuir’s method (Zemansky and Dittman 1984), which consists in ignoring all transport-limiting processes such as diffusion. It provides an upper limit of the rate of release for any system and will in general result in a high over-estimation of the peak concentrations in the room air. The other method is that of Thibodeaux (1979) and is a simplification of the more complicated Slater two-layer model, which describes the release of a substance from water into air. Mass transfer coefficients calculated using this model will be lower than the ones calculated by Langmuir’s method, but it should be remembered that this method is only an approximation of a specific system
(evaporation of a solute from water outdoors) and has limited validity outside the domain for which it was derived.
Several alternative models have been developed and used to estimate mass transfer in indoor environments.
Weschler and Nazaroff (2008) use a particle deposition model to derive typical mass transfer rates for SVOCs from flat surfaces indoors to indoor air. This model uses information on the range of typical
diffusivities of substances in air indoors to describe the mass transfer. They conclude that for the substances they considered the mass transfer coefficient ranges from 2.5 to 3.9 m/h.
The US EPA Consumer Exposure Model (CEM) user’s guide (US-EPA, 2016) proposes a method to estimate the mass transfer coefficient as
4. ℎ𝑚𝑚= 46.8 ×�2.5+𝑀𝑀𝑀𝑀3.31/3�2
hm is the mass transfer coefficient in m/h and MW the molecular weight in g/mol.
This model takes only diffusivity of the substance (which depends on the molecular weight MW) into consideration. Using this model, based on variation in the molecular weight, a range of mass transfer coefficients can be estimated:
Molecular weight
(g/mol) mass transfer coefficient (m/h)
20 5.7
100 3.0
300 1.8
600 1.3
Delmaar (2010) reviews a number of models to estimate the mass transfer coefficient for a flat surface. This review shows that these different models predict the mass transfer coefficient to be in a range of 2 to 16 m/h depending on the model used, the diffusivity of the
substance in air (thus molecular weight) and the air flow over the surface.
Default value for use in ConsExpo
The different methods and models applied in literature indicate that the mass transfer coefficient is in the order of 1 to 10 m/h, where the previously used default methods (the models of Langmuir and Thibodeaux) result in much higher estimates.
Therefore, a generic default value of 10 m/h is selected in ConsExpo. This generic default is usable for a situation where specific properties of the substance, the product and the indoor environment are not known. Another aspect of the model that needs to be specified is the release area, the area of the product from which the substance evaporates. The release area will change during the application of the product. Values for two input parameters need to be given:
• Release area: the total surface area on which the product is
applied.
• Application duration: the period during which the product is
applied.
Two modes are available for the release area:
• Constant. This option is appropriate if the substance is released
from a surface area that remains the same size over time; for example, the surface area of a bucket containing the product or the area of a board treated with a wood preservative.
• Increases over time. This option is appropriate when the area
from which the substance is released is not of a constant size. For example, when a wall is being painted, the surface area covered with paint from which the substance is released increases over time.
The release rate of the substance is determined by the temperature, substance properties and the mass transfer coefficient. Input is needed on:
• Temperature: the temperature at which the product is applied.
• Molecular weight and vapour pressure: the physicochemical
properties of the substance in question.
• Mass transfer coefficient: the rate at which the substance is
transferred between the product and the air. ConsExpo offers two models to approximate this rate: Langmuir’s method and
Thibodeaux’s method (see above).
Langmuir’s equation for the mass transfer coefficient is: 5a.
𝐾𝐾 = �𝑅𝑅 × 𝑇𝑇/(2𝜋𝜋 × 𝑀𝑀)
where:
K mass transfer coefficient [m/s]
M molecular weight of the substance [kg/mole]
R universal gas constant [J/mol/K]
T temperature [K]
Thibodeaux’s equation for the mass transfer coefficient is:
5b.
𝐾𝐾 =
12
× �0.018/𝑀𝑀
3
/60
where:
K mass transfer coefficient [m/s]
M molecular weight of the substance [kg/mole]
Molecular weight of the matrix:this parameter needs to be defined if the substance in question is not in its pure form, but part of a product. It is the average molecular weight of the rest of the total product (the product minus the substance in question). It is derived from the concentrations and molecular weights of the components of the product as:
6a. 𝐶𝐶𝑟𝑟𝑟𝑟𝑟𝑟𝑟𝑟 𝑀𝑀𝑟𝑟
=
(1−𝑤𝑤𝑓𝑓)×𝜌𝜌 𝑀𝑀𝑟𝑟= ∑
𝐶𝐶𝑖𝑖 𝑀𝑀𝑖𝑖 𝑎𝑎= ∑
𝑎𝑎𝑤𝑤𝑀𝑀𝑖𝑖×𝜌𝜌𝑖𝑖 from which 6b.𝑀𝑀
𝑎𝑎=
(1−𝑤𝑤𝑓𝑓) ∑𝑤𝑤𝑖𝑖 𝑀𝑀𝑖𝑖 𝑖𝑖where the summation index i is over all substances in the mixture except for the substance in question (ith component). M
i is the mol weight of the
i-th component and Mr is the mol weight of the (rest of the) matrix. If the
product consists largely of a single component (e.g. water) the mol weight matrix is roughly equal to the molecular weight of that component (e.g. 18 g/mol for water).
The evaporation of a substance from a layer of product is described by a set of two coupled differential equations:
7a. 𝑑𝑑𝐴𝐴𝑎𝑎𝑖𝑖𝑟𝑟 𝑑𝑑𝑡𝑡
= 𝐾𝐾 × 𝑆𝑆 ×
𝑀𝑀 𝑅𝑅𝑅𝑅× �𝑃𝑃
𝑒𝑒𝑒𝑒− 𝑃𝑃
𝑎𝑎𝑎𝑎𝑎𝑎� − 𝑄𝑄 × 𝑉𝑉
𝑎𝑎𝑟𝑟𝑟𝑟𝑚𝑚× 𝐶𝐶
𝑎𝑎𝑎𝑎𝑎𝑎 7b. 𝑑𝑑𝐴𝐴𝑝𝑝𝑟𝑟𝑜𝑜𝑝𝑝 𝑑𝑑𝑡𝑡= −𝐾𝐾 × 𝑆𝑆 ×
𝑀𝑀 𝑅𝑅𝑅𝑅× �𝑃𝑃
𝑒𝑒𝑒𝑒− 𝑃𝑃
𝑎𝑎𝑎𝑎𝑎𝑎� + 𝐴𝐴
𝑡𝑡𝑟𝑟𝑡𝑡/𝑇𝑇
𝑎𝑎𝑎𝑎𝑎𝑎× 𝑤𝑤
𝑓𝑓 where:Aprod mass substance in the product [kg]
Peq equilibrium vapour pressure [Pa]
Pair actual vapour pressure [Pa]
Vroom room volume [m3]
Q room ventilation rate (number of air changes per
time) [1/s]
Atot total amount of product used [kg]
Tapp application time [s]
wf weight fraction substance in product [fraction]
K the mass transfer coefficient defined above [m/s]
S surface area of the product [m2]
Equation 7a describes the amount of substance evaporating from the product into the air (first term) and the subsequent removal of the substance by ventilation of the room air (second term). The evaporation is driven by the difference between the vapour pressure in the room air Pair and the equilibrium vapour pressure of the substance in the product
Peq. If the product is (applied in) a mixture, the latter is approximated
by Raoult’s law: 8. ( vap ) C P eq C C P v M v r Mr = + , where:
Pvap saturated vapour pressure of the substance [Pa]
M molecular weight of the substance [kg/mole]
Cv concentration of the substance in the product [kg/m3]
Cr concentration of the rest of the material in the
product [kg/m
3] Mr average molecular weight of the rest of the material [kg/mole]
Note that Raoult’s law is valid only for ideal, non-interacting liquids and constitutes only an approximate description of a real situation.
If the product is the substance in a pure form, the Peq is equal to the saturated vapour pressure of the substance itself.
Equation 7b describes the change of substance in the layer of product. It consists of two terms. The first term describes the amount of product evaporating from the product into the room air and is minus the source term in equation 7a. The second term describes the increase in the amount of product due to application of the product, if applicable. When
a surface area is covered with an amount Atot of product in a time Tapp,
the amount of product applied per unit time is given by:
9.
dAp
A
/
T
tot
app
dt
=
Multiplication by the fraction wf of substance in the product gives the
increase in substance in the product layer.
If the surface area from which the substance evaporates is constant, as in the case of evaporation from an open can or from a previously treated surface, the second term is zero.
To simulate emission and exposure from a product used in dilution an additional factor is introduced: the dilution.
Dilution is expressed in ‘times’ : the number of times a substance is diluted (on weight basis). The equation that should be used to calculate the dilution is:
10. 𝑑𝑑𝑑𝑑𝑑𝑑𝑑𝑑𝑑𝑑𝑑𝑑𝑑𝑑𝑑𝑑𝑡𝑡𝑎𝑎𝑚𝑚𝑒𝑒𝑡𝑡=𝑡𝑡𝑟𝑟𝑠𝑠𝑠𝑠𝑒𝑒𝑠𝑠𝑡𝑡𝑎𝑎𝑎𝑎𝑜𝑜𝑎𝑎𝑎𝑎𝑟𝑟𝑎𝑎𝑎𝑎𝑟𝑟𝑑𝑑𝑝𝑝𝑝𝑝𝑡𝑡+𝑎𝑎𝑎𝑎𝑟𝑟𝑑𝑑𝑝𝑝𝑝𝑝𝑡𝑡𝑎𝑎𝑎𝑎𝑜𝑜𝑎𝑎𝑎𝑎𝑟𝑟𝑎𝑎𝑎𝑎𝑜𝑜𝑎𝑎𝑎𝑎𝑟𝑟
where:
dilutiontimes dilution [times]
solventamount amount of solvent [g]
productamount amount of product applied in the solution [g]
When dilution is used, the ‘product amount’ parameter is interpreted as the amount of diluted product applied on a surface. The dilution is used to calculate the weight fraction wfsolution in the solution from the weight fraction wf in the product as:
11. 𝑤𝑤𝑤𝑤𝑡𝑡𝑟𝑟𝑠𝑠𝑝𝑝𝑡𝑡𝑎𝑎𝑟𝑟𝑠𝑠=𝑑𝑑𝑎𝑎𝑠𝑠𝑝𝑝𝑡𝑡𝑎𝑎𝑟𝑟𝑠𝑠𝑤𝑤𝑓𝑓
𝑝𝑝𝑟𝑟𝑜𝑜𝑝𝑝𝑎𝑎𝑝𝑝𝑟𝑟
The air concentration of the substance is evaluated by numerical
integration of the system of equations 6a) and b). In case the product is the substance in pure form, equation 6a) become uncoupled of 6b) and emission is not automatically limited by the depletion of the substance from the liquid phase. In this case, the mass balance is checked in the numerical evaluation and emission is forced to be zero when the available substance has been depleted.
4.1.2 Exposure to Spray model
The Exposure to Spray model describes the indoor inhalation exposure to slowly evaporating or non-volatile substances in droplets or particles that are released from a consumer spray. For volatile substances, the Exposure to Vapour model is more appropriate even when the substance is released by a spray application. The Exposure to Spray model may also be used to describe products that give rise to airborne particulate matter inhalation, such as dusts or powders.
The Exposure to Spray model distinguishes between two release modes to model the release and distribution of the spray product in the indoor environment: the Instantaneous Release and Spraying modes.
4.1.2.1 Exposure to Spray: Instantaneous Release
In the Instantaneous Release mode, the sprayed material is assumed to be distributed homogeneously over the room air immediately upon release. After release, the substance is assumed to be removed by ventilation only.
The air concentration of the substance at time t for the Instantaneous Release mode is calculated as:
12. A qt C V
wf
o
air
e
− ××
=
where:Cair concentration of substance in the room air [kg/m3]
Ao released mass of the spray [kg]
wf weight fraction of the substance in the total product [fraction]
V room volume [m3]
q ventilation rate of the room (number of air changes per
time unit) [1/s]
4.1.2.2 Exposure to Spray: Spraying
The Spraying mode of the Exposure to Spray model was developed on the basis of the results of experimental work (Delmaar and Bremmer 2009). This mode takes into account the distribution of aerosol particles from spraying and the subsequent removal of these particles by
deposition and ventilation.
Of particular interest in the case of inhalation exposure to aerosols is the region in the respiratory tract where the aerosol particles are deposited. This deposition depends on many factors, such as the size of the particles, the breathing pattern and human physiology. Particles that are deposited in the higher airways (extrathoracic and tracheobronchial regions) are cleared by a system of cilia and mucous via the gastrointestinal tract, which leads to exposure via the oral route. Only the particles that are deposited in the alveolar region will reach the lung–blood barrier and give rise to inhalation exposure.
General exposure parameters needed for this model are:
• Spray duration: the net spraying time between start and finish
of spraying, not counting time between sprays.
• Exposure duration: the amount of time spent in the room
where the spraying is taking place.
• Room volume: the volume of the room where the spraying is
taking place.
• Room height: the height of the room where the spraying is
taking place.
• Spraying towards person option. This option is included to
account for situations in which a person is inside the spray cloud, as is the case in using hairsprays and deodorants. When selecting the model option ‘spraying towards person’ the user is given the option to specify the initial volume of the cloud. This volume is defined to be the volume of the cloud after 1 second.
Air concentrations may be inhomogeneous because the spray is released in a cloud. The exposure of a person will depend on his or her position relative to the cloud and the dispersion of the cloud.
The dispersion of the cloud depends on ventilation of the room, thermal sources in the room and movement of people through the room
(displacing the air inside it). In general, dispersion is in the order of a few minutes or less. As a simplification. in the ConsExpo Spray model the volume of the cloud after 1 second is assumed to further increase linearly in time until spraying stops or the cloud volume equals the volume of the room. It is assumed that during the use of the spray (the actual spraying) the breathing zone of the exposed person is located inside this volume. After spraying, the sprayed material is assumed to be homogeneously dispersed over the entire room.
The model requires values for the following product-specific parameters: • Mass generation rate: the amount of substance that will be
released from the spray container during the spraying per unit of time.
• Aerosol diameter distribution: the (mass-based) diameter
distribution of the aerosol particles or droplets immediately after they are sprayed. The user has a choice of two parametric distribution functions: normal and log normal. For both
distributions an average particle diameter (mean or median) and a width (standard deviation or coefficient of variation) have to be specified. In addition, the maximal particle diameter that is produced by the spray has to be given. This maximal particle diameter should not be set too high (preferably <50 µm), since only inhalable particles are relevant.
• Airborne fraction: the fraction of the non-volatile material that
becomes airborne after spraying as droplets. The airborne fraction will depend on the way in which the product is being used – i.e. in treating a surface (paint, wood preservative) or sprayed into the air (fly spray) – as well as on the aerosol diameter distribution that has been specified.
• Weight fraction substance: the fraction of the substance in
question in the product.
• Density volatile: the mass density of the total of
non-volatile substances.
• Inhalation cut-off diameter: the diameter below which the
sprayed particles can be inhaled and reach the lower areas of the lungs (the alveolar region). Aerosol particles with a diameter larger than this cut-off are assumed to be deposited in the higher parts of the respiratory tract and cleared via the gastrointestinal tract, leading to oral exposure. The inhalation cut-off diameter is only an approximation of the complicated process of deposition of particles in the lung. In practice, its value is suggested to be set at
around 10–15 µm. Currently, in the tool a default is provided of 15 µm.
Particle diameter distributions are in practice determined by a standardized method determining the light-scattering profile of the spray at some distance (often 30 cm) from the spray nozzle. It is assumed that at this point all of the substance has evaporated from the smaller particles (diameter <50 µm). This assumption seems to be adequate for these particles and for substances of moderate volatility. For larger particles and for less volatile substances such as water, this approximation will not be valid. It is therefore advised to specify particle diameter distribution functions for particles up to about 50 µm, which constitute the inhalable fraction of the particles.
The change in air concentration over time depends on the size of the sprayed particles, and calculations are performed for (size) distributions of particles.
The mass of particles with diameter δ is given by: 13.
M
( )
t
M
P
( , )
t d
tot
d
d
d
=
×
The particle mass distribution function P(δ,t) is determined from the initial distribution specified by the user P(δ,0).
In the ConsExpo Spray model the airborne particles are assumed to contain only non-volatile components, since moderately volatile substances will evaporate quickly from the smaller (inhalable) aerosol particles.
The total amount of material in the airborne particles is a combination of the fraction of non-volatile material that is contained in the specified particle distribution and the fraction of these particles that becomes airborne during application. This latter fraction will depend on the way the product is used, i.e. whether it is sprayed on a surface or directly into the room air. Thus, the total mass of the substance in particles that is being released from a spray per unit of time is given by:
14.
𝑅𝑅
𝑎𝑎𝑒𝑒𝑠𝑠𝑒𝑒𝑎𝑎𝑡𝑡𝑒𝑒= 𝑅𝑅
𝑡𝑡𝑎𝑎𝑎𝑎𝑎𝑎𝑠𝑠× 𝑤𝑤
𝑓𝑓 where:Rrelease rate of release of mass in aerosol particles [kg/s] Rspray rate of release of sprayed product [kg/s] wf weight fraction of the substance in the product [fraction] From this, a fraction
15.
𝑅𝑅
𝑎𝑎𝑎𝑎𝑎𝑎𝑎𝑎𝑟𝑟𝑎𝑎𝑠𝑠𝑒𝑒= 𝑅𝑅
𝑎𝑎𝑒𝑒𝑠𝑠𝑒𝑒𝑎𝑎𝑡𝑡𝑒𝑒× 𝑤𝑤
𝑎𝑎𝑎𝑎𝑎𝑎𝑎𝑎𝑟𝑟𝑎𝑎𝑠𝑠𝑒𝑒becomes actually airborne and available for inhalation. Here: fairborne airborne fraction of material [fraction]
Multiplying this mass generation rate of airborne particles by the normalized initial distribution yields the mass release rate per particle diameter.
16.
𝑅𝑅
𝑎𝑎𝑎𝑎𝑎𝑎𝑎𝑎𝑟𝑟𝑎𝑎𝑠𝑠𝑒𝑒(𝛿𝛿) = 𝑅𝑅
𝑎𝑎𝑒𝑒𝑠𝑠𝑒𝑒𝑎𝑎𝑡𝑡𝑒𝑒× 𝑤𝑤
𝑎𝑎𝑎𝑎𝑎𝑎𝑎𝑎𝑟𝑟𝑎𝑎𝑠𝑠𝑒𝑒× 𝑃𝑃(𝛿𝛿, 0)𝑑𝑑𝛿𝛿
The particles that are released from the spray are assumed to be evenly distributed over a volume V, which can be either the cloud volume or the room volume.
Particles with diameter δ are removed from the room air by gravitational precipitation and by ventilation of room air.
The velocity vs at which particles fall to the floor is given by Stokes
settling velocity: 17.
2
18
g
droplet
v
SC
s
r
d
η
=
×
where: G gravitational acceleration [m/s2]ρdroplet (average) mass density of the particle [kg/mole]
Η air viscosity [N s/m2]
SC Cunningham slip correction factor, which is only important for particles with a diameter of <1 µm. It is taken to be 1 in the model
Within a time dt the number of particles that reach the floor (and are thus removed from the air) is given by:
18.
C
( )
S v
( )
air
d
× ×
s
d
where: Cair
(δ) concentration of mass of particles with diameter δ [kg/m 3]
S surface area of the floor onto which the particles fall [m2] The mass that is being removed by ventilation per unit of time is given by:
19.
C
( )
V
q
air
d
× ×
vent
where:
qvent ventilation rate of the room in number of air changes per
unit time [1/s]
V volume of the room [m3]
During spraying the mass of particles with diameter δ generated is given by Rairborne.