Post-launch monitoring of novel
foods/ingredients (revised version)
methodology applied to additive stevia
RIVM Letter report 090432001/2014[Revised version – September 2014] M. Brosens et al.
Colophon
© RIVM 2014
Parts of this publication may be reproduced, provided acknowledgement is given to: National Institute for Public Health and the Environment, along with the title and year of publication.
This is a publication of:
National Institute for Public Health and the Environment
P.O. Box 1│3720 BA Bilthoven The Netherlands
www.rivm.nl/en Marinka Brosens
,
RIVM Marieke Hendriksen,
RIVM Maryse Niekerk,
RIVM Liesbeth Temme,
RIVM Joop van Raaij, RIVMContact: Joop van Raaij VPZ
joop.van.raaij@rivm.nl
This investigation has been performed by order and for the account of Nederlandse Voedsel en Warenautoriteit (NVWA), within the framework of kennisvraag 9.4.32
ERRATUM - RIVM Letter Report 090432001/2014
In this revised Letter Report the intake of Stevia is assessed for two food
(including supplements and sweeteners) intake scenarios. The results differ from the results in the original Letter Report because of three modifications. The main modification concerns the wrongly used database on sweetener consumption as included in the Dutch National Food Consumption Survey (DNFCS). The other two modifications are minor and deal with more consistent calculations in worst-case scenarios.
With respect to the main modification, we used the wrong units for the data on sweetener consumption available from the DNFCS database. We used the figures in weight units instead of in numbers (e.g. number of tablets). The consequence of this mistake is that the steviol glycoside intake from sweeteners had strongly been overestimated.
The first minor modification concerns assumptions on three quantities related to sweeteners. People may consume table top sweeteners in three different
matrices: as tablets, as liquid, and as powder. Within each matrix, there are variations in weight per dose, in concentration level of steviol glycosides in the matrix and in the purity of the steviol glycoside preparation used. In the original Letter Report we used as much as possible the information on these three quantities as provided by producers. However, because of incomplete data and in order to perform strict worst-case calculations, in the revised version we have used the most conservative values for these three quantities. In addition, the results on the tablet and the liquid matrix have been separated from each other. The consequence of using the modified assumptions on these three quantities is that the estimated intake of steviol glycosides in the scenarios will be higher than with previously used values for the three quantities.
The second minor modification concerns the assumption on the conversion factor from steviol glycosides to steviol equivalents. The ADI (acceptable daily intake) for glycosides is expressed in steviol equivalents. The conversion factor however depends upon the type of glycosides. The mixture of steviol glycosides added to foods or used in sweeteners may vary substantially. In the original Letter Report we used as much as possible the information as given by producers. However, because of incomplete data on mixtures used and in order to perform more strict worst-case calculations, we have used a conservative conversion factor 0.4 for foods as well as sweeteners. The consequence of using this conversion factor is that the estimated intake of steviol equivalents will be higher than previously calculated
The three modifications have substantial consequences for the estimated daily intake of steviol equivalents. For adults the intake has become substantially lower, with as a consequence that the percentage that exceeds the ADI has reduced to lower than 1%. For the youngest age group (2-6 years) the estimated intake has increased a bit because of the more conservative
assumptions, with as a consequence that the percentage that exceeds the ADI in the worst case scenario would be 5.9% (in previous report 4.7%). For these children, nearly 80% of the daily intake comes from water-based flavoured drinks. The modifications have also effected the contribution of foods and sweeteners to daily intake, especially for adults. For adults the main contributor is water-based flavoured drinks (58%) followed by table top sweeteners as tablets (20%) and as liquid (8%).
The three modifications have substantially influenced the values in table 1 in Chapter 3.4, the values in the tables 3 to 5 and the figures 7 and 8 in Chapter 6, and the values in Appendices I and II. This also meant that the accompanying
text of Chapters 3.4 and 6 had to be rewritten. Since the main findings have changed, parts of Chapter 7 and the Abstract and the ‘Rapport in het kort’ also had to be updated. No changes were made in Chapters 1 to 5 (except for Chapter 3.4).
Rapport in het kort
Methode voor post-launch monitoring van nieuwe voedingsmiddelen toegepast op additief Stevia
Het RIVM heeft een methode ontwikkeld waarmee in kaart kan worden gebracht welke producten een bepaald ingrediënt bevatten, en zo ja in welke
hoeveelheden (‘post-launch monitoring’). Het gaat hierbij om producten die na mei 1997 op de Europese markt zijn verschenen en waarvoor beoordeeld moet worden of ze veilig zijn om op de markt te mogen worden toegelaten -
zogenoemde nieuwe voedingsmiddelen en voedselingrediënten.
De methode is in opdracht van de Nederlandse Voedsel- en Warenautoriteit (NVWA) ontwikkeld. Als testcase is de aanwezigheid van het in de markt
opkomende additief Stevia onderzocht. Deze natuurlijke zoetstof zit bijvoorbeeld in zoetjes, limonade en frisdranken en drinkyoghurt. De methode is bruikbaar gebleken en in totaal is in 37 merken het Stevia-extract steviolglycosiden geïdentificeerd.
Vervolgens is met twee scenario’s geschat hoeveel van deze stof mensen binnenkrijgen (inname): het worst-case scenario en het ‘25 procent-marktaandeel’ scenario. Het worst-case scenario gaat ervan uit dat alle
producten die in productcategorieën zitten waarin het nieuwe voedselingrediënt is geïdentificeerd, de stof ook daadwerkelijk bevatten en dan tot het hoogste niveau dat in het product gemeten is of dat producenten hierover hebben gerapporteerd. Bij dit scenario wordt de aanvaardbare dagelijkse inname (ADI) voor Stevia bij ongeveer 6 procent van jonge kinderen (2-6 jaar) overschreden, en bij minder dan 1 procent van de oudere kinderen en de volwassenen. Het 25 procent-marktaandeel scenario is een realistischere schatting. Bij dit scenario wordt de ADI bij minder dan 2 procent van de jonge kinderen overschreden. Bij oudere kinderen en volwassenen werden in dit scenario geen overschrijdingen geconstateerd.
Het is niet duidelijk of deze mate van overschrijdingen feitelijke risico’s voor de gezondheid van jonge kinderen met zich meebrengen. Regelmatige monitoring van de Stevia inneming blijft gewenst, vooral omdat verwacht wordt dat Stevia aan meer producten en soms in hogere concentraties zal worden toegevoegd.
Abstract
Post-launch monitoring of novel foods/ingredients Methodology applied to additive Stevia
The National Institute for Public Health and the Environment (RIVM) developed a method to monitor in what foods and to what levels an ingredient is added (concept of post-launch monitoring). The method deals with foods that were introduced on the European market after May 1997 and for which it is required to assess whether they are safe for introduction on the market, so-called novel foods and novel food ingredients.
The method was developed by order and for the account of the Dutch Food and Consumer Product Safety Authority (NVWA). As a case study, introduction on the market of the emerging food additive Stevia was investigated. This natural sweetener is added among others to tabletop sweeteners, flavoured drinks, and milk drinks. The method has appeared to be feasible and the stevia-extract steviol glycosides was identified in 37 brands.
With two scenarios we estimated the intake of Stevia: the worst-case scenario and the ‘25%-market share’ scenario. The worst-case scenario assumes that all food products in those food categories to which the novel food ingredient is actually added, contain the novel food ingredient and to the maximal reported or measured level. In this scenario, the Acceptable Daily Intake (ADI) for Stevia was exceeded in about 6% of the young children (2-6 years of age) and in less than 1% of the older children and the adults. The 25%-market share scenario gives a more realistic estimation. In this scenario, the ADI was exceeded in less than 2% of the young children. Among older children and adults, no exceeding was observed in this scenario.
It is unclear whether exceeding the ADI to these levels can involve health effects in young children. Regular monitoring of Stevia intake remains warranted, especially because it is expected that Stevia will be added to more foods and in higher concentration levels.
Contents
1
Introduction − 11
1.1
Relevance of post-launch monitoring of novel foods/ingredients − 11
1.2
Aim of the project − 12
1.3
Outline report − 12
2
Proposed method of post-launch monitoring − 13
2.1
Identification of specific novel foods on the Dutch market − 13
2.2
Quantification of the novel food ingredients in the foods − 15
3
Case study: Stevia Rebaudiana − 17
3.1
Stevia as additive and its ADI − 17
3.2
Monitoring foods containing steviol glycosides − 17 3.2.1
Search in food database INNOVA − 17
3.2.2
Search at internet − 19 3.2.3
Search at news sites − 19 3.2.4
Search in supermarket − 19
3.3
Collecting concentration levels of steviol glycosides in food products − 19
3.4
Received concentration levels of steviol glycosides − 21
4
Evaluation of post-launch monitoring of novel foods/ingredients − 27
5
Proposed method for intake estimation − 33
6
Scenario analyses Stevia Rebaudiana − 35
7
Evaluation of the method to assess intake of novel foods/ingredients applied to the additive Stevia Rebaudiana − 41
8
References − 45
Appendix I − 47
Appendix II − 53
1
Introduction
1.1 Relevance of post-launch monitoring of novel foods/ingredients
Novel foods have to be officially approved through the novel food authorization procedure before introduction on the European market. The concerning
European Regulation 258/97 defines novel foods as food products and food ingredients that have not been consumed to a significant degree in the European Union before May 1997. The Regulation was established to guarantee that consumption of novel foods and novel food ingredients should be safe for
consumers. The Regulation does not cover food additives falling within the scope of Council Directive 89/107/EEC. Since 2003, foods consisting of, or produced with, genetically modified organisms are not included in Regulation (EC) 258/97.
According to the novel food authorization procedure the applying company must present scientific information and a safety assessment report of the novel food to an EU country food safety authority. For details on the application procedure we refer to the website of the Botanicals and Novel Food Unit of the MEB (Medicines Evaluation Board) (www.cbg-meb.nl). Important aspects of the evaluation include that the product should be well described and that the safety and nutritional aspects are scientifically sound assessed. The company must also provide an estimation of the expected use of the novel food or ingredient in foods as well as the expected intake.
Since 1997, many novel foods or novel food ingredients are authorized to be launched on the European market. In the Decision of the European Commission to the manufacturer the novel food or novel ingredient is specified in an Annex of the Decision and it is indicated in what products and to what levels the novel foods or ingredients are allowed. Once a novel food or novel ingredient has been approved, other manufacturers may also apply for approval of their similar products according to a notification procedure. The company notifies the Commission about their marketing a novel food or ingredient based on the opinion of a food safety assessment body that has established "substantial equivalence". It also happens that a company is asking for extension of the number of food groups to which the novel food or novel ingredient might be applied.
The consequence of this might be that the actual use of a novel food or novel ingredient might become substantial higher than thought by the first applying manufacturer. This may also mean that the safety of the novel food or novel ingredient is no longer guaranteed. For that reason, the national competent food safety assessment authorities have often plied for post-launch monitoring. The concept of post-launch monitoring was applied to functional foods in previous studies [1-3]. In these studies post-launch monitoring consisted of the following phases: 1) passive signaling of consumer complaints, 2) active signaling of hazardous effects based on active investigation research data, 3) assessment of relevance of the data from point 1 and 2, 4) quantification of the hazardous effects on a population level, 5) balancing beneficial and hazardous
effects, and 6) regulation. Unfortunately, at this moment there is not yet a generally accepted method to monitor the post-launch presence of novel foods or ingredients on the market to judge whether the actual consumption stays within the anticipated range.
1.2 Aim of the project
1. To develop a method to monitor which novel foods or novel food ingredients are introduced to the Dutch market and to what level (post-launch monitoring), and to apply the developed method to one novel food ingredient in order to test the method and to say something about the introduction of one novel food ingredient on the Dutch market. 2. To develop a method to estimate actual daily intake of novel foods or
novel food ingredients, and to apply the developed method to one novel food ingredient in order to test the method and
to report the intake of one
novel food ingredient in the Dutch population.
1.3 Outline report
We describe the development of the method for the post-launch monitoring in Chapter 2, and we have summarized the method in a flow chart. As suggested by the Dutch Food and Consumer Product Safety Authority (NVWA) we took as example Stevia Rebaudiana to apply the new methodology (Chapter 3). Stevia is not approved as novel food or novel ingredient, but it is approved as additive, also with a maximum allowed daily intake. Therefore, for Stevia Rebaudiana the same methodology for post-launch monitoring might be applied as to novel foods or novel ingredients. In Chapter 4 we evaluate the usefulness of the method.
In Chapter 5 we describe a method to estimate the actual daily intake of novel foods or novel food ingredients. This methodology is applied to Stevia
Rebaudiana (Chapter 6) and in Chapter 7 we evaluate our method to assess the intake of novel food ingredients applied to the additive Stevia Rebaudiana.
2
Proposed method of post-launch monitoring
Our systematic approach consisted of two phases: 1) identification of specific novel foods that are currently on the Dutch market and 2) the quantification of the level of novel food ingredients used. The first phase includes 4 steps and the second phase 3 steps.
2.1 Identification of specific novel foods on the Dutch market
Suppose that we are interested in the post-launch market situation of a specific novel food or novel food ingredient. Such specific novel foods might be identified from appropriate food databases, if available. An ideal database contains all foods that are currently available on the market, so also including foods that have been launched very recently. In addition, such a database should also contain information on food name, brand, ingredients and nutritional values. Unfortunately, such an ideal database does not exist in the Netherlands.
The Dutch National Food Composition database (NEVO) cannot be used to identify novel foods, as it may not include information on recently introduced foods and it often works with combined values for food codes. Other food databases, such as ‘PS in food service’, includes recently introduced foods to the Dutch market, but only provides information for a limited range of foods. Other databases with information on more foods are available by subscription. Examples are Levensmiddelendatabank (Eng: Food Database) (however, no information on ingredients is given), the Mintel database (worldwide; many foods from many but not all shops) and the INNOVA database (also worldwide, including label text and pictures, many but not all foods from many but not all shops, easy to use). The INNOVA database clearly offers the best options for the intended purpose. Some websites also provide information for consumers to compare several brands of foods. For example, the Dutch Boodschapp contains information on Dutch foods, but it only includes a limited range of foods and no ingredients.
Taken all these considerations into account, we decided to use the INNOVA database as the starting database for our search strategy.
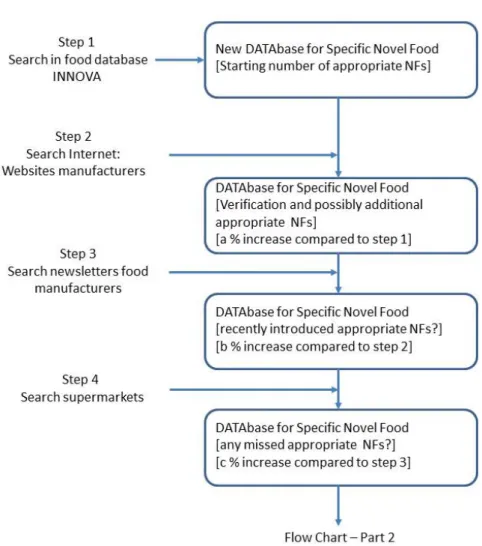
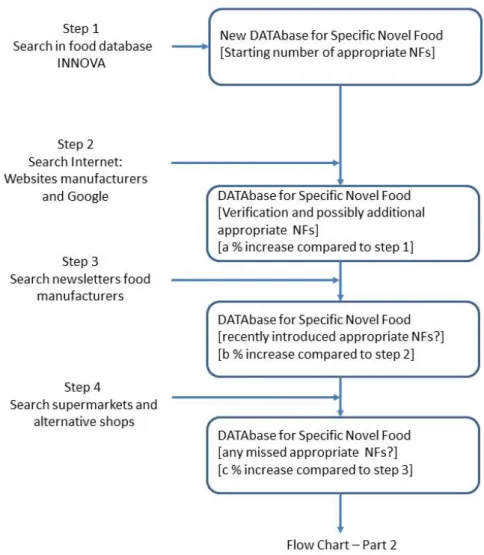
In our search strategy for identification of specific novel foods/ingredients, we distinguish four steps.
First, we search in the INNOVA database (see Step1 in Figure 1 [Flow Chart – Part 1]). The identified foods are saved in a new DATAbase . The columns in the DATAbase are: product ID, company, company’s website, retailer, picture of the product, event date (when is the product added to the INNOVA database or found otherwise), product brandname including flavour, product description, ingredients, nutritional details, for additives: category number of Annex II of the EU Regulation. The DATAbase is based on the output of INNOVA database. To verify whether the novel foods identified from INNOVA are still on the market, websites of the food manufacturers are visited (Step 2). This search on the websites may also result in identification of additional novel foods. These additional foods are added to the DATAbase. Step 3 comprises a search in
newsletters of food industry, e.g. VMT-news, EVMI-news (both in Dutch). Such newsletters often report on recently introduced foods that may not have been included in the INNOVA database yet. The final step is to search for possibly missed novel foods that are sold in supermarkets. This search consists of looking at foods on the shelves and reading the labels.
2.2 Quantification of the novel food ingredients in the foods
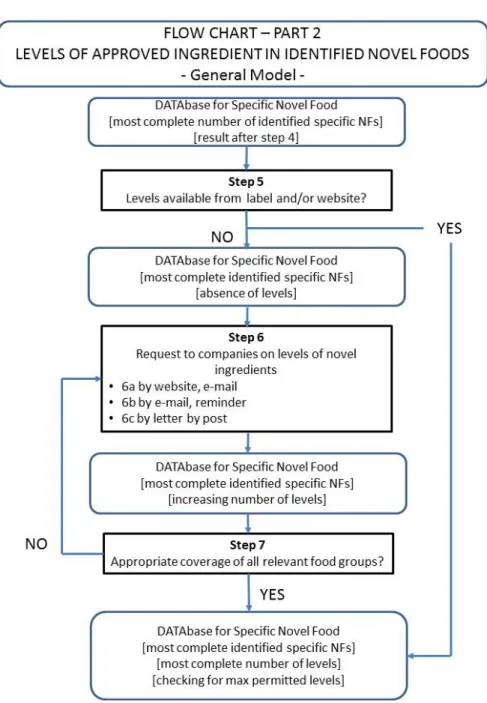
Once the novel foods with the novel ingredient have been identified, the level of the novel food ingredient should be quantified. If this information is available from the food labels or websites, then the DATAbase can be finalised in order to be used for novel food ingredient intake calculations (see step 5 in Figure 2 – Flow Chart – Part 2). However, if this information is not available, then the information is to be collected from the food manufacturers.
Figure 2: Levels of approved ingredient in identified novel foods.
A standardized letter is to be composed describing the aim and the relevance of the project and the request to provide the information on the level to which the
novel food ingredient is applied by the company in the various types of foods of the company (see step 6 in Figure 2). Each company gets a company-specific letter that includes the company’s products with the novel ingredient as found by us in our searching strategy. An English version of the letter is to be composed for the non-Dutch produced foods.
As a first sub-step, the letter might be submitted to the contact forms on the companies’ websites or to the email address indicated on the website. An additional phone call might help to be sure that the email has arrived. If there is no response after a few weeks, a second reminder can be send by email. If again there will be no response, the letter might be sent to the company’s postal address.
Probably it will not be possible to get the requested information from all food manufacturers. However, it is more crucial that in the end, for each type of novel food, there should be a more or less representative range of level of application of the novel food ingredient. If the levels of novel food ingredients in a specific food group remain unknown, the maximum permitted levels will be used.
After all collected levels of the novel food ingredient have been added to the DATAbase, it is to be checked that the levels do not exceed the maximum permitted levels for that food category.
Subsequently the DATAbase might be used as input for the novel food ingredient intake calculations.
3
Case study: Stevia Rebaudiana
3.1 Stevia as additive and its ADI
Plant-derived components are widely used as natural sweeteners [4]. Stevia Rebaudiana (Bertoni) is a sweet herb found in South America. Purified extracts of Stevia Rebaudiana Bertoni containing stevioside and rebaudioside A are increasingly used as sweeteners and as dietary supplements.
In 2000, Stevia Rebaudiana Bertoni plants and dried leaves were refused as novel food or novel food ingredient [5], as the toxicological data were
considered to be insufficient to assess their safety. Since December 2011, stevia in the form of purified extracts from the plant, steviol glycosides, is approved as food additive [6].
The European Food Safety Authority (EFSA) established an Acceptable Daily Intake (ADI) for steviol glycosides, expressed as steviol equivalents, of 4 mg/kg bodyweight/day [7]. It was stated that it is likely that the ADI would be
exceeded for high-level consumers and children at the maximum proposed use levels. Additionally, EFSA concluded that rebaudioside A would not give rise to safety concerns at the estimated level of intake arising from its use as flavouring substance [8].
Therefore, Tijhuis et al. [9] performed scenario analyses in children aged 2-6 years. A worst-case and a 10%-market share scenario were calculated. The ADI was exceeded by 37.5% and 0.3% of the children in the worst-case and 10%-market share scenario, respectively. Water-based flavoured drinks contributed most to exposure to steviol glycosides in children. Contrary to this study, in our study we use maximum reported levels of steviol glycosides compared to the maximum permitted levels in the study by Tijhuis et al. [9].
It is obvious that developments in actual steviol glycosides intakes are important to know. Have steviol glycosides been introduced to more products? Do
manufacturers really use the maximal amount that is allowed for the food category? What do we know of the market share of steviol glycosides containing products?
3.2 Monitoring foods containing steviol glycosides
We followed the systematic approach to identify foods containing steviol glycosides using the flow chart in Figure 3.
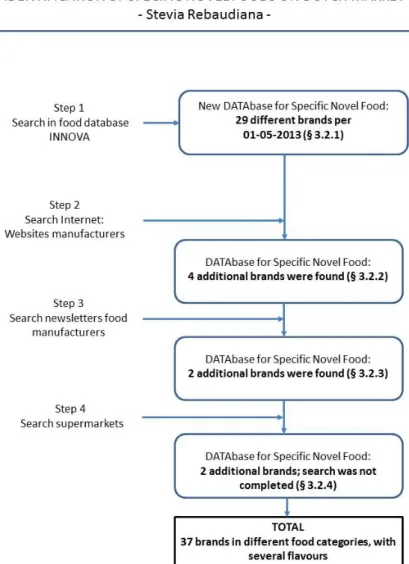
3.2.1 Search in food database INNOVA
Steviol glycosides containing food products are labelled as stevia, steviol
glycosides, stevia rebaudiana extract or E960. At 25 April 2013 we searched the INNOVA database using the following key words: [country] “The Netherlands” AND [free text (search in ingredients, name, and other texts on the label)] “steviol”. We did the same for free text words “stevia”, “rebaud” and “E960”.
The search results were exported to a new DATAbase. We identified 23 brands for steviol, 21 brands for stevia, 5 brands for rebaud and 0 brands for E960. Some brands were identified more than once using the different search strategies. In total, we identified 29 different brands. We counted several flavours of the same type of food as one single brand. Using this definition for one single brand, gives the best view on the number of products, since flavours and package sizes change over time.
The first product was introduced on the market in September 2009. From 2009 to 2011, one brand was added to the INNOVA database each year. In 2012, 21 new brands were included and in the first 4 months of 2013, 5 brands were added and several new flavours for existing brands were launched on the market. In total 29 brands were found (step 1).
3.2.2 Search at internet
We checked whether the brands found in INNOVA are still on the market by searching websites of the producers. In addition, these websites could contain more new products containing steviol glycosides. Flavours from three brands from INNOVA database could not be found on company websites. These were replaced by other flavours. We identified 4 additional brands (including several flavours) and added them to the DATAbase.
3.2.3 Search at news sites
We searched in May 2013 for newly introduced food products at the EVMI website and the Stevia archive of VMT news site. We identified 5 possible brands (some brands would be available in several flavours). We verified the company websites whether the food products were already for sale. We could not find the food introduction of 3 brands. Two brands including several flavours were available at the company’s websites and added to the DATAbase.
3.2.4 Search in supermarket
One large supermarket was visited on 28 May 2013 in order to find the brands mentioned at the news sites and possible other new foods with stevia
rebaudiana. We chose one (Jumbo) of the three largest supermarket chains in The Netherlands (Jumbo, C1000, Albert Heijn). Another supermarket (Boni) was visited to find a specific brand of syrup that was mentioned at VMT news site. Based on the food categories that contain most products with steviol glycosides, we read labels of food products that contained the words ‘less sugar’, ‘stevia’, ‘light’, that had the health logo ‘Vinkje’ (Choices), or had lower calories per portion compared to similar products. Most food products were already identified through the INNOVA database search or through internet (6 brands). We found 2 new brands (6 flavours). Due to time limitations, it was not feasible to search for all products in all food categories in which steviol glycosides are allowed.
All additional food products were added to the DATAbase with the food products from the INNOVA database search. Thus, in total 37 brands in different food categories (with several flavours) containing steviol glycosides were found until May 2013.
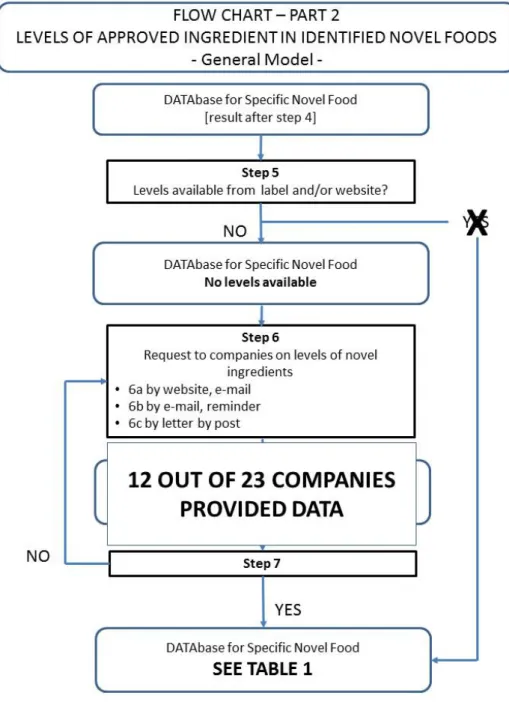
3.3 Collecting concentration levels of steviol glycosides in food products Concentration levels of steviol glycosides were not reported at the food labels available in INNOVA database or at the website of food companies (see Figure 4, step 5). We therefore sent a request to all food companies to provide us the levels of steviol glycosides in the identified food products. Not only Dutch but also international companies were approached. We filled in the contact forms of the company’s website using a standardized letter describing the aim of the project and the food products containing steviol glycosides. If no contact form was present on the website, the company was approached by e-mail or
telephone. Three companies were approached by e-mail and one company was approached by telephone. We approached in total 23 individual companies.
Figure 4: Levels of approved stevia Rebaudiana in identified novel foods. After 3 weeks, the positive response rate was low. Four companies provided us with steviol glycosides concentration levels and six companies did not want to participate in our study. An important reason not to cooperate with the study
We therefore submitted the reminder at the contact forms of the company’s website, explaining the aim of the project in more detail. In addition, we indicated that in our report, the concentrations provided could not be traced back to the brand name and the name would not be mentioned in the report. This reminder led to additional data of one company, although this company told us that their food products were only for sale on the Swedish and German market.
One week later, a second reminder was sent. Again, we adapted this reminder. It was explicitly stated that the food products could not be traced to the brand name and that the steviol glycosides concentration levels would only be known at RIVM in order to guarantee confidentiality. Furthermore, we mentioned in the second reminder that we already received data from several companies and that we would regret not being able to include concentration levels on steviol
glycosides from their food products. The second reminder resulted in steviol glycosides concentration levels from two extra companies.
Finally, an official letter was sent by post to the companies that did not respond. This resulted in response from five additional companies.
3.4 Received concentration levels of steviol glycosides
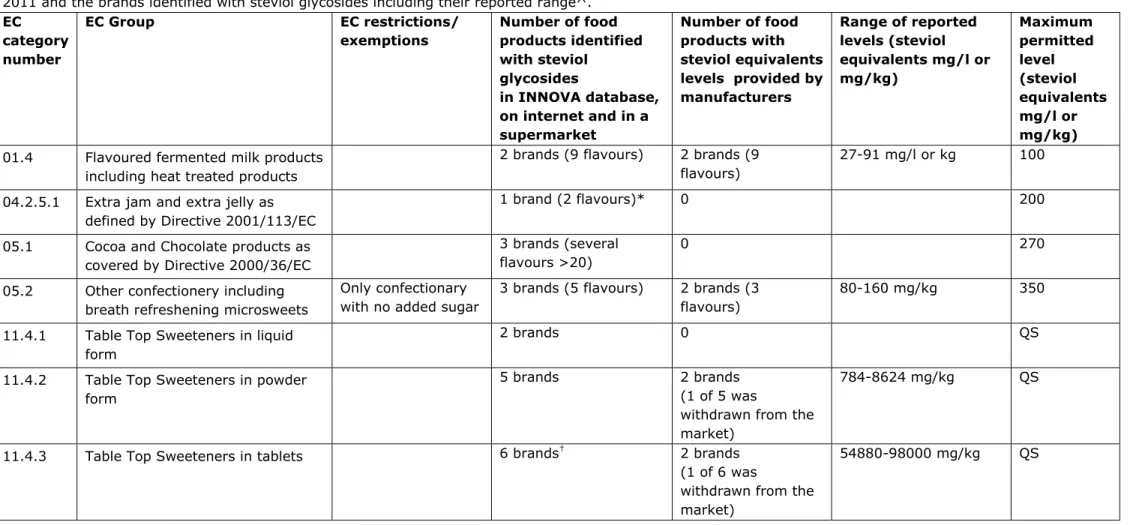
Table 1 shows the food categories in which steviol glycosides are authorized by the European Regulation (EU) NO 1131/2011 [6] and the brands identified with steviol glycosides. In Appendix I all food categories in which steviol glycosides are authorized by the European Regulation are shown. Steviol glycosides are permitted in 14 food categories, but appeared to be used in 7 categories. Most brands with steviol glycosides are found in the food categories flavoured drinks (7), table top sweeteners (13) and fruit nectars (4).
In total, 12 out of 23 companies (52%) provided us with data on the steviol glycosides concentration levels in 12 brands of the in total 37 brands. Three brands of the 37 brands were already withdrawn from the market.
We received steviol glycoside concentration levels in the food categories fruit nectars (1 out of 4 brands), flavoured drinks (2 out of 7 brands), flavoured fermented milk products (2 out of 2 brands), dietary food for weight control diets (1 out of 1 brand) and food supplements supplied in a syrup-type or chewable form (1 out of 1 brand) (Table 1). We did not receive data about steviol glycoside concentrations in the food categories cocoa and chocolate products, and extra jam and jelly.
The received steviol glycoside concentration levels were converted into steviol equivalents. Three companies provided us with data on the type of steviol glycoside. The others only provided the steviol glycoside concentrations. The ADI (acceptable daily intake) for steviol glycosides is expressed in steviol equivalents. The conversion factor depends upon the type of glycoside. The most general steviol glycosides added to foods are Rebaudioside A (with a conversion-factor of 0.33) and Stevioside (with a conversion factor of 0.40) [7]. In practice, mixtures of steviol glycosides will be used with an overall conversion
factor between 0.33 and 0.40. Since we often do not know the composition of the steviol glycosides mixtures used, and since our scenarios are designed as worst-case scenarios, we used the conversion factor of 0.40 for all the food groups on which we collected information from producers (see table 1).
We only show food categories in which we found foods with steviol glycosides. The reported levels on steviol equivalents are all below the maximum permitted levels (table 1) except for two dietary food products for weight control diets that have concentrations above the maximum permitted level (270 mg/kg) (see table 1).
Additionally, we found food products in categories that were not permitted, as shown in Table 2. Tea and syrups with steviol glycosides are not allowed.
2011 and the brands identified with steviol glycosides including their reported range^. EC category number EC Group EC restrictions/ exemptions Number of food products identified with steviol glycosides in INNOVA database, on internet and in a supermarket Number of food products with steviol equivalents levels provided by manufacturers Range of reported levels (steviol equivalents mg/l or mg/kg) Maximum permitted level (steviol equivalents mg/l or mg/kg) 01.4 Flavoured fermented milk products
including heat treated products
2 brands (9 flavours) 2 brands (9 flavours)
27-91 mg/l or kg 100 04.2.5.1 Extra jam and extra jelly as
defined by Directive 2001/113/EC
1 brand (2 flavours)* 0 200
05.1 Cocoa and Chocolate products as covered by Directive 2000/36/EC
3 brands (several flavours >20)
0 270
05.2 Other confectionery including breath refreshening microsweets
Only confectionary with no added sugar
3 brands (5 flavours) 2 brands (3 flavours)
80-160 mg/kg 350 11.4.1 Table Top Sweeteners in liquid
form
2 brands 0 QS
11.4.2 Table Top Sweeteners in powder form
5 brands 2 brands (1 of 5 was
withdrawn from the market)
784-8624 mg/kg QS
11.4.3 Table Top Sweeteners in tablets 6 brands† 2 brands
(1 of 6 was
withdrawn from the market)
category number
exemptions products identified
with steviol glycosides in INNOVA database, on internet and in a supermarket products with steviol equivalents levels provided by manufacturers levels (steviol equivalents mg/l or mg/kg) permitted level (steviol equivalents mg/l or mg/kg) 13.3 Dietary foods for weight control
diets intended to replace total daily food intake or an individual meal (the whole or part of the total daily diet)
1 brand (2 flavours) 1 brand (2 flavours) 345-404 mg/kg 270
14.1.3 Fruit nectars as defined by Directive 2001/112/EC and vegetable nectars and similar products
4 brands (7 flavours) 1 brand (1 flavour ) (1 of 4 was
withdrawn from the market)
31 mg/l 100
14.1.4 Flavoured drinks 7 brands (16 flavours) 2 brands (3 flavours) (1 of 7 was
withdrawn from the market)
44-60 mg/l 80
17.3 Food supplements supplied in a syrup-type or chewable form
1 brand 1 brand 401 mg/kg 1800
EC= European Commission, QS= Quantum Satis
^ Food categories for which no foods with steviol glycosides were found, are not shown.
* It is unclear whether the food item should be categorized as “Extra jam and extra jelly as defined by Directive 2001/113/EC” or as “Jam, jellies and marmalades and sweetened chestnut puree as defined by Directive 2001/113/EC”
NO 1131/2011 Food category number EC Group EC restrictions/ exemptions Number of food products identified with steviol glycosides in INNOVA database, on internet and in a supermarket Number of food products with steviol equivalents levels provided by manufacturers Range of reported levels (steviol equivalents mg/l or mg/kg) Maximum level (steviol equivalents mg/l or mg/kg)
11.2 Other sugars and syrups Not applicable 1 brand (3 flavours) 0 Not allowed
14.1.5 Coffee, tea, herbal and fruit infusions, chicory; tea, herbal and fruit infusions and chicory
extracts; tea, plant, fruit and cereal preparations for infusions, as well as mixes and instant mixes of these products
Not applicable 1 brand 0 Not allowed
4
Evaluation of post-launch monitoring of novel
foods/ingredients
We developed a method of post-launch monitoring consisting of 7 steps. This method was applied to a case study on Stevia Rebaudiana. In this chapter, we evaluate the method of launch monitoring and adapt the method of post-launch monitoring for future research.
The method of post-launch monitoring was also applied to functional foods in previous studies [1-3]. The following phases were included in their method of post-launch monitoring: 1) passive signaling of consumer complaints, 2) active signaling of hazardous effects based on active investigation research data, 3) assessment of relevance of the data from point 1 and 2, 4) quantification of the hazardous effects on a population level, 5) balancing beneficial and hazardous effects, and 6) regulation. The objective of their system was to systematically monitor (un)expected health effects of functional food consumption after
marketing, whereas our objectives focused on monitoring of specific novel foods and quantifying levels of novel food ingredients.
Firstly, we will discuss our findings on the identification of specific novel foods on the Dutch market based on the case study Stevia Rebaudiana (Figure 1 [Flow chart-Part 1]). We identified currently available steviol glycosides-containing food products on the Dutch market by searching the INNOVA database, the internet and the supermarket. The INNOVA database search already retrieved the majority of steviol glycosides-containing food products currently on the market, and was useful to identify the most important food categories in which steviol glycosides were used. Within the scope of this project, the INNOVA database is very useful as it includes new product introductions. Steviol
glycosides were introduced as food additive in December 2011 and therefore it is reasonable to assume that food products with steviol glycosides are already included in the INNOVA database.
However, the INNOVA database does not monitor whether food products are withdrawn from the market. In the present example, we observed that some food products that were in the INNOVA database could not be found at the website of the brand or in the supermarket. Therefore, the complementary search at internet or in the supermarket is necessary to determine which food products are still for sale. In addition, the internet search proved to be useful to find additional food items or different flavours that are not included in the INNOVA database. A supermarket search instead of a search in the INNOVA database is not recommended, because it is more time consuming and does not yield more food products compared to using the INNOVA database.
During the case study, we received information from the NVWA that also pointed to other shops than supermarkets. It is possible that some novel
foods/ingredients are for sale in alternative shops (e.g. Kruidje roer me niet) rather than in supermarkets. The food products sold in these shops are not well represented in INNOVA database. Also it turned out that stevia products are sold
in webshops, which we had not found so far, as a search in Google on ‘stevia’ resulted in 4 million hits. We could have improved that search on the internet using Google (food/product type+stevia). This may result in other new food products than we have found so far.
Secondly, we will discuss our findings on the quantification of concentration levels of novel foods/ingredients based on the case study on steviol glycosides in food products (Figure 2 [Flow chart-Part 2]). We were not successful in
obtaining concentrations of steviol glycosides in all food products. This
information was considered confidential by many food companies and they were therefore not willing to share this information. The suggestion that the
concentration levels could not be traced back to brand names did only convince some companies to provide steviol glycosides concentrations. Similar to our study, Wapperom et al mentioned dealing with confidentiality of the data as an issue to be considered in a new monitoring system [10]. Based on the case study, we conclude that it was more successful to retrieve the concentration levels of the novel foods/ingredients when sending a letter by post than using the contact forms on the internet.
Some companies suggested to cooperate with FNLI (The Federation of Dutch Food and Grocery Industry) because FNLI sent similar requests in 2013. The pilot study of Wapperom and colleagues was carried out on an initiative of the FNLI [10]. Our study was performed on an initiative of the NVWA and we wanted to test whether companies were willing to provide concentration levels directly to the RIVM instead of in cooperation with the FNLI. In December 2013, the issue was discussed with FNLI and it was agreed that for similar requests to food companies in the future we may contact the companies through and with
support of FNLI. However, each request will be treated as a new case,
cooperation will depend on the total amount of requests and the workload of the companies.
Based on the case study, we consider the systematic approach with a few adaptations to be sufficient to identify which novel foods/ingredients are on the market, although we were not able to cover all food products. We adapt the systematic approach by searching, besides in supermarkets, in alternative shops. Furthermore, searching on the internet using Google in addition to searching on websites of manufacturers is implemented in the adapted systematic approach. Figure 5 comprises an adapted flow chart- part 1 on identification of specific novel foods/ingredients on the Dutch market. This adapted method may be a good basis for post-launch monitoring of novel foods/ingredients in general. As already mentioned, our systematic approach showed that it was more successful to retrieve the concentration levels of the novel foods/ingredients when sending a letter by post than using the contact forms on the internet. We appreciate the suggestion from companies to cooperate with FNLI. Therefore, our method to collect concentration levels of novel food ingredients is adapted. Figure 6 comprises an adapted flow chart-part 2 on the quantification of levels of novel food ingredients. Step 6 is changed from sending a letter by post to sending a request to the companies via the FNLI.
Figure 6: Levels of approved ingredient in identified novel foods (adapted). We recommend performing the post-launch monitoring on a regular basis for novel foods/ingredients because the market of novel foods is not yet stabilised. Foods can be introduced on the market and withdrawn from the market in a few months’ time. During a certain period of time, the amount of food products with the novel food/ingredient in the shops will fluctuate. When the market is
stabilised, it is recommended to perform post-launch monitoring of novel foods/ingredients.
The stevia case study showed that some food products with steviol glycosides found during the case study were withdrawn from the market in a few months’
study on steviol glycosides, searching in INNOVA 7 months later than the first search. This resulted in one new category (edible ices) and 10 new brands in several food categories, available in supermarkets. Therefore, it is recommended to perform post-launch monitoring of novel foods/ingredients when you think the market of novel foods/ingredients is stabilised.
Furthermore, notification duty is recommended for novel foods/ingredients and additives. The company notifies about their marketing a novel food/ingredient or food additive and the concentration levels of a novel food/ingredient or food additive. This provides insight into which novel foods/ingredients are currently on the Dutch market and to what level.
5
Proposed method for intake estimation
The method to estimate the intake of a novel food/ingredient consists of three steps.
First, the actual consumption of food products should be assessed from
appropriate food consumption data. For the Dutch situation the most recent data to be used is the Dutch National Food Consumption Survey (DNFCS)-Young Children 2005/2006 [11] for children in the age range from 2 to 6 years and the Dutch National Food Consumption Survey (DNFCS) 2007-2010 [12] for children and adults aged 7-69 years. The survey in young children contains information on food consumption of 1279 children and data were collected by means of dietary records on two non-consecutive days and a written general
questionnaire. The survey in children and adults contains the information on food consumption of 3819 people and data were collected by means of 24 hour recalls on two non-consecutive days and a general questionnaire either on paper or online. The consumed foods and recipes were entered in EPIC-Soft®
software. From the food consumption data, foods are selected that belong to a food group in which the novel food/ingredient is allowed. The categorization of food groups is based on EPIC-Soft food groups.
In the second step, the long-term exposure of the novel food/ingredient is to be assessed. To perform this step actual information is needed on the food products to which the novel food/ingredient is added and to what level. Based on this information different types of scenarios might be developed, for example the worst-case scenario and the specific market share scenario. In the worst-case scenario it is assumed that all food products in those food categories to which the novel food/ingredient is actually added contain indeed the novel
food/ingredient and also that they contain the maximal reported or measured concentration. Such a scenario is indeed worst-case; in practice, not all food products within the indicated food categories will contain the novel
food/ingredient in the maximum concentration. In addition, and probably more importantly, in practice not all food products within the indicated food categories will contain the novel food/ingredient. The market share for adding a novel food/ingredient to food products in a certain food category should be assessed (in percentage, e.g. 25%). Of course, the market share may change in time for each food category. In market share scenarios, 100% brand loyalty for all food groups is assumed, which can be considered worst-case as people may not always consume the same brand. This means that when the consumption of one person from a food group is related to novel food ingredient-containing food product, it was assumed that all other consumed products that may contain the novel food ingredient within this food group, will contain the novel food
ingredient. This also counts for non-novel food ingredient consumed products.
Subsequently, all relevant consumed food products are multiplied by the concentration levels as indicated in the scenarios. Thereafter for e.g. a 25%-market share scenario, consumption amounts are randomly linked with novel food ingredient containing or non-containing foods with probabilities proportional to market shares of 25%. To estimate chronic exposure of the novel
food/ingredient the BetaBinomial-Normal model (BBN) is used, as implemented in version 7.1 of the Monte Carlo Risk Assessment (MCRA) program [13]. If no normal distribution is observed after transformation, the observed individual mean (OIM) approach is used. This method was used in previous studies on exposure assessment of food additives and smoke flavouring primary products with use levels provided by the industry [10, 14]. The OIM method does not estimate habitual intake but an average intake of two consumption days. Uncertainty in the intake assessments is quantified using bootstrap analysis (generating 100 food consumption and 100 concentration bootstrap samples). The degree of uncertainty is indicated by 95% confidence interval around the different percentiles. Finally, the amount of compound per consumption day is calculated. This amount is divided by the persons’ body weight (bw) in kg. The outcome of the exposure calculations is compared with the ADI.
6
Scenario analyses Stevia Rebaudiana
The aim of the scenario-analyses is to assess the potential consequences in terms of exposure and ADI-exceeding of steviol glycosides, when based on the concentration levels as provided by the companies.
In children, the predicted average dietary exposure estimates of steviol equivalents are previously reported to be approximately 1.5-fold higher than those in adults [15]. Therefore, we not only used the data from the Dutch National Food Consumption Survey 2007-2010 for children and adults aged 7-69 years but also the data from the Dutch National Food Consumption Survey (DNFCS)-Young Children 2005/2006 concerning children aged 2-6 years (for more details, see Chapter 5). From the food consumption data, food products were selected that belong to a food group in which steviol glycosides is allowed [6]. The categorization of food groups was based on EPIC-Soft food groups. The assumptions and decisions made in the selection process are described in Appendix II.
In table 3 the food categories are given in which steviol glycosides are allowed and to which steviol glycosides are indeed added. Table 3 also presents the highest steviol equivalent levels in these food categories. Presented levels of steviol equivalents are mainly based on received steviol glycosides levels as provided by companies. However, if the steviol glycosides levels of food products as analyzed by the NVWA were higher than the levels received from companies, the NVWA-data were included. This was the case in three food categories, as shown in table 3. For all other food categories the highest received concentration levels from the companies were used. To food groups in which steviol glycosides are allowed but to which no steviol glycosides are added, a level of 0 mg/kg was assigned.
The ADI (acceptable daily intake) for steviol glycosides is expressed in steviol equivalents. The conversion-factor depends upon the type of glycoside. The most general steviol glycosides added to foods are Rebaudioside A (with a conversion-factor of 0.33) and Stevioside (with a conversion factor of 0.40). In practice, mixtures of steviol glycosides might be used with an overall conversion factor between 0.33 and 0.40. Since we often do not know the composition of such steviol glycosides mixtures, and our scenarios are designed as worst-case scenarios, we used the conversion factor of 0.40 for all the food groups in table 3.
It should be noted that people may consume three forms of table top
sweeteners (table 3): as tablets, as liquid, and as powder. With respect to our worst-case scenarios, we used the most conservative values in our calculations. For the tablet matrix we assumed a tablet weight of 100 mg, a concentration level of steviol glycosides of 25%, a purity of the steviol glycosides preparation of 98%, and a conversion factor of 0.40 (resulting in 98000 mg steviol
equivalents/kg tablets). For the liquid matrix we assumed a drop weight of 50 mg, a concentration level of steviol glycosides of 60%, a purity of 98%, and a conversion factor of 0.40 (resulting in 235200 mg steviol equivalents/ kg liquid)
[16]. For the powder matrix we assumed a full tea spoon amount 400 mg (spoon content of 4 ml times powder density of 0.1g/ml, a concentration level of steviol glycosides of 2.2%, a purity of 98% and a conversion factor of 0.4 (resulting in 8624 mg steviol equivalents /kg powder) (see table 3).
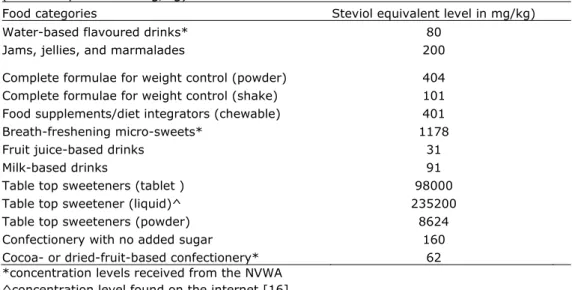
Table 3: Highest received concentration levels added to the food categories (steviol equivalents mg/kg).
Food categories Steviol equivalent level in mg/kg) Water-based flavoured drinks* 80
Jams, jellies, and marmalades 200 Complete formulae for weight control (powder) 404 Complete formulae for weight control (shake) 101 Food supplements/diet integrators (chewable) 401 Breath-freshening micro-sweets* 1178
Fruit juice-based drinks 31
Milk-based drinks 91
Table top sweeteners (tablet ) 98000 Table top sweetener (liquid)^
Table top sweeteners (powder)
235200 8624 Confectionery with no added sugar 160 Cocoa- or dried-fruit-based confectionery* 62 *concentration levels received from the NVWA
^concentration level found on the internet [16]
We decided to perform the calculations for two scenarios. A worst-case scenario was chosen in which it is assumed that all food products in selected food groups contain steviol glycosides at the highest levels as provided by companies or by NVWA for these food groups (values table 3), so including food products from these food groups for which no addition of the novel food/ingredient has been reported. We also used a 25%-market share scenario in which it is assumed that 25% of the consumed food products from the selected food groups consist of food products that contain steviol glycosides at the highest levels.
Consumption amounts were randomly assigned to steviol glycosides containing or non-containing food products, with probabilities proportional to market shares of 25%. The market share prediction was based on developments in the market. Steviol glycosides intake could eventually replace 20-30% of all dietary
sweeteners according to the World Health Organization (WHO) [17]. Stevia producer PureCircle Ltd. confirms this, steviol glycosides have the potential to displace 25% of global sugar demand by 2050 [18].
The amounts of all consumed food products in relevant food groups were multiplied by the steviol glycosides levels and market shares as given in the scenarios. The result is a distribution of intakes. After log-transformation and power transformation, no normal distribution was observed when using the BBN model. Therefore, the OIM approach, as implemented in version 7.1 of the Monte Carlo Risk Assessment (MCRA) program, was used for estimating dietary exposure to steviol glycosides [13]. As a result, for each individual the intake of the novel food/ingredient from each food group can be assessed as well as the total daily intake. The OIM method did not result in habitual intake estimation but in a mean consumption of 2 days for all individuals.
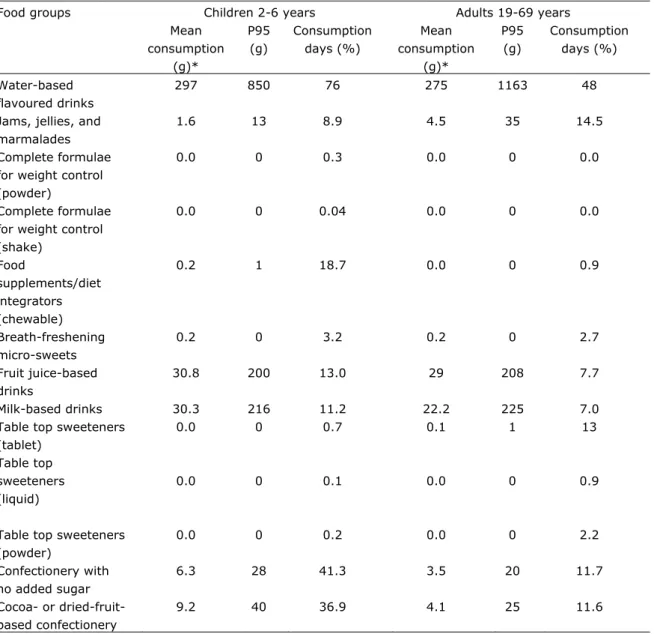
Consumption of food products containing steviol glycosides by children aged 2-6 years and adults aged 19-69 years is shown in table 4. Water-based flavoured drinks were consumed on 76% of the consumption days, confectionery with no added sugar on 41% of the consumption days and cocoa- or dried-fruit-based confectionery on 37% of the consumption days among children. Similar results were found for children aged 7-13 years and 14-18 years. However, among adults aged 19-69 years differences were observed. Water-based flavoured drinks were consumed on 48% of the consumption days; jams, jellies and marmalades on 14% of the consumption days and table top sweeteners as tablets on 13% of the consumption days.
Table 4: Consumption of food products to which steviol glycosides might be added in children aged 2-6 years and adults aged 19-69 years in the Netherlands^.
Food groups Children 2-6 years Adults 19-69 years Mean consumption (g)* P95 (g) Consumption days (%) Mean consumption (g)* P95 (g) Consumption days (%) Water-based flavoured drinks 297 850 76 275 1163 48
Jams, jellies, and marmalades
1.6 13 8.9 4.5 35 14.5
Complete formulae for weight control (powder)
0.0 0 0.3 0.0 0 0.0
Complete formulae for weight control (shake) 0.0 0 0.04 0.0 0 0.0 Food supplements/diet integrators (chewable) 0.2 1 18.7 0.0 0 0.9 Breath-freshening micro-sweets 0.2 0 3.2 0.2 0 2.7 Fruit juice-based drinks 30.8 200 13.0 29 208 7.7 Milk-based drinks 30.3 216 11.2 22.2 225 7.0 Table top sweeteners
(tablet) Table top sweeteners (liquid) 0.0 0.0 0 0 0.7 0.1 0.1 0.0 1 0 13 0.9
Table top sweeteners (powder) 0.0 0 0.2 0.0 0 2.2 Confectionery with no added sugar 6.3 28 41.3 3.5 20 11.7 Cocoa- or dried-fruit-based confectionery 9.2 40 36.9 4.1 25 11.6
*Mean consumption of 2 days for all individuals
^Data from the DNFCS-Young Children 2005/2006 for children aged 2-6 years and from the DNFCS 2007-2010 for adults aged 19-69 years were used.
For each individual the daily intake per kg of body weight (bw) was calculated. Uncertainty in the intake assessments was quantified using bootstrap analysis (generating 100 food consumption and 100 concentration bootstrap samples). The degree of uncertainty is indicated by the 95% confidence interval around the estimated intake at the various percentiles (50, 95 and 99).
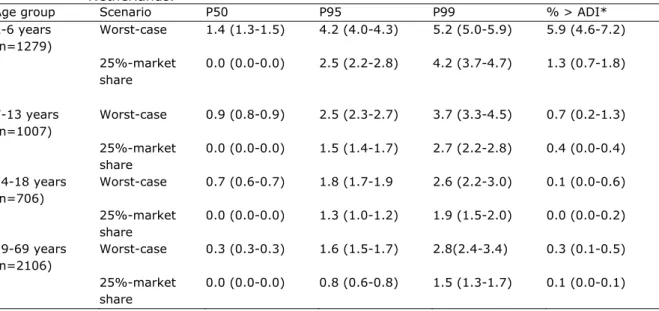
In Table 5, the estimated intakes of steviol equivalents at several percentiles are given for children and adults, and for the two scenarios: worst-case and 25%-market share.
The ADI for steviol equivalents is set by EFSA on 4.0 mg/kg bw/day. In Table 5 we also estimate the percentage of the population that would exceed the ADI. As shown in table 5 the percentage of the population that exceeds the ADI is less than 1%, except for the children aged 2-6 years. These young children in the 25% market share group still have an ADI-exceeding rate of only 1.3%, but these children in the worst-case scenario (100% market share) show a 5.9% exceeding of ADI (95%CI: 4.6-7.2).
Table 5: Dietary exposure to steviol glycosides (mg/kg bw/day, as steviol equivalents) in DNFCS-Young Children 2005/2006 for children aged 2-6 years and DNFCS 2007-2010 for children and adults aged 7-69 years in the
Netherlands.
Age group Scenario P50 P95 P99 % > ADI* 2-6 years (n=1279) Worst-case 1.4 (1.3-1.5) 4.2 (4.0-4.3) 5.2 (5.0-5.9) 5.9 (4.6-7.2) 25%-market share 0.0 (0.0-0.0) 2.5 (2.2-2.8) 4.2 (3.7-4.7) 1.3 (0.7-1.8) 7-13 years (n=1007) Worst-case 0.9 (0.8-0.9) 2.5 (2.3-2.7) 3.7 (3.3-4.5) 0.7 (0.2-1.3) 25%-market share 0.0 (0.0-0.0) 1.5 (1.4-1.7) 2.7 (2.2-2.8) 0.4 (0.0-0.4) 14-18 years (n=706) Worst-case 0.7 (0.6-0.7) 1.8 (1.7-1.9 2.6 (2.2-3.0) 0.1 (0.0-0.6) 25%-market share 0.0 (0.0-0.0) 1.3 (1.0-1.2) 1.9 (1.5-2.0) 0.0 (0.0-0.2) 19-69 years (n=2106) Worst-case 0.3 (0.3-0.3) 1.6 (1.5-1.7) 2.8(2.4-3.4) 0.3 (0.1-0.5) 25%-market share 0.0 (0.0-0.0) 0.8 (0.6-0.8) 1.5 (1.3-1.7) 0.1 (0.0-0.1)
Data are presented as point estimate (95% CI) *ADI=Acceptable Daily Intake
Figure 7 shows that for young children water-based flavoured drinks is a main contributor to daily intake of steviol glycosides (79%) on a distance followed by milk drinks (9%). Among children aged 7-13 years and 14-18 years, similar results were observed on largest contributions to total dietary exposure of steviol glycosides. A bit different picture was found for adults aged 19-69 years. Figure 8 shows that also for adults water-based flavoured drinks is a main contributor (58%) but table top sweeteners as tablets (20%) and as liquid (8%) are on the second and third position, followed by milk-based drinks (5%). Figures 9 and 10 show the same information as Figures 7 and 8 but now for the
Figure 7: Main contributors of median total dietary exposure of steviol glycosides among children aged 2 to 6 years in the Netherlands (worst-case scenario).
Figure 8: Main contributors of median total dietary exposure of steviol glycosides among adults aged 19 to 69 years in the Netherlands (worst-case scenario).
Water‐based flavoured drinks
(79%)
Milk‐based drinks (9%)
Confectionery with no added
sugar (3%)
Fruit juice‐based drinks (3%)
Cocoa‐ or dried‐fruit‐based
confectionery (2%)
Jams, jellies, and marmalades
(1%)
Breath‐freshening micro‐
sweets (0.8%)
Others (1.1%)
Water‐based flavoured drinks
(58%)
Tabletop sweeteners (tablet)
(20%)
Tabletop sweeteners (liquid)
(8%)
Milk‐based drinks (5%)
Jams, jellies, and marmalades
(2%)
Fruit‐juice based drinks (2%)
Confectionery with no added
sugar (2%)
Others (2%)
Figure 9: Main contributors of 95th percentile level of total dietary exposure of steviol glycosides among children aged 2-6 years in the Netherlands (worst-case scenario).
Figure 10: Main contributors of the 95th percentile level of total dietary exposure of steviol glycosides among adults aged 19-69 years in the Netherlands (worst-case scenario).
Water‐based flavoured drinks
(83%)
Milk‐based drinks (10%)
Confectionery with no added
sugar (2%)
Fruit juice‐based drinks (2%)
Tabletop sweeteners (liquid)
(1%)
Others (2%)
Water‐based flavoured
drinks (42%)
Tabletop sweeteners (liquid)
(26%)
Tabletop sweeteners (tablet)
(26%)
Milk‐based drinks (2%)
Fruit‐juice based drinks (1%)
Others (3%)
7
Evaluation of the method to assess intake of novel
foods/ingredients applied to the additive Stevia Rebaudiana
Using the BBN model or the OIM approach to estimate respectively chronic exposure or mean intake over two consumption days of the novel
food/ingredient is considered an adequate method.
Applying the method to the additive stevia, our study shows that flavoured drinks contribute the most to the daily intake of steviol glycosides among all age groups but in particular among children aged 2-18 years. From companies, we received concentration levels for 2 out of 7 brands. Additionally, from the NVWA concentration levels for 3 out of 7 brands were received. It is recommended for future monitoring that for children representative data is available on flavoured drinks. Among adults, table top sweeteners contribute also substantially to the daily intake of steviol glycosides (28%). Therefore, it is recommended to provide representative data on table top sweeteners. However, for table top sweeteners no maximum permitted levels are indicated.
As shown in table 5 the percentage of the population that exceeds the ADI is less than 1%, except for the children aged 2-6 years. These young children in the worst-case scenario show a 5.9% exceeding of ADI (95%CI: 4.6-7.2) in the worst-case scenario. . It should be realized that the ADI for steviol equivalents is based on a NOAEL (No Observed Adverse Effect Level) of 388 mg steviol
equivalents/kg bw/day using an uncertainty factor of about 100 (EFSA, 2010) (Appendix III). Nevertheless, since about 6% of the young children exceed the ADI in a worst-case scenario, this population group is potentially at risk.
Our present study includes a more detailed food classification when compared to our previous study performed in 2011 [9], and therefore allows for more
accurate estimations of actual intakes.
Some food products in which steviol glycosides are allowed were not found with our search strategy. This suggests that although use is permitted, it is not (yet) fully implemented for all food categories.
Our worst-case scenario is rather conservative. We assumed that all food products within the same food category would contain the maximum recorded level for that category. However, it is questionable how realistic this assumption is. It is also not reasonable to assume that all products within the same food category will contain the novel food/ingredient. Therefore, the present worst-case scenario probably provides a too high estimate of the steviol equivalents intake. On the other hand, using a worst-case scenario may result in reducing the number of relevant scenarios (‘if there is no problem with the intakes in the worst-case scenario, then there will also be no problem with less extreme scenarios’).
It should be realized that our present worst-case scenario is less extreme than we used before (Tijhuis et al, 2011), since in that previous study we used the
maximum permitted levels for a food category as allowed by the Decision of the European Commission (assuming that manufacturers will not add more than allowed). In the current study, the maximum reported levels for a food category were used.
We also used a 25%-market share scenario, which we consider at this stage as a more realistic approach for the calculation of the actual intake van steviol glycosides. This 25%-market share scenario is based on currently available information. However, it is conceivable that these data will change over time, and that a higher market share percentage would become more realistic. It is also conceivable that the levels to which steviol glycosides is added to food products will increase (although probably not to levels higher than the maximum permitted levels). Although, it is unlikely that higher levels of steviol glycosides will be added, considering that taste and sweetness will change.
In our study, the OIM method was used for MCRA analyses. With an OIM approach, the mean value for an individual contains a considerable amount of within-individual variation since the average consumption of two days is
calculated instead of the habitual intake. It is known that the distribution of OIM is wider than a distribution based on habitual intakes. This means that in the present approach the estimate of the percentage above the ADI will be overestimated.
The BBN-model was considered a more refined usual intake modeling approach. However, no normality was observed after transformation, making the use of this model in this study not feasible. In future studies, it is recommended to use the recently developed Model-Then-Add approach to examine whether this approach may result in a more refined intake assessment (unpublished letter report). With this method, the habitual intake can be modeled for separate foods or food groups, and subsequently added to obtain the total habitual intake distribution. Besides using this approach, other methods can be used to model habitual intake. A three-part model using a first shrink then add approach can be used to estimate distributions of habitual intake [19]. A simulation model can also be applied to analyze the intake from separate foods, and then aggregating the results from the model [20]. Furthermore, habitual intake can be assessed using the statistical program SPADE (Statistical Program to Assess Dietary Exposure) [12, 21, 22].
The intake of steviol glycosides is expressed as steviol equivalents per kg body weight per day. In our study, we compared the intakes of various age groups. However, a certain intake per kg body weight for young children should probably be differently interpreted than the same intake per kg of body weight for adults (for a particular compound, children may be more sensitive than adults, or they may be less sensitive).
Finally, for the conversion of steviol glycosides to steviol equivalents we used the conservative factor of 0.4 since we consider the worst-case scenario. In practice, the conversion factor for the mixture of consumed steviol glycosides will be between 0.33 (Rebaudioside A) and 0.4 (Stevioside). Therefore, the calculated steviol equivalent intake probably will be an overestimation.
In conclusion, the method used to estimate the intake of the novel
food/ingredient can be considered as feasible. We also conclude that based on the amounts of Stevia actually added to foods by May 2013, there may be a potential risk for young children, especially for the children with high intake of water-based flavoured drinks. For older children and adults, the potential risk for exceeding the ADI is minimal. Since Stevia might be added to more foods and in higher levels, a regular monitoring of the actual intake of Stevia for the coming years is advised.
8
References
1. de Jong, N., et al., Post Launch Monitoring of Functional Foods. Methodology developement (II). RIVM report 350030005/2005. 2005, RIVM: Bilthoven.
2. de Jong, N., et al., Postlaunch Monitoing of Functional Foods. Methodology development III. RIVM report 350030006/2005. 2005, RIVM: Bilthoven.
3. de Jong, N. and M.C. Ocké, Postlaunch Monitoring of Functional Foods. Methodology development (I). RIVM report 350030001/2004. 2004, RIVM: Bilthoven.
4. Pawar, R.S., A.J. Krynitsky, and J.I. Rader, Sweeteners from plants--with emphasis on Stevia rebaudiana (Bertoni) and Siraitia grosvenorii (Swingle). Anal Bioanal Chem, 2013. 405(13): p. 4397-407.
5. EG, Beschikking van de Commissie van 22 februari 2000 houdende weigering van een vergunning voor het in de handel brengen van „Stevia rebaudiana Bertoni: planten en gedroogde bladeren” als nieuw
voedingsmiddel of nieuw voedselingrediënt krachtens Verordening (EG) nr. 258/97 van het Europees Parlement en de Raad (kennisgeving geschied onder nummer C(2000) 77) (Slechts de tekst in de
Nederlandse taal is authentiek). (2000/196/EG). Publicatieblad van de Europese Gemeenschappen, Editor. 2000. p. L61/14.
6. EC, Commission Regulation (EU) NO 1131/2011 of 11 November 2011 amending Annex II to Regulation (EC) No 1333/2008 of the European Parliament and of the Council with regard to steviol glycosides., Official Journal of the European Communities, Editor. 2011. p. L295/206 - L295/211.
7. EFSA Panel on Food Additives and Nutrient Sources (ANS), Scientific Opinion on the safety of steviol glycosides for the proposed uses as a food additive. EFSA Journal, 2010. 8(4): p. 1537.
8. EFSA Panel on Food Contact Materials, E., Flavourings and Procsessing Aids (CEF),, Scientific Opinion on Flavouring Group Evaluation 310 (FGE.310): Rebaudioside A from chemical group 30. EFSA Journal, 2011. 9(5): p. 2181.
9. Tijhuis, M.J., et al., Steviol glycosides in food. Exposure scenarios and health effect assessment. RIVM Letter Report 350121001/2011. 2011, National Institute for Public Health and the Environment: Bilthoven. 10. Wapperom, D., et al., Exposure assessment of food additives with use
levels provided by industry. A pilot study. RIVM Report 320026002/2011. 2011, RIVM: Bilthoven.
11. Ocké, M.C., et al., Dutch National Food Consumption Survey - Young Children 2005/2006. RIVM Report 350070001/2007. 2008, RIVM: Bilthoven.
12. van Rossum, C.T.M., et al., Dutch National Food Consumption Survey 2007-2010. Diet of children and adults aged 7 to 69 years. RIVM Report 350050006/2011. 2011, RIVM: Bilthoven.
13. de Boer, W.J. and H. van der Voet. MCRA 7.1 Reference Manual. Report Dec 2011. 2011; Available from: https://mcra.rivm.nl/.
14. Sprong, C., Refined exposure assessment of smoke flavouring primary products with use levels provided by the industry. A pilot study into data