Emission levels of air pollutants in 2020 under the revised Gothenburg protocol will still lead to excessive nitrogen deposition putting more than 40 percent of Europe’s nature at risk. This report also describes progress in quantifying net loss of biodiversity.
This is a publication of:
National Institute for Public Health and the Environment
P.O. Box 1 | 3720 BA Bilthoven The Netherlands
www.rivm.nl January 2013
004500
Report 680359004
M. Posch | J. Slootweg | J.-P. Hettelingh (eds)
Modelling and Mapping of Atmospherically-induced Ecosystem Impacts in Europe
CCE Status Report 2012
CCE
Status
Report 2012
Modelling and Mapping of Atmospherically-induced
Ecosystem Impacts in Europe
Modelling and Mapping of
Atmospherically-induced
Ecosystem Impacts in Europe
CCE Status Report 2012
M. Posch, J. Slootweg, J.-P. Hettelingh (eds)The work reported here has been performed by order and for the account of the Directorate for Climate and Air Quality of the Dutch Ministry of Infrastructure and the Environment, for the account of the European Commission (a) LIFE III Programme within the framework ‘European Consortium for Modelling Air Pollution and Climate Strategies (EC4MACS)’ and (b) under the Seventh Framework Programme, Theme [ENV.2011.1.1.2-1], Grant agreement no. 282910 “Effects of Climate Change on Air Pollution Impacts and Response Strategies for European Ecosystems”, and for the account of (the Working Group on Effects within) the trust fund for the effect-oriented activities under the Convention on Long-range Transboundary Air Pollution. Report-report 680359004
ISBN 978-90-6960-262-2 © CCE 2012
Parts of this publication may be reproduced provided that reference is made to the source. A reference to this report reads as ‘Posch M, Slootweg J, Hettelingh J-P (eds) (2012) Modelling and Mapping of Atmospherically-induced Ecosystem Impacts in Europe, CCE Status Report 2012, Coordination Centre for Effects, RIVM, Bilthoven, The Netherlands’
Acknowledgements
The methods and results presented in this report are the product of close collaboration within the Effects Programme of the UNECE Convention on Long-range Transboundary Air Pollution (LRTAP), involving many institutions and individuals throughout Europe.
Participants in the Effects Programme and National Focal Centres of the International Co-operative Programme (ICP) on Modelling and Mapping of Critical Levels and Loads and Air Pollution Effects, Risks and Trends are acknowledged for their commitment and contributions to the work of the Coordination Centre for Effects (CCE). In particular, the CCE wishes to acknowledge: • the Dutch Ministry of Infrastructure and the
Environment, and Dr J.M. Prins in particular, for their continued support;
• the Working Group on Effects and the Task Force of the ICP on Modelling and Mapping for their collaboration and assistance;
• the EMEP Meteorological Synthesizing Centres and the EMEP Centre for Integrated Assessment Modelling for their collaboration in the field of atmospheric dispersion and integrated assessment modelling;
• the secretariat of the LRTAP Convention for supporting mechanisms for contributions to the trust fund for the financing, by parties, of CCE activities;
• the contribution of Poland to support the CCE workshop and the M&M Task Force meeting in Warsaw in 2012; • the European Commission’s LIFE III Programme, for
co-funding the participation of the CCE in the European Consortium for Modelling Air pollution and Climate Strategies (EC4MACS);
• The European Seventh Framework Programme, Theme [ENV.2011.1.1.2-1], Grant agreement no. 282910 “Effects of Climate Change on Air Pollution Impacts and Response Strategies for European Ecosystems” (ECLAIRE);
• Martin Middelburg (VijfKeerBlauw) for preparing the design and layout, and the RIVM-Traffic department for ensuring publication-logistics, of this report.
Summary
The revision of the Gothenburg Protocol, concluded in 2012, foresees the further reduction of air pollution (by sulphur, nitrogen, volatile organic compounds and – for the first time – particulate matter), with positive effects on the environment and human health. To this end, the revised Protocol requires EU member states to meet stricter emissions ceilings for these four air pollutants from 2020.
In Chapter 1, the effects of these emission reduction commitments on acidification, eutrophication and biodiversity indicators are described. As one of its tasks, the Coordination Centre for Effects (CCE) maintains and updates the European database on critical loads of acidity and nutrient nitrogen.
The negotiations were based on critical loads data from 2008; however, the latest updates to the critical loads database are now available on a much finer spatial resolution – and these are described in Chapter 2. The availability of both the ‘old’ and the ‘new’ critical loads database, together with the results from the updated atmospheric transport model, allows the ‘old’ and ‘new’ data to be compared – as also reported in Chapter 1. Reassuringly, the results based on calculations using these two datasets do not differ greatly, although nutrient nitrogen remains a problem: critical loads of nutrient nitrogen are exceeded on 62% of the ecosystem area in the EU-27 countries. Also in Chapter 1, the authors of the report examine which (uniform) emission reductions are needed to virtually eliminate the exceedance of critical loads in the whole of Europe.
In 2001, the National Emission Ceilings (NEC) Directive of the EU also used critical loads in its design. In Chapter 3, the results of a study for and with the European
Environment Agency (EEA) are reported, thereby providing answers to the question of whether the goals of the NEC Directive – with respect to critical loads – are achieved. This study was performed using both the data and models that were available during the negotiations of the Directive (‘old knowledge’) and current knowledge on critical loads and deposition models. The main conclusion is that nitrogen remains a major problem.
The further development and application of soil and vegetation models, as also pursued in the project entitled “Effects of Climate Change on Air Pollution Impacts and Response Strategies for European Ecosystems” (ECLAIRE) under the seventh Framework Programme, have been carried out to enable the assessment of vegetation changes due to air pollution and climate change. The current state of (regional-scale) modelling of forest growth and vegetation change is described in Chapters 4 and 5,
respectively. The suitability of these (and other) such models to predict changes in floral diversity has been investigated by several countries within the framework of the 2011/12 Call for Contributions issued by the CCE to the National Focal Centres of the CCE (see also Chapter 2). This CCE Status Report is part of the Workplan 2012–13 of the Convention on Long-range Transboundary Air Pollution (LRTAP) in support of integrated assessment in Europe. This Workplan assesses policy options for the (further) reduction of nitrogen and sulphur depositions, as well as of particulate matter and greenhouse gases, in the context of environmental and health effects.
Rapport in het kort
CCE Status Report 2012
In 2012 is het Gothenborg Protocol (1999), dat de uitstoot van luchtvervuilende stoffen reguleert, aangescherpt. Desondanks blijft de hoge depositie van stikstof op de bodem in de toekomst een risico vormen voor de natuur in Europa. Bij het aangescherpte beleid is er in 2020 een teveel aan stikstof op 62 procent van het natuuroppervlak van de 27 lidstaten van de Europese Unie. Zelfs als alle beschikbare technische maatregelen worden ingevoerd, zou dat 38 procent zijn. Een hoge stikstofdepositie verstoort onder andere de chemische samenstelling van de bodem, waardoor de variatie in plantensoorten afneemt. De verzuring is de afgelopen decennia als gevolg van het Gothenborg Protocol sterk afgenomen, maar verdwijnt niet volledig (nog 4 procent in heel Europa). Dit blijkt uit het jaarlijkse statusrapport van het Coordination Centre for Effects (CCE) van het RIVM.
Effecten van beleidsopties voor luchtvervuiling geëvalueerd
Het protocol is onder andere tot stand gekomen door op Europese schaal in kaart te brengen wat de effecten en kosten zijn van diverse beleidsopties om de uitstoot van luchtvervuilende stoffen te verminderen(geïntegreerde analyse). Het gaat hierbij om de effecten van onder meer stikstof- en zwaveloxides en fijnstof op gezondheid, klimaat en milieu, en biodiversiteit. Het CCE draagt bij aan de geïntegreerde analyse met kennis over zogeheten kritische belastingsgrenzen voor de neerslag van stikstof en zwavel. Deze grenzen geven per ecosysteem aan welke maximale vervuiling ze kunnen verdragen. De waarden worden regelmatig geactualiseerd door de landen als meer kennis of gegevens beschikbaar komen.
De kritische belastingsgrenzen worden op verschillende manieren bepaald. De laatste jaren wordt daarbij gewerkt aan modellering die de invloed van stikstofdepositie op de vegetatie weergeeft. Hierbij wordt duidelijk hoe de biodiversiteit door luchtverontreiniging en klimaatverandering verandert.
Europese richtlijnen verzuring niet gehaald
Ook de Europese richtlijn uit 2001 voor nationale emissieplafonds (NEC) maakt gebruik van geïntegreerde analyse. Met de toenmalige kennis van onder andere kritische belastingsgrenzen zouden de gestelde doelen voor verzuring in 2010 zijn bereikt. Volgens de nieuwste inzichten is dat echter niet het geval.
Contents
Part 1 Progress CCE
111 Assessing Effects of the Revised Gothenburg Protocol 13
1.1 Introduction 13
1.2 Acidification under the RGP with 2008 knowledge 14 1.3 Eutrophication under the RGP with 2008 knowledge 14 1.4 Effects of applying uniform reductions to achieve protection 15 1.5 A tentative assessment of the change of biodiversity 17
1.6 Acidification and eutrophication under the RGP with 2012 knowledge 18 1.7 Summary and conclusions 18
2 Summary of National Data 21
2.1 Introduction 21 2.2 NFC responses 21 Annex 2.A 26
3 Assessing NEC Directive Objectives for Acidification and Eutrophication with 2001 and
Present Knowledge 31
3.1 Introduction 31
3.2 Old and present scientific knowledge 32 3.3 Results 34
3.4 A sensitivity analysis 36 3.5 Concluding remarks 38
Part 2 Progress in Modelling 41
4 GrowUp: A tool for computing forest Growth, nutrient Uptake and litterfall 43
4.1 Introduction 43
4.2 Stem growth and forest management strategies 43 4.3 Litterfall and uptake 45
4.4 Model input and output 45 4.5 User interface 47
5 Combined effects of air pollution and climate change on species diversity in Europe: First assessments
with VSD+ linked to vegetation models 49
5.1 Introduction 49 5.2 Methods 49 5.3 Data 52
5.4 Climate and deposition scenarios 53 5.5 Results 54
5.6 Conclusions 58
Part 3 NFC Report
63
Austria 65 France 73 Germany 81 Ireland 89 Italy 93 Netherlands 97 Norway 101 Poland 105 Romania 109 Slovenia 113 Sweden 119 Switserland 125Part 1
Jean-Paul Hettelingh, Maximilian Posch, Jaap Slootweg,
Anne-Christine Le Gall1
1.1 Introduction
At its 30th session (Geneva, 30 April–4 May 2012) the
Executive Body agreed to amendments to the Revised Gothenburg Protocol (RGP) to ‘Abate Acidification, Eutrophication and Ground-level Ozone’ (Gothenburg, 30 November 1999). This revision implies the further reduction of pollutants that affect human health, acidification, eutrophication and climate change (Reis et al. 2012).
This chapter focuses on the final analysis of the risk of acidification and eutrophication based on country and sea emissions established under the RGP. Effects of other emission scenarios that were elaborated in support of the revision process can be found in the CCE Status Report 2011 (Posch et al. 2011). These assessments were based on the critical load database of 2008 (CL50) and the EMEP dispersion model that were used to address atmospheric depositions, concentrations and exceedances on a 50×50 km2 grid (EMEP50). Impacts presented in this chapter may
1 Chair, ICP Modelling & Mapping, INERIS, France, anne-christine.
le-gall@ineris.fr.
be (slightly) different from impact assessments of early RGP scenario-versions, as presented at the 41st session of
the Task Force on Integrated Assessment Modelling (Bilthoven, 7–9 May 2012). The reason for this is that country emissions for reference and target years were subject to changes (by Parties) in the second half of 2012. The EMEP50 model was recently revised to cover a 28×28 km2 grid (EMEP28; Simpson et al. 2012). In anticipation of
the increased resolution of the EMEP model, National Focal Centres under the ICP Modelling and Mapping of Critical Levels & Loads, and Effects, Risks and Trends (ICP M&M) responded to a CCE call for data in 2010 to update the scale (and protection requirements as appropriate) of their contribution to the European critical load database (CL28; see Posch et al. 2011).
This chapter summarises the air pollution effects of emissions from the RGP by addressing exceedances computed with old (i.e., EMEP50 and CL50) as well as new (EMEP28 and CL28) scientific information. The expected change of biodiversity in 2020 under RGP in specified EUNIS areas is briefly summarised as well.
1
Assessing Effects of the
Revised Gothenburg
1.2 Acidification under the RGP with
2008 knowledge
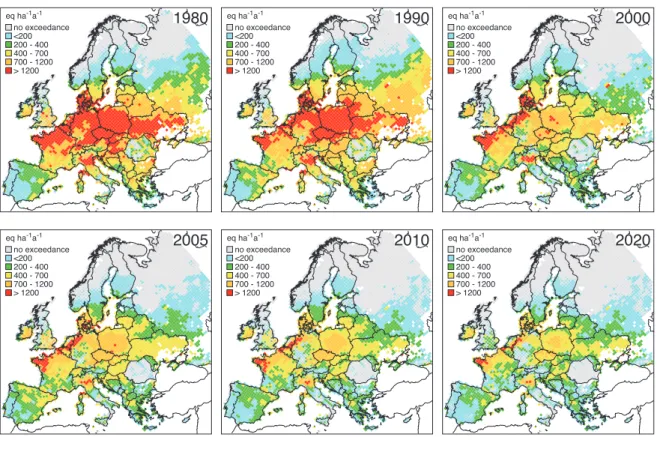
The use of the EMEP50 deposition model to compute exceedances of critical loads for acidification from the 2008 database (CL50) yields areas at risk that have markedly diminished since 1980. Figure 1.1 illustrates the trend of all ecosystems at risk, from a large area with high exceedances (red shading) in 1980 to a relatively small area with relatively low exceedances (blue shading) in 2020. Exceedance peaks in 2020 are scattered over the southern part of the Dutch –German border area and Poland. Figure 1.1 also shows that a major part of Europe flips from high risk in 1980 (> 1,200 eq ha–1a–1; red) to low risk in 2020
(<200 eq ha–1a–1; light blue) or non-exceedance (grey). The
size of the shaded area in a grid cell reflects the area at risk in proportion to the total ecosystem area within the EMEP grid. The trend of the Average Accumulated Exceedance (AAE) for acidification in Europe and in EU27 (Figure 1.2) decreases sharply between 1980 and 2000. This is also reflected in the trend of the area at risk of acidification (Figure 1.3), which decreases from about 43% in 1980 to around 4% in RGP2020 (i.e. in 2020 once the RGP is implemented) in European ecosystems classified according
to EUNIS. For the EU-27 these percentages are 45% and 7%, respectively. Finally, assuming that maximum feasible emission reduction techniques (MFR) would be
implemented by 2020, the risk of acidification could be still further reduced (see below).
1.3 Eutrophication under the RGP with
2008 knowledge
Eutrophication (computed with CL50 and EMEP50) continues to be a serious threat to European ecosystems. In 1980 critical loads of nutrient nitrogen were exceeded in about 67% of the European ecosystem area (80% in the EU27), which is expected to decrease to cover around 42% (62% in the EU27) under RGP2020 (Figure 1.4).
While Figure 1.5 shows the area at risk remaining high, it is informative to see that the trend of AAE undergoes a significant reduction between 1980 and 2020 (Figure 1.4). This reduction may delay the propagation of effects to various elements of biodiversity, but will stand in the way of recovery.
Figure 1.1 Areas where critical loads for acidification (2008 database) are exceeded by acid depositions (EMEP50 model) caused by
emissions between 1980 (top left) and 2020 (bottom right), the last projected under the Revised Gothenburg Protocol (RGP)
eq ha-1a-1 no exceedance <200 200 - 400 400 - 700 700 - 1200 > 1200
1980
eq ha-1a-1 no exceedance <200 200 - 400 400 - 700 700 - 1200 > 12001990
eq ha-1a-1 no exceedance <200 200 - 400 400 - 700 700 - 1200 > 12002000
eq ha-1a-1 no exceedance <200 200 - 400 400 - 700 700 - 1200 > 12002005
eq ha-1a-1 no exceedance <200 200 - 400 400 - 700 700 - 1200 > 12002010
eq ha-1a-1 no exceedance <200 200 - 400 400 - 700 700 - 1200 > 12002020
The trend between 1980 and RGP2020 of the distribution over Europe of areas where critical loads for
eutrophication are exceeded confirms the continued stress to European ecosystems, in Central Europe in particular (Figure 1.6). The broad Central European area of high exceedances in 1980 (red shading) is markedly reduced in 2020, but still occurs in western France and the border areas between the Netherlands, Belgium and Germany, as well as in northern Italy.
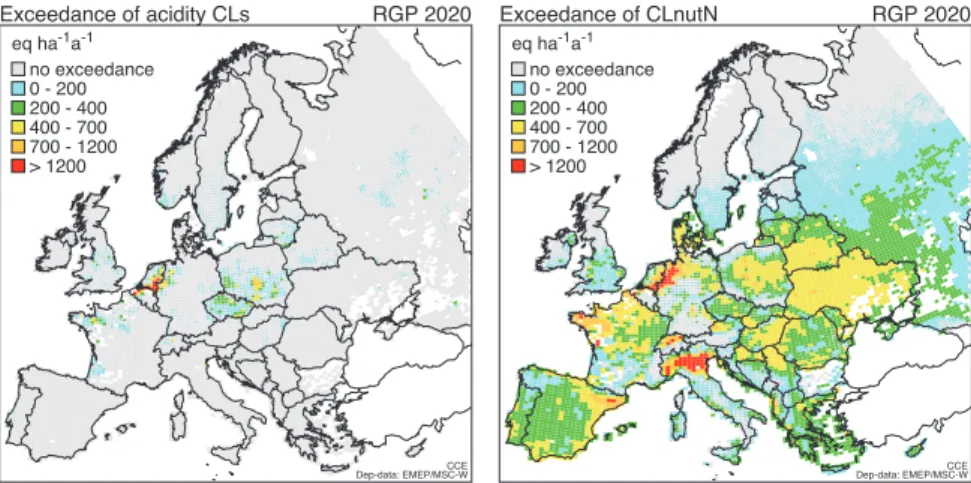
Finally, the result of a (hypothetical) implementation of Maximum Feasible Reductions (MFR) of emissions of acidifying and eutrophying pollutants would yield a further increase of areas that are protected, while areas with high exceedances of critical loads would further decrease (Figure 1.7).
Figure 1.7 illustrates that, even under maximum
(technically) feasible reductions of nitrogen emissions, the deposition of nitrogen continues to put a large area at risk
(light blue shading on the right-hand map), implying that the potential of technical measures alone is not sufficient to achieve non-exceedance of critical loads for
eutrophication.
1.4 Effects of applying uniform
reductions to achieve protection
The integrated assessment, e.g. by means of the GAINS model, of alternatives to distribute emission reductions among European countries includes the minimization of the costs of emission reductions subject to environmental and health targets. These analyses have shown that it is difficult to attain these targets with technical (end-of-pipe) measures. Therefore, from an impact point of view alone, it is interesting to explore the further reductions of acidifying and eutrophying emissions that are necessary to have depositions decrease to or below critical loads.Figure 1.2 Trend between 1980 and RGP2020 of the Average
Accumulated Exceedance (AAE) for acidification in the EU-27 and in Europe. 0 200 400 600 800 1000 1980 1990 2000 2010 2020 eq/ha/yr Years Excess acidification EU27 Europe
Figure 1.3 Trend between 1980 and RGP2020 of the area
where critical loads for acidification are exceeded in the EU-27 and in Europe. 0 20 40 60 80 100 1980 1990 2000 2010 2020 % Years
Area at risk of acidification
EU27 Europe
Figure 1.5 Trend between 1980 and RGP2020 of the area
where critical loads of nutrient nitrogen are exceeded in the EU27 and in Europe
0 20 40 60 80 100 % 1980 1990 2000 2010 2020 Years
Area at risk of eutrophication
EU27 Europe
Figure 1.4 Trend between 1980 and RGP2020 of the Average
Accumulated Exceedance (AAE) for eutrophication in the EU-27 and in Europe 0 200 400 600 800 1000 eq/ha/yr 1980 1990 2000 2010 2020 Years Excess eutrophication EU27 Europe
In the following the relationship is explored between uniform emission reductions over European countries (incl. shipping) and acidification as well as eutrophication effects. Using critical loads from the 2008 database, Figure 1.8 shows the percentage of the ecosystem area in Europe for which critical loads of nutrient N, CLnutN, are exceeded (left) and their exceedance (AAE in eq ha–1yr–1, right) under
uniform reductions of total nitrogen emissions in 2020 (as
agreed under the RGP scenario). The same quantities are also shown if only NOx emissions (NH3 emissions kept
constant) or only NH3 emissions (NOx emissions kept
constant) are reduced uniformly. The depositions for each of the uniformly reduced emissions are computed with the source-receptor matrices of the EMEP50 dispersion model.
Figure 1.6 Areas where critical loads for eutrophication are exceeded by nutrient nitrogen depositions caused by emissions between
1980 (top left) and 2020 (bottom right), the last projected under the Revised Gothenburg Protocol (RGP).
eq ha-1a-1 no exceedance <200 200 - 400 400 - 700 700 - 1200 > 1200
1980
eq ha-1a-1 no exceedance <200 200 - 400 400 - 700 700 - 1200 > 12001990
eq ha-1a-1 no exceedance <200 200 - 400 400 - 700 700 - 1200 > 12002000
eq ha-1a-1 no exceedance <200 200 - 400 400 - 700 700 - 1200 > 12002005
eq ha-1a-1 no exceedance <200 200 - 400 400 - 700 700 - 1200 > 12002010
eq ha-1a-1 no exceedance <200 200 - 400 400 - 700 700 - 1200 > 12002020
Figure 1.7 Areas where critical loads for acidification (left) and eutrophication (right) are exceeded by sulphur and nitrogen
depositions under the Maximum Feasible Reduction (MFR) emission scenario.
eq ha-1a-1 no exceedance <200 200 - 400 400 - 700 700 - 1200 > 1200 Exceedance of acidity CLs 2020
MFR
eq ha-1a-1 no exceedance <200 200 - 400 400 - 700 700 - 1200 > 1200 Exceedance of nutrient N CLs 2020MFR
At 70% reduction of total nitrogen emissions the exceedance is close to zero (Figure 1.8, right) whereas the area where critical loads are exceeded (Figure 1.8, left) still covers about 2%. However, it is obvious that the
magnitudes of the exceedances are very low in those remaining areas. Looking at the impacts of reductions of individual nitrogen species, it is interesting to note that a 100% reduction in NH3 emissions leads to 10% of the area
remaining at risk, whereas 100% reduction of NOx
emissions still leaves about 15% of the European ecosystem area at risk (Figure 1.8, left). The fact that the reduction of NH3 emissions is more effective than that of
NOx is confirmed in terms of the AAE (Figure 1.8, right).
When a similar analysis is conducted for acidity (Figure 1.9) it turns out that the exceedance of acidity CLs is close to zero at 60% reduction of both sulphur and nitrogen compounds (Figure 1.9, right), whereas the exceeded area is still about 0.7% (left). However, if N emissions alone are reduced by 100%, still slightly more than 1% of the European ecosystem area remains at risk of acidification (Figure 1.9, left) with an AAE of slightly less than 2 eq ha–1yr–1.
1.5 A tentative assessment of the
change of biodiversity
The derivation of dose-response relationships (D-R functions) is based on a literature review prepared for the review and revision of empirical N critical loads (Bobbink and Hettelingh 2011).
The assessment of changes in biodiversity using these D-R functions on a regional scale is based on the extrapolation of the functions over the EUNIS classes E, F2 and G3 (Hettelingh et al. 2008, 2009, in prep.). In 1990, the area where more than 5% of biodiversity is at risk is clearly larger than in 2020 (Figure 1.10). In 1990 the area covers 288,000 km2 in the EU27 (24% of the EUNIS areas
E+F2+G3). In 2020 under the RGP this area is reduced to 68,400 km2 (about 6% of these EUNIS classes).
Figure 1.8 European ecosystem area exceeded (in %; left) and exceedance (AAE in eq ha–1a–1; right) of CLnutN as function of uniform
emission reductions (RGP 2020=100%) of NOx (green lines), NH3 (blue) and total N (turquoise).
NOx NH3 0 10 20 30 40 50 60 70 80 90 100 0 10 20 30 40 50 60 70 80 90 100 Emission reduction in % of 2020 10 20 30 40 50 % area exceeded
CLnutN: Exceeded area (%)
NOx NH3 Emission reduction in % of 2020 20 40 60 80 100 120 AAE (eq/ha/a)
CLnutN: Exceedance (AAE)
Figure 1.9 European ecosystem area exceeded (in %; left) and exceedance (AAE in eq ha–1yr–1; right) of acidity CLs as function of
uniform emission reductions (RGP 2020=100%) of total N (turquoise line), total S (red) and total S+N (black). Note the much smaller scale on the vertical axes than in Figure 1.8.
N S Emission reduction in % of 2020 1 2 3 4 5 % area exceeded
Acidity CLs: Exceeded area (%)
N S Emission reduction in % of 2020 2 4 6 8 10 12 14 AAE (eq/ha/a)
Acidity CLs: Exceedance (AAE)
1.6 Acidification and eutrophication
under the RGP with 2012
knowledge
Figure 1.11 illustrates the exceedance of critical loads using the European database that was updated under the ICP M&M in 2011/12 (CL28) and the recent EMEP model (EMEP28).
The areas at risk of both acidification and eutrophication under RGP in 2020 computed with CL28 and EMEP 28 (Figure 1.11) reveal a similar pattern to that shown in Figures 1.1 and 1.6, respectively. Areas with relatively high exceedances continue to be found in the bordering area of the Netherlands and Germany (acidification) and in the north of Italy and western France (eutrophication). However, in comparing the result of new to old methods, in particular with respect to the risk of eutrophication, lower exceedances are found in e.g. the United Kingdom, France and Poland, and higher ones in Romania, Russia and Spain. Changes are due to updated critical loads sent by NFCs and an update of the background database (Reinds et al. 2008) that the CCE uses for countries that do not submit data. Whether or not to use the background database when a country only partially submits data, e.g. critical loads for acidity but not for eutrophication, will need to be considered in an appropriate session of the TF M&M meeting and be confirmed by the WGE.
It turns out that 7% of the EU27 area (4% in Europe) is at risk of acidification and 62% at risk of eutrophication (42% in Europe) when using CL50 and EMEP50. When the exceedances are computed using CL28 and EMEP28 these percentages become 4% and 57% in the EU-27 (3 % and 50% in Europe, respectively). Russia did not submit new critical loads. Therefore, the background database was used to obtain higherresolution European critical load maps. This, in combination with the EMEP28 model, leads to an increased risk of eutrophication in Russia and, consequently, also in Europe compared with the risk computed with 2008 data.
1.7 Summary and conclusions
The revision of the Gothenburg Protocol improves the protection against the risk of acidification, eutrophication and changes in biodiversity in 2020. When using the critical loads database of 2008 (as prescribed by the Executive Body at the start of the negotiations) in combination with the EMEP model on a 50x50 km2 gridthe area at risk of acidification covers 7% of the ecosystem area in the EU27 in 2020 (22% in 2000) while the risk of eutrophication extends over 62% (76% in 2000) of the ecosystems in the EU27. Over the whole of Europe these areas cover 4% (12% in 2000) and 42% (54% in 2000) respectively. Applying more stringent emission reductions reduces the risk further. For example, the application of
Figure 1.10 Changes (red shading) by more than 5% in species diversity in EUNIS classes E and F2 and in similarity in EUNIS class G3
in 1990 (top left), 2000 (top middle), 2010 (top right) and in 2020 under the Revised Gothenburg Protocol (bottom left) and Maximum Feasible Reductions scenario (bottom right).
change > 5%
Change in biodiversity (E,F2,G3) 1990
Dep-data: EMEPCCE
change > 5%
Change in biodiversity (E,F2,G3) 2000
Dep-data: EMEPCCE
change > 5%
Change in biodiversity (E,F2,G3) 2010
Dep-data: EMEPCCE
change > 5%
Change in biodiversity (E,F2,G3) GP 2020
Dep-data: EMEPCCE
change > 5%
Change in biodiversity (E,F2,G3) MFR 2020
Maximum Feasible Reductions in 2020 would yield a marked reduction of the area at risk of acidification down to 3% in the EU27 (1% in Europe), and of eutrophication of to about 38% in the EU27 (22% in Europe).
This chapter has also described the results when using new critical loads in combination with the most recent
dispersion model by EMEP. Thus, using this combination on the new grid (i.e. 28×28km2), it turns out that the areas
at risk of acidification and eutrophication in Europe under GP2020 cover about 3% and 50% respectively. The risk of eutrophication in Europe is computed to increases by more than 10% when using the new model combination. For the EU27 the difference between the old and new models is less pronounced, i.e. 7% (old) compared to with 4% (new) for acidification and 62% (old) against 57% (new) for eutrophication. Both old and new model computations confirm the persistence of a significant risk of eutrophication.
The assessment of changes in biodiversity in this chapter was limited to an illustrative application of dose-response functions for specified EUNIS classes, indicating that a considerable European area remains subject to a change of more than 5% under the Revised Gothenburg Protocol. Ongoing research, including under the ECLAIRE project (FP7) of the EC, aims to extend the application of dynamic models to identify additional endpoints to assess the change of biodiversity.
Figure 1.11 Areas where critical loads (CL28) for acidification (left) and eutrophication (right) are exceeded by acid depositions
(EMEP28) caused by emissions in 2020 projected under the Revised Gothenburg Protocol.
eq ha-1a-1 no exceedance 0 - 200 200 - 400 400 - 700 700 - 1200 > 1200 Exceedance of acidity CLs RGP 2020
Dep-data: EMEP/MSC-WCCE
eq ha-1a-1 no exceedance 0 - 200 200 - 400 400 - 700 700 - 1200 > 1200 Exceedance of CLnutN RGP 2020
References
Hettelingh J-P, Posch M, Bobbink R, Alkemade R, 2008. Tentative dose-response function applications for integrated assessment. In: Hettelingh J-P, Posch M, Slootweg J (eds) Critical load, dynamic modelling and impact assessment in Europe: CCE Status Report 2008. ISBN: 978-90-6960-211-0, Bilthoven, pp. 83–90; www. rivm.nl/cce
Hettelingh J-P, Posch M, Slootweg J, 2009. Effect-oriented assessment of the 2009 PRIMES baseline scenario. In: Hettelingh J-P, Posch M, Slootweg J (eds), 2009. Progress in the modelling of critical thresholds, impacts to plant species diversity and ecosystem services in Europe: CCE Status Report 2009. ISBN: 978-90-78645-32-0, Bilthoven, pp. 15–30; www.rivm.nl/cce
Hettelingh, J-P, Stevens CJ, Posch M, Bobbink R, De Vries W (in prep.) Assessing the impacts of nitrogen deposition on indicator values of plant species in Europe.
Reinds GJ, Posch M, De Vries W, Slootweg J, Hettelingh J-P, 2008. Critical loads of sulphur and nitrogen for
terrestrial ecosystems in Europe and Northern Asia using different soil chemical criteria. Water, Air and Soil Pollution 193, 269–287; doi:10.1007/s11270-008-9688-x
Reis S, Grennfelt P, Klimont Z, Amann M, ApSimon H, Hettelingh J-P, Holland M, LeGall A-C, Maas R, Posch M, Spranger T, Sutton MA, Williams M, 2012. From acid rain to climate change. Science 338, 1153–1154; doi:10.1126/ science.1226514
Posch M, Slootweg J, Hettelingh J-P (eds) 2011. Modelling critical thresholds and temporal changes of
geochemistry and vegetation diversity: CCE Status Report 2011, ISBN 978-90-6960-254-7, Bilthoven; www. rivm.nl/cce
Simpson D, Benedictow A, Berge H, Bergström R, Emberson LD, Fagerli H, Flechard CR, Hayman GD, Gauss M, Jonson JE, Jenkin ME, Nyiri A, Richter C, Semeena VS, Tsyro S, Tuovinen J-P, Valdebenito A, Wind P (2012) The EMEP MSC-W chemical transport model – technical description. Atmospheric Chemistry and Physics 12, 7825–7865
Jaap Slootweg, Maximilian Posch, Jean-Paul Hettelingh
2.1 Introduction
At its 30th Session (Geneva, 27–29 September 2011), the
Working Group on Effects requested the CCE to issue a Call for Contributions. The focus was to be on the use and testing of the dynamic modelling of changes in plant species diversity. This, and a meeting with experts from within the community, led to a call for (see Appendix A for the complete text):
i. An overview of endpoints considered by the NFCs; ii. Application of biodiversity indices as summarised in
the CCE Status Report 2010;
iii. Comparison of simulation results using different models;
iv. Comparison of simulation results using different sites;
v. Policy relevance: NFCs are invited to include nature protection areas (such as Natura 2000 areas) in their model testing;
vi. Review the possibilities to use EUNIS classes, habitat classes and eco-regions as a basis for
regionalisation;
vii. Enlargement of the Veg database.
Countries also had an opportunity to update their critical load data.
The CCE prepared a spreadsheet with the AICHI targets (www.cbd.int/sp/targets/) and the EU’s SEBI2010 (ec. europa.eu/environment/nature/biodiversity/comm2006/ pdf/2020/1_EN_ACT_part1_v7[1].pdf) indicators for NFCs to use as a reference to indicate the relevant endpoints for the countries. Software including the VSD+ model, with the Veg module was also made available by the CCE. An Access version had been prepared to import site data, run VSD+ and Veg and calculate biodiversity indices. For technical reasons not all NFCs were able to apply the Access software.
2.2 NFC responses
Twelve countries replied to (part of the) call; see Table 2.1 for a list.
Both Bulgaria and Lithuania re-sent data submitted earlier (see previous Status Reports). These submissions are not included in this report.
Endpoints
Only Austria, Germany and Switzerland reflected on the matter of biological endpoints, and Ireland explicitly stated that ‘national indicators and indices of biodiversity
2
are, as yet, undefined but will be discussed during 2012’. None of the responses related indicators to indices, but all see a role for soil-vegetation modelling in the future to quantify biodiversity indicators.
Soil-vegetation modelling for sites
NFCs were called upon to investigate their measurement sites in order to improve soil-vegetation modelling, focusing on comparison of simulation results using different
models and comparison of simulation results using different sites.
The Dutch collaborating institution (Alterra) has been very helpful in testing the VSD software and evaluating the Dutch and other sites.
We received data, ready to perform model runs, from nine countries. Austria tested VSD+ and from the resulting soil chemistry applied the BERN and Veg vegetation models. Germany applied VSD+ in combination with BERN. They compared the resulting species compositions to the initial composition and to reference species compositions from Natura2000 sites. France used ForSAFE-Veg on 27 sites, submitted one of them, and did a sensitivity analysis to identify important input factors. They also analysed the effects for the CLE and the MFR deposition scenarios in combination with the A2 and B1 climate scenarios corresponding to high and low global warming, respectively, on all sites. Ireland and Romania submitted site data without (much) comment.
The Dutch compared the SMART2 model with VSD+, especially the fractions of nitrogen in the soil that decomposes or immobilises. Italy is working on
completing the data and calibrating of ICP Forest Level-II plots. Slovenia applied VSD+Veg on two sites. They found it hard to use the GrowUp software to model uptake as part of the VSD+ input preparations, mainly because there are no clear-cuts in the natural areas they focus on. They
also found poor matches of their Veg results with actual species compositions. Switzerland made comparisons of VSD, VSD+ and ForSAFE with Veg. They found strikingly poor results for nitrate concentration using VSD+ and poor results regarding species composition for all model combinations A systematic bias occurred with respect to the number of species; On average the modelled number of species exceeded that of the observed number of species by an order of magnitude. However, the
distributions of Czekanowski indices for all the sites were very similar across the models.
More details and results can be found in the national reports (Part 3 of this report) on the testing of soil vegetation models.
Regionalisation
No regionalised datasets with vegetation modelling were submitted to the CCE, but some NFCs (Germany, Sweden and Switzerland) included considerations in their national reports. Generally, looking at the comments from testing by experts at site level in recent years one can summarise that modelling the abundance of species at a site is very difficult, especially with many species under consideration, and that stratifying by (detailed) EUNIS could be helpful in reducing the number of considered species.
Updated critical loads
Germany, Ireland, Poland and Sweden updated their critical loads. Each of these four countries had submitted critical loads in 2011; thus there is no change in countries for which the European background database is used. In the Annex to this chapter Table 2.A shows the complete set of ecosystems (numbers and area) by ecosystem type (EUNIS code) and origin (national or background
database), per country and for eutrophication, acidity and
Table 2.1 Summary of NFC responses to the Call for Contributions
Country Endpoints Sites CL update Nat report
AT Report 14 X CH Report 32* X DE Table+Report 4 X X FR 27* X IE 4 X X IT 1 X NL 3 X NO X PL X X RO 5 X SE X X SI 2 X Total 12 3 9 countries 4 12
empirical critical loads of N.
In 2011 it was not possible to convert previously (before 2011) submitted national data due to the smaller grid size now used. Therefore, only national data submitted in 2012 or 2011 are incorporated in the European database. This is indicated in Table 2.A by numbers printed in bold. The critical load data from all other countries are taken from the background database. A clearer indication of the origin of the dataset is Table 2.2, which shows the year of the latest submitted dataset.
Figures 2.1 and 2.2 show the cumulative distributions for 2011 and 2012 of CLmaxS and CLnutN, respectively, for the countries that submitted updated critical loads. It should be noted that changes between 2011 and 2012 in CLmaxS are small; forests (EUNIS code G) in Poland are considered less sensitive than before, Ireland included aquatic
ecosystems (EUNIS code C) and Sweden assessed their aquatic ecosystems to be more vulnerable than in 2011, resulting in very low values for some ecosystems. The most noticeable national updates for CLnutN are grasslands in Poland (EUNIS code E). In addition, wetlands (EUNIS class D) in Poland and Germany are less sensitive than in 2011. This is mainly explained by updates in the limits for the acceptable nitrogen concentration. This is demonstrated in Figure 2.3, which shows the values of [N]acc per EUNIS class in 2011 and 2012.
Table 2.2 National 5×5 km2 datasets within the European database and year of their submission
Country Code Nutrient N Empirical N Acidity
AT 2011 2011 2011 BE (Flanders) 2011 2011 2011 BG 2011 2011 2011 CH 2011 2011 2011 CZ 2011 2011 2011 DE 2012 2011 2012 FI - 2011 -FR 2011 2011 2011 IE 2012 2012 2012 IT 2011 - 2011 NL 2011 2011 2011 NO - 2011 2011 PL 2012 2011 2012 SE 2012 2012 2012 SI 2011 2011 2011
Figure 2.1 Cumulative distribution functions of updates for CLmaxS in 2011 and 2012, colours indicate EUNIS codes A to G
DE
IE
PL
SE
2011 CLmaxS
0 400 800 1200 1600 eq ha-1a-1 A B C D E F G 42 184 100 1524 2000413 120606 1180406 26419 2868 53241 > 1600 127 125173 2406 17164DE
IE
PL
SE
2012 CLmaxS
0 400 800 1200 1600 eq ha-1a-1 A B C D E F G 39 17062 1418 1965393 120392 221 630112660 87880 2991556 > 1600 73 209806 2406 17164Figure 2.4 shows the previous and the new 5th percentile
maps for the critical loads for modelled nutrient N (CLnutN), the empirical critical loads of N (CLempN) and the maximum critical load of S (CLmaxS). Although the resolution of the data is 5×5 km2, the maps are aggregated
and plotted on the 25×25 km2 grid for the purpose of
‘readability’.
The maps show that the 5th percentile critical loads (i.e.
protecting 95% of ecosystems) for CLnutN changes mostly in Poland, Germany and Ireland. There are no changes for CLempN, and no striking differences for CLmaxS between 2011 and 2012, except in Poland.
Remarks of NFCs regarding their critical loads
Germany updated its long-term annual mean (1980–2010) of temperature and precipitation and three-year average for base cation depositions, which have a minor effect on the critical loads. Ireland added critical loads of acidity for surface waters, refined the terrestrial receptor habitat ecosystem map, revised base cation and N uptake for
managed forests and updated its empirical critical loads based on the 2010 revisions. Poland improved the ecosystems map regarding grasslands, and their base cation (and Cl) depositions, but above all, harmonised the acceptable N concentration with the German NFC, resulting in much higher critical loads.
Furthermore, France updated their ecosystem map, but made no submission of updated critical loads. Details can be found in the national reports in Part 3.
Figure 2.2 Cumulative distribution functions of updates for CLnutN in 2011 and 2012, colours indicate EUNIS codes A to G
DE
IE
PL
SE
2011 CLnutN
0 400 800 1200 1600 eq ha-1a-1 A B C D E F G 42 184 100 1524 2000413 120606 26419 2868 53241127 125173 17164DE
IE
PL
SE
2012 CLnutN
0 400 800 1200 1600 eq ha-1a-1 A B C D E F G > 1600 39 17062 1418 1965393 120392 85586 2991556 73 209806 17164Figure 2.3 Cumulative distribution functions of updates for [N]acc in 2011 and 2012, colours indicate EUNIS codes A to G
DE
IE
PL
SE
2011 [N]
acc 0 100 200 300 400 meq m3 A B C D E F G 42 184 100 1524 2000413 120606 26419 2868 53241127 125173 17164DE
IE
PL
SE
2012 [N]
acc 0 100 200 300 400 meq m3 A B C D E F G 42 184 100 1524 2000413 120606 32128 630112660 87881 2991556 73 209806 17164Figure 2.4 5th percentile of CLnutN (top), CLempN (middle) and CLmaxS (bottom) in 2011(left) and 2012 (right) eq ha-1a-1 < 200 200 - 400 400 - 700 700 - 1000 1000 - 1500 > 1500 CLnutN 5thperc 2011 CCE eq ha-1a-1 < 200 200 - 400 400 - 700 700 - 1000 1000 - 1500 > 1500 CLnutN 5thperc 2012 CCE eq ha-1a-1 < 200 200 - 400 400 - 700 700 - 1000 1000 - 1500 > 1500 CLempN 5thperc 2011 CCE eq ha-1a-1 < 200 200 - 400 400 - 700 700 - 1000 1000 - 1500 > 1500 CLempN 5thperc 2012 CCE eq ha-1a-1 < 200 200 - 400 400 - 700 700 - 1000 1000 - 1500 > 1500 CLmaxS 5thperc 2011 CCE eq ha-1a-1 < 200 200 - 400 400 - 700 700 - 1000 1000 - 1500 > 1500 CLmaxS 5thperc 2012 CCE
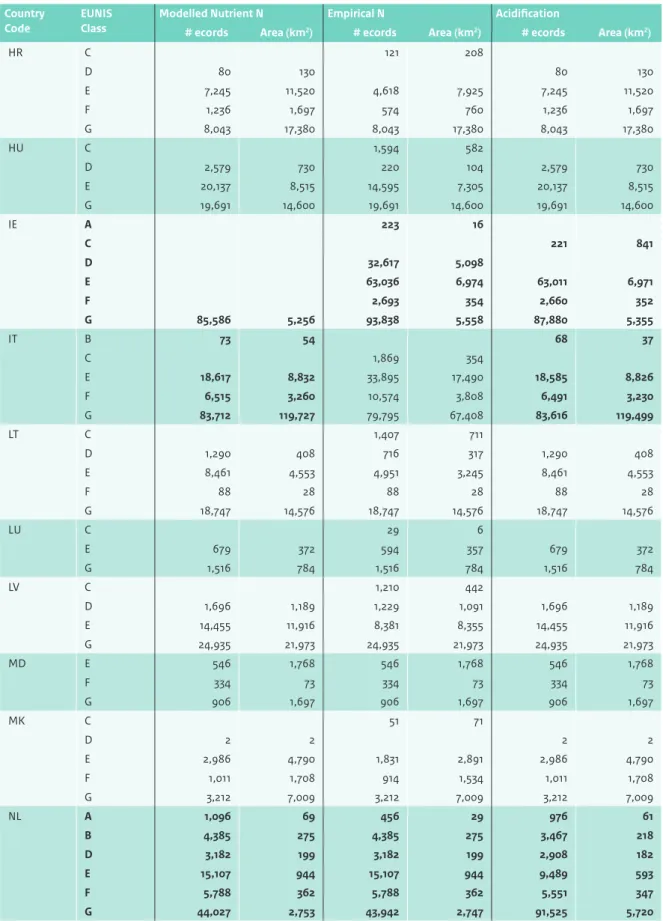
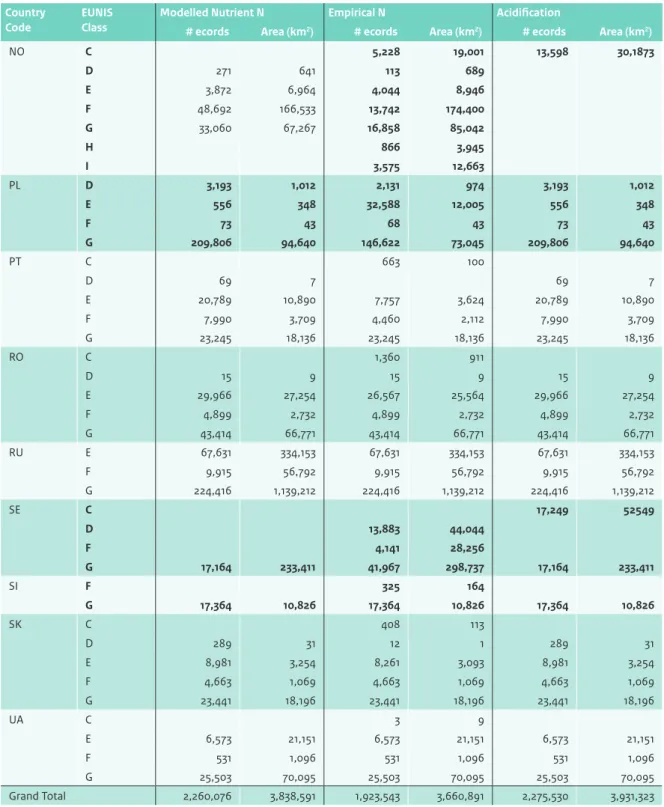
Annex 2.A
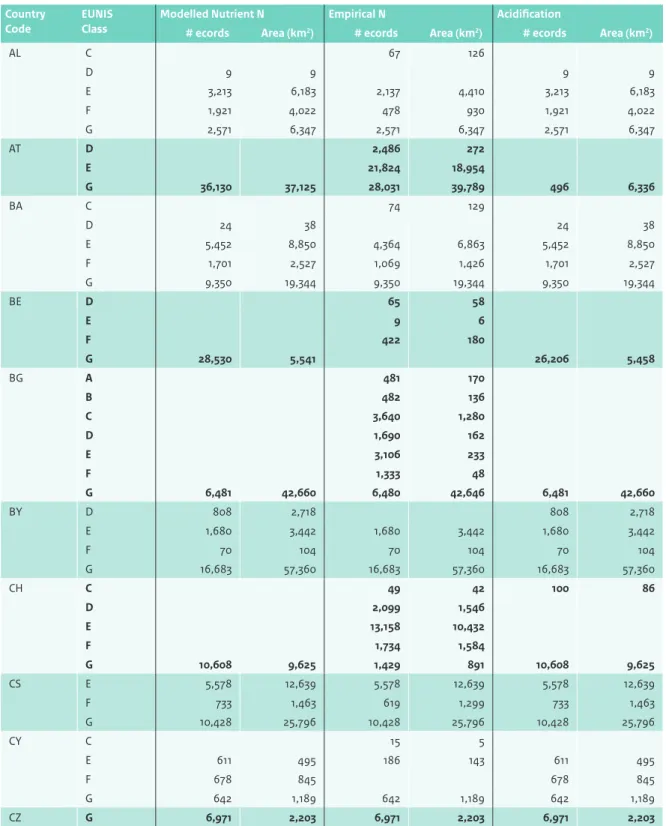
Table 2.A Number of ecosystems (# ecords) and their area for which critical loads have been submitted (bold) or are taken from the
background database in Europe
Country Code
EUNIS Class
Modelled Nutrient N Empirical N Acidification
# ecords Area (km2) # ecords Area (km2) # ecords Area (km2)
AL C 67 126 D 9 9 9 9 E 3,213 6,183 2,137 4,410 3,213 6,183 F 1,921 4,022 478 930 1,921 4,022 G 2,571 6,347 2,571 6,347 2,571 6,347 AT D 2,486 272 E 21,824 18,954 G 36,130 37,125 28,031 39,789 496 6,336 BA C 74 129 D 24 38 24 38 E 5,452 8,850 4,364 6,863 5,452 8,850 F 1,701 2,527 1,069 1,426 1,701 2,527 G 9,350 19,344 9,350 19,344 9,350 19,344 BE D 65 58 E 9 6 F 422 180 G 28,530 5,541 26,206 5,458 BG A 481 170 B 482 136 C 3,640 1,280 D 1,690 162 E 3,106 233 F 1,333 48 G 6,481 42,660 6,480 42,646 6,481 42,660 BY D 808 2,718 808 2,718 E 1,680 3,442 1,680 3,442 1,680 3,442 F 70 104 70 104 70 104 G 16,683 57,360 16,683 57,360 16,683 57,360 CH C 49 42 100 86 D 2,099 1,546 E 13,158 10,432 F 1,734 1,584 G 10,608 9,625 1,429 891 10,608 9,625 CS E 5,578 12,639 5,578 12,639 5,578 12,639 F 733 1,463 619 1,299 733 1,463 G 10,428 25,796 10,428 25,796 10,428 25,796 CY C 15 5 E 611 495 186 143 611 495 F 678 845 678 845 G 642 1,189 642 1,189 642 1,189 CZ G 6,971 2,203 6,971 2,203 6,971 2,203
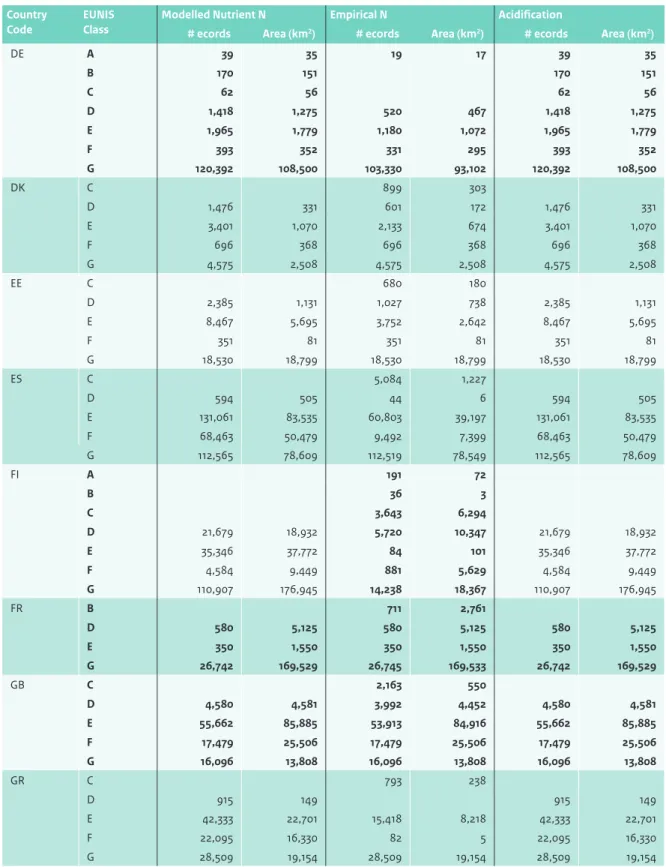
Table 2.A Number of ecosystems (# ecords) and their area for which critical loads have been submitted (bold) or are taken from the background database in Europe
Country Code
EUNIS Class
Modelled Nutrient N Empirical N Acidification
# ecords Area (km2) # ecords Area (km2) # ecords Area (km2)
DE A 39 35 19 17 39 35 B 170 151 170 151 C 62 56 62 56 D 1,418 1,275 520 467 1,418 1,275 E 1,965 1,779 1,180 1,072 1,965 1,779 F 393 352 331 295 393 352 G 120,392 108,500 103,330 93,102 120,392 108,500 DK C 899 303 D 1,476 331 601 172 1,476 331 E 3,401 1,070 2,133 674 3,401 1,070 F 696 368 696 368 696 368 G 4,575 2,508 4,575 2,508 4,575 2,508 EE C 680 180 D 2,385 1,131 1,027 738 2,385 1,131 E 8,467 5,695 3,752 2,642 8,467 5,695 F 351 81 351 81 351 81 G 18,530 18,799 18,530 18,799 18,530 18,799 ES C 5,084 1,227 D 594 505 44 6 594 505 E 131,061 83,535 60,803 39,197 131,061 83,535 F 68,463 50,479 9,492 7,399 68,463 50,479 G 112,565 78,609 112,519 78,549 112,565 78,609 FI A 191 72 B 36 3 C 3,643 6,294 D 21,679 18,932 5,720 10,347 21,679 18,932 E 35,346 37,772 84 101 35,346 37,772 F 4,584 9,449 881 5,629 4,584 9,449 G 110,907 176,945 14,238 18,367 110,907 176,945 FR B 711 2,761 D 580 5,125 580 5,125 580 5,125 E 350 1,550 350 1,550 350 1,550 G 26,742 169,529 26,745 169,533 26,742 169,529 GB C 2,163 550 D 4,580 4,581 3,992 4,452 4,580 4,581 E 55,662 85,885 53,913 84,916 55,662 85,885 F 17,479 25,506 17,479 25,506 17,479 25,506 G 16,096 13,808 16,096 13,808 16,096 13,808 GR C 793 238 D 915 149 915 149 E 42,333 22,701 15,418 8,218 42,333 22,701 F 22,095 16,330 82 5 22,095 16,330 G 28,509 19,154 28,509 19,154 28,509 19,154
Table 2.A Number of ecosystems (# ecords) and their area for which critical loads have been submitted (bold) or are taken from the background database in Europe
Country Code
EUNIS Class
Modelled Nutrient N Empirical N Acidification
# ecords Area (km2) # ecords Area (km2) # ecords Area (km2)
HR C 121 208 D 80 130 80 130 E 7,245 11,520 4,618 7,925 7,245 11,520 F 1,236 1,697 574 760 1,236 1,697 G 8,043 17,380 8,043 17,380 8,043 17,380 HU C 1,594 582 D 2,579 730 220 104 2,579 730 E 20,137 8,515 14,595 7,305 20,137 8,515 G 19,691 14,600 19,691 14,600 19,691 14,600 IE A 223 16 C 221 841 D 32,617 5,098 E 63,036 6,974 63,011 6,971 F 2,693 354 2,660 352 G 85,586 5,256 93,838 5,558 87,880 5,355 IT B 73 54 68 37 C 1,869 354 E 18,617 8,832 33,895 17,490 18,585 8,826 F 6,515 3,260 10,574 3,808 6,491 3,230 G 83,712 119,727 79,795 67,408 83,616 119,499 LT C 1,407 711 D 1,290 408 716 317 1,290 408 E 8,461 4,553 4,951 3,245 8,461 4,553 F 88 28 88 28 88 28 G 18,747 14,576 18,747 14,576 18,747 14,576 LU C 29 6 E 679 372 594 357 679 372 G 1,516 784 1,516 784 1,516 784 LV C 1,210 442 D 1,696 1,189 1,229 1,091 1,696 1,189 E 14,455 11,916 8,381 8,355 14,455 11,916 G 24,935 21,973 24,935 21,973 24,935 21,973 MD E 546 1,768 546 1,768 546 1,768 F 334 73 334 73 334 73 G 906 1,697 906 1,697 906 1,697 MK C 51 71 D 2 2 2 2 E 2,986 4,790 1,831 2,891 2,986 4,790 F 1,011 1,708 914 1,534 1,011 1,708 G 3,212 7,009 3,212 7,009 3,212 7,009 NL A 1,096 69 456 29 976 61 B 4,385 275 4,385 275 3,467 218 D 3,182 199 3,182 199 2,908 182 E 15,107 944 15,107 944 9,489 593 F 5,788 362 5,788 362 5,551 347 G 44,027 2,753 43,942 2,747 91,525 5,720
Table 2.A Number of ecosystems (# ecords) and their area for which critical loads have been submitted (bold) or are taken from the background database in Europe
Country Code
EUNIS Class
Modelled Nutrient N Empirical N Acidification
# ecords Area (km2) # ecords Area (km2) # ecords Area (km2)
NO C 5,228 19,001 13,598 30,1873 D 271 641 113 689 E 3,872 6,964 4,044 8,946 F 48,692 166,533 13,742 174,400 G 33,060 67,267 16,858 85,042 H 866 3,945 I 3,575 12,663 PL D 3,193 1,012 2,131 974 3,193 1,012 E 556 348 32,588 12,005 556 348 F 73 43 68 43 73 43 G 209,806 94,640 146,622 73,045 209,806 94,640 PT C 663 100 D 69 7 69 7 E 20,789 10,890 7,757 3,624 20,789 10,890 F 7,990 3,709 4,460 2,112 7,990 3,709 G 23,245 18,136 23,245 18,136 23,245 18,136 RO C 1,360 911 D 15 9 15 9 15 9 E 29,966 27,254 26,567 25,564 29,966 27,254 F 4,899 2,732 4,899 2,732 4,899 2,732 G 43,414 66,771 43,414 66,771 43,414 66,771 RU E 67,631 334,153 67,631 334,153 67,631 334,153 F 9,915 56,792 9,915 56,792 9,915 56,792 G 224,416 1,139,212 224,416 1,139,212 224,416 1,139,212 SE C 17,249 52549 D 13,883 44,044 F 4,141 28,256 G 17,164 233,411 41,967 298,737 17,164 233,411 SI F 325 164 G 17,364 10,826 17,364 10,826 17,364 10,826 SK C 408 113 D 289 31 12 1 289 31 E 8,981 3,254 8,261 3,093 8,981 3,254 F 4,663 1,069 4,663 1,069 4,663 1,069 G 23,441 18,196 23,441 18,196 23,441 18,196 UA C 3 9 E 6,573 21,151 6,573 21,151 6,573 21,151 F 531 1,096 531 1,096 531 1,096 G 25,503 70,095 25,503 70,095 25,503 70,095 Grand Total 2,260,076 3,838,591 1,923,543 3,660,891 2,275,530 3,931,323
Maximilian Posch, Jean-Paul Hettelingh, Jaap Slootweg
3.1 Introduction
In 2001 the European Parliament and the Council adopted the National Emission Ceilings (NEC) Directive, regulating EU Member State emissions of acidifying and eutrophying pollutants as well as ozone precursors (EC 2001). The required emission reductions in each Member State were determined by objectives for environmental and human health. In a recent study (EEA 2012), carried out on behalf of the European Environment Agency (EEA), it has been investigated whether the (interim) environmental objectives have been met by EU Member States. In this chapter we summarise the results of that study with respect to the acidification and eutrophication targets; for results concerning the ground-level ozone objectives the reader is referred to the EEA report (EEA 2012).
The environmental objectives of the NEC Directive were set with the support of scientific methodologies and data available until 2001 for the modelling of atmospheric dispersion and deposition of acidifying and eutrophying pollutants, and the computation of critical thresholds (as well as the concentration of ground-level ozone). Using this scientific knowledge, non-exceedance of critical loads of acidification was to be achieved in more than 50 percent of terrestrial and aquatic ecosystem areas ‘in each grid cell’ of the dispersion model, compared with the situation in
1990 (EC 2001, article 5a). The eutrophication target was that the EU area (the ‘community area’) with depositions of nitrogen (N) in excess of the nutrient N critical loads was to ‘be reduced by about 30 percent compared with the situation in 1990’ (EC 2001, Annex 1, footnote 1). Scientific and technological knowledge used to assist in setting the above-mentioned objectives (‘old’ knowledge) has improved since the adoption of the NEC Directive in 2001. The frame of reference expressed in the Directive’s text as ‘the situation in 1990’ was based on an integrated assessment of (a) 2001 estimates of historical emissions for 1990 and projections for 2010, (b) a dispersion model version available in 2001 computing only grid-average depositions (and concentrations) on a 150×150 km2 grid
(the EMEP150 grid) used for 15 (instead of the current 27) Member States and (c) the European critical load database of 1998 addressing mostly terrestrial ecosystems with an emphasis on forest soils and aquatic ecosystems. The same knowledge has been used in support of the Protocol ‘to abate acidification, eutrophication and ground-level ozone’ to the LRTAP Convention (UNECE 1999). In contrast, ‘present’ knowledge includes data from national emission inventories for 1990 and 2010, a dispersion model modelling ecosystem-specific depositions on a 50×50 km2
grid (the EMEP50 grid), a critical loads database that distinguishes ecosystems following the European Nature Information System (EUNIS; Davies and Moss 1999), and improved critical loads, of nitrogen in particular.
3
Assessing NEC Directive
Objectives for Acidification
and Eutrophication with
2001 and Present
Knowledge
3.2 Old and present scientific
knowledge
In this section methods and data available in 2001 – which were used to support the development of the NEC Directive (old knowledge) – are compared with those available now (present knowledge).
3.2.1 Emissions and atmospheric transport
The emission data used in the computation of atmospheric dispersion and impacts for 1990 and 2010 underwent changes over the last 10 years due to the introduction of climate and energy policies, emission reductions driven by the economic transition of Eastern European countries, and the extension of the EU from 15 to 27 Member States. Scientific knowledge on emissions (e.g. new sources, improved emission factors) has developed since the NEC Directive was agreed. New insights have become available with respect to emission factors of road transport, agriculture and consumers. Moreover, Member States have improved their emissions inventories. Over the past years increasingly detailed activity data have been provided and more detailed methodologies for calculating emissions applied. For
details regarding emission data see Annex 1 of the EEA Report (EEA 2012).
In 2001 the single-layer lagrangian EMEP atmospheric dispersion and transport model (Eliassen et al. 1982, EMEP 1998) was used for calculating annual average depositions (and concentrations) on the EMEP150 grid. The model did not provide land cover-specific depositions (except sea areas); only grid-average depositions were available. To reduce the influence of a single meteorological year, depositions were averaged over 12 years (1985–1996) of meteorological data. Currently the more sophisticated multi-layer eulerian EMEP model (Tarrasón et al. 2003, Simpson et al. 2012) is used, with meteorology averaged over five years (1996–98, 2000, 2003). This model has been used to establish relationships between European country emissions and specific ecosystem depositions (forests, semi-natural vegetation, open land) on the EMEP50 grid in the form of so-called source-receptor matrices.
Figure 3.1 compares the deposition in 1990 of oxidised and reduced nitrogen as well as sulphur computed with the lagrangian model of 1998 (old knowledge) and with the eulerian model (present knowledge).
Figure 3.1 Total (wet+dry) 1990 grid-average deposition of NOx (left), NHy (centre) and S (right) (all in eq ha–1a–1) computed with
old (lagrangian model; top) and present knowledge (eulerian model; bottom)
eq ha-1a-1 < 200 200 - 500 500 - 800 800 - 1100 > 1100 NOx deposition 1990
Dep-data: EMEP/MSC-WCCE
eq ha-1a-1 < 200 200 - 500 500 - 800 800 - 1100 > 1100 NHy deposition 1990
Dep-data: EMEP/MSC-WCCE
eq ha-1a-1 < 200 200 - 500 500 - 800 800 - 1100 > 1100 S deposition 1990
Dep-data: EMEP/MSC-WCCE
eq ha-1a-1 < 200 200 - 500 500 - 800 800 - 1100 > 1100 NOx deposition 1990
Dep-data: EMEP/MSC-WCCE
eq ha-1a-1 < 200 200 - 500 500 - 800 800 - 1100 > 1100 NHy deposition 1990
Dep-data: EMEP/MSC-WCCE
eq ha-1a-1 < 200 200 - 500 500 - 800 800 - 1100 > 1100 S deposition 1990
It can be seen that the eulerian dispersion model shows larger areas of high deposition, particularly for nitrogen. As depositions decrease substantially between 1990 and 2010 due to emission reduction, differences between the lagrangian and eulerian model persist. Both models reveal considerably smaller areas with high depositions in 2010 (Figure 3.2), but the eulerian model better identifies the location of peak depositions, especially for S. Figure 3.2 also shows that between 1990 and 2010 NOx depositions
have been reduced more than NHy depositions.
3.2.2 Critical loads of N and S
During the past two decades, critical loads of nitrogen and sulphur have been used under the LRTAP Convention and the NEC Directive to support effects-based emission reduction agreements (Hettelingh et al. 1995, 2001, 2007). The critical load database of 1998 was used for the support of the NEC Directive and the Gothenburg Protocol to the LRTAP Convention, while the 2008 database was used for the review and revision of Gothenburg Protocol. The 1998 database of critical loads (Posch et al. 1999) was improved over the years (e.g. Slootweg et al. 2008) thanks to updates submitted by National Focal Centres. For countries that did not submit critical loads data to the
2008 database critical loads were taken from the so-called European background database (Posch et al. 2005; see also Reinds et al. 2008), which for the whole of Europe now includes about 700,000 receptors. The update was necessary for a number of reasons including the need to increase the resolution of mapped critical loads to the EMEP50 grid and the introduction of EUNIS classes (Davies and Moss 1999). Compared with the European background data used in 1998, which covered only forest ecosystems (EUNIS G), semi-natural vegetation (EUNIS classes D, E and F) is now also included. This leads to a broader range of critical loads for nitrogen in particular, based on a range of critical nitrogen concentrations in soil solution varying between 0.2 and 6.5 gN m–3 (De Vries et al. 2007). The
present critical load database covers an area of about 4.22 Tm2 of ecosystems for which critical loads for acidity were
computed, and 3.86 Tm2 with critical loads for
eutrophication.
A critical load is said to be exceeded – and the area is said to be at risk (of acidification and/or eutrophication) – if the deposition is greater than the critical load (‘outside’ the critical load function in case of acidification). The ‘average accumulated exceedance’ (AAE; Posch et al. 2001) can be computed for a single ecosystem (in which case it is simply
Figure 3.2 Total (wet+dry) 2010 grid-average deposition of oxidised (left) and reduced (centre) nitrogen, and sulphur (right)
computed with old (lagrangian model; top) and present knowledge (eulerian model; bottom)
eq ha-1a-1 < 200 200 - 500 500 - 800 800 - 1100 > 1100 NOx deposition 2010
Dep-data: EMEP/MSC-WCCE
eq ha-1a-1 < 200 200 - 500 500 - 800 800 - 1100 > 1100 NHy deposition 2010
Dep-data: EMEP/MSC-WCCE
eq ha-1a-1 < 200 200 - 500 500 - 800 800 - 1100 > 1100 S deposition 2010
Dep-data: EMEP/MSC-WCCE
eq ha-1a-1 < 200 200 - 500 500 - 800 800 - 1100 > 1100 NOx deposition 2010
Dep-data: EMEP/MSC-WCCE
eq ha-1a-1 < 200 200 - 500 500 - 800 800 - 1100 > 1100 NHy deposition 2010
Dep-data: EMEP/MSC-WCCE
eq ha-1a-1 < 200 200 - 500 500 - 800 800 - 1100 > 1100 S deposition 2010
the exceedance), a grid cell, or a whole region/country for which critical loads and deposition values are available; it is the area-weighted average of individual exceedances over all ecosystems in the respective (mapping) unit. Figure 3.3 maps the exceedance (AAE) for acidification as well as the ecosystem areas at risk (i.e. areas with an AAE > 0) in 1990. In comparison with applying old knowledge, exceedances computed with the eulerian model using ecosystem-specific depositions combined with the 2008 critical loads database show a larger area at risk and higher exceedances, extending to Eastern Europe in particular. Results for 2010 (Figure 3.4) indicate that the risk of acidification is markedly reduced compared with 1990 – in terms of both magnitude and extent. However, grid cells where the risk of acidification (bottom right map) persists (non-grey shaded area) are found in many of the Western and Central European countries.
3.3 Results
Are acidification objectives met?
Applying the methods and data summarised in the previous chapter, Figure 3.5 shows the locations of the grid cells where the area at risk of acidification has been reduced by more than 50 % (green shading), as required under the NEC Directive. Blue shading indicates grid cells where the critical loads are no longer exceeded. Yellow shading indicates that the exceedances are close to zero. Assessing the goals of the NEC Directive with the old knowledge shows that there are only four grid cells in the EU-27 where the area at risk of acidification has not reduced by more than 50% in comparison with 1990 (Figure 3.5, left): one in northern Germany (also EU-15), one at the Hungarian–Romanian border and two in Sicily, but those are due to volcanic emissions. Using present knowledge, however, there are many EMEP150 grid cells, mostly in western and eastern EU countries, that do not meet the Directive’s requirements (Figure 3.5, centre). The right-hand map in Figure 3.5 shows the present knowledge on the EMEP50 grid, showing that there are many more acidification ‘hot spots’ that are averaged out on the EMEP150 grid.
Figure 3.3 Exceedances (AAE, in eq ha–1a–1) of the critical loads of acidity (top) and areas (percent of ecosystem area in a grid cell) at
risk of acidification (bottom) in 1990 computed with the lagrangian model combined with the 1998 critical load database (old knowledge; left) and eulerian model combined with the 2008 critical load database (present knowledge; right)
eq ha-1a-1 no exceedance <200 200 - 400 400 - 700 700 - 1200 > 1200 Exceedance of acidity CLs 1990
Dep-data: EMEP/MSC-WCCE
eq ha-1a-1 no exceedance <200 200 - 400 400 - 700 700 - 1200 > 1200 Exceedance of acidity CLs 1990
Dep-data: EMEP/MSC-WCCE
% eco-area no exceedance <20 20 - 40 40 - 60 60 - 80 > 80 Exceeded area 1990
Dep-data: EMEP/MSC-WCCE
% eco-area no exceedance <20 20 - 40 40 - 60 60 - 80 > 80 Exceeded area 1990
The conclusion from Figure 3.5 is that old knowledge confirms the achievement of the NEC Directive objectives for acidification in almost all grid cells. However, when present knowledge is used, they are violated in many grid cells spread over EU Member States.
Are eutrophication objectives met?
For the risk of eutrophication we included a grid-specific assessment for reasons of completeness and
comparability to the analysis of acidification. It shows that the area at risk of eutrophication is reduced by less than 30% (red shading) in most grid cells of EU area, both under old and present knowledge (Figure 3.6).
Figure 3.4 Exceedance (AAE, eq ha–1a–1) of the critical loads of acidity (top) and areas (percent of ecosystem area in a grid cell) at risk
of acidification (bottom) in 2010 computed with the lagrangian model combined with the 1998 critical load database (old knowl-edge; left) and eulerian model combined with the 2008 critical load database (present knowlknowl-edge; right)
eq ha-1a-1 no exceedance <200 200 - 400 400 - 700 700 - 1200 > 1200 Exceedance of acidity CLs 2010
Dep-data: EMEP/MSC-WCCE
eq ha-1a-1 no exceedance <200 200 - 400 400 - 700 700 - 1200 > 1200 Exceedance of acidity CLs 2010
Dep-data: EMEP/MSC-WCCE
% eco-area no exceedance <20 20 - 40 40 - 60 60 - 80 > 80 Exceeded area 2010
Dep-data: EMEP/MSC-WCCE
% eco-area no exceedance <20 20 - 40 40 - 60 60 - 80 > 80 Exceeded area 2010
Dep-data: EMEP/MSC-WCCE
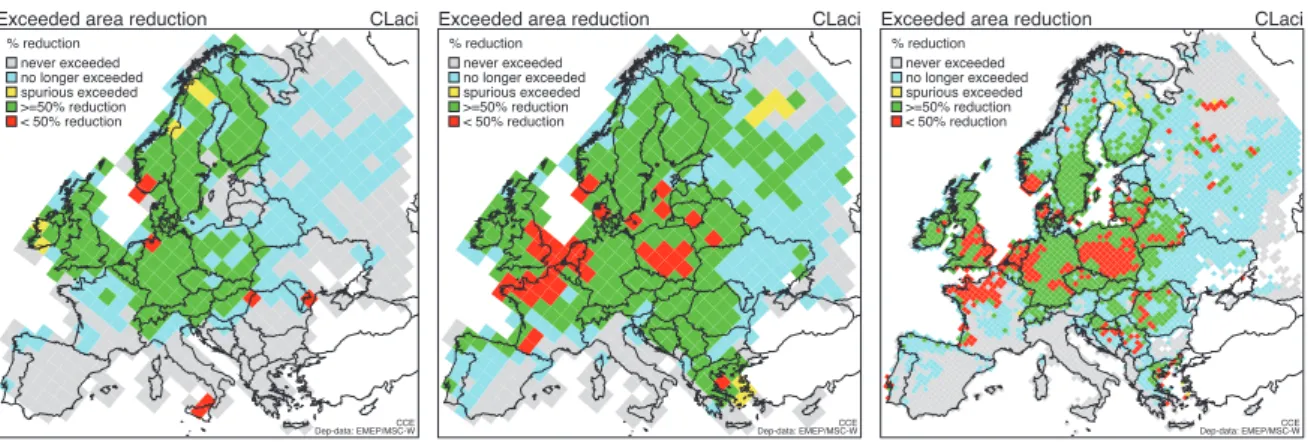
Figure 3.5 Grid cells where the area at risk of acidification has been reduced by more than 50% (green) and grid cells where the NEC
Directive requirements are not met (red) according to old knowledge (left), and present knowledge summarised on the EMEP150 grid (centre) and on the EMEP50 grid (right) (blue are grid cells where critical loads are no longer exceeded, and yellow cells indicate an exceedance close to zero)
% reduction never exceeded no longer exceeded spurious exceeded >=50% reduction < 50% reduction
Exceeded area reduction CLaci
Dep-data: EMEP/MSC-WCCE
% reduction never exceeded no longer exceeded spurious exceeded >=50% reduction < 50% reduction
Exceeded area reduction CLaci
Dep-data: EMEP/MSC-WCCE
% reduction never exceeded no longer exceeded spurious exceeded >=50% reduction < 50% reduction
Exceeded area reduction CLaci
However, when looking at the community area as whole – as stipulated in the NEC Directive – it turns out that, using old knowledge, the reduction of the area at risk of eutrophication (Table 3.1) is reduced by about 30% in the EU-15 as a whole (34% in the EU-27). Of course, the distribution of the eutrophication protection over Member States varies: in 11 EU-27 Member States less than 30% reduction of the area at risk of eutrophication is achieved (Table 3.1). However, the use of present knowledge confirms the violation of NEC Directive objectives also at community level. In this case, the computed reduction of the community area at risk turns out to be less than 30% (22.8% in the EU-15 and 22.5% in the EU-27; not tabulated).
3.4 A sensitivity analysis
To gain insight into the relative influence of the changed atmospheric dispersion model and the updated critical loads, a sensitivity analysis is performed whereby (a) the average depositions instead of ecosystem-specific depositions computed with the eulerian model are used for calculating the AAEs in both 1990 and 2010, and (b) NEC Directive objectives are reviewed using the 2008 critical load database in combination with average depositions computed with the lagrangian and eulerian model. When old knowledge on atmospheric transport (lagrangian model) is combined with new knowledge on critical loads (2008 database) a few more grid cells do not meet the Directive’s objectives for acidification
Figure 3.6 The location of grid cells where the area at risk of eutrophication is reduced by more (green shading) and less (red
shading) than 30% in comparison with the 1990 situation when using old (left) and present (right) knowledge
% reduction never exceeded no longer exceeded spurious exceeded >=30% reduction < 30% reduction
Exceeded area reduction CLnutN
Dep-data: EMEP/MSC-WCCE
% reduction never exceeded no longer exceeded spurious exceeded >=30% reduction < 30% reduction
Exceeded area reduction CLnutN
Dep-data: EMEP/MSC-WCCE
Figure 3.7 The location of grid cells where the area at risk of acidification is reduced by more than 50 % (green shading) in
compari-son with the 1990 situation and grid cells where the NECD requirements are not met (red shading) when combining new (2008) critical loads with the lagrangian model (left) and with average (instead of ecosystem-specific) depositions computed with the eulerian model (right)
% reduction never exceeded no longer exceeded spurious exceeded >=50% reduction < 50% reduction
Exceeded area reduction CLaci
Dep-data: EMEP/MSC-WCCE
% reduction never exceeded no longer exceeded spurious exceeded >=50% reduction < 50% reduction
Exceeded area reduction CLaci