Population and Scenarios: Worlds to Win?
H.B.M. Hilderink
This investigation has been performed by order and for the account of RIVM, within the framework of project S/550012, Environment, Population and Health
Abstract
Demographic developments have played an important role in the structure and functioning of the Earth’s system. The exponential population growth of the last century has led to high pressures on the environmental system, with the issue of hunger as representative of harmful effects. Despite the fact that the population growth is currently negative in some of the world’s regions, the world population is expected to increase, at least in the next couple of decades. Looking at the three basis components of the demographic changes, fertility, mortality and migration, one can better understand the dynamics and changes in size and structure of future populations. De simultaneous developments of these components are known as the demographic transition theory.
There are several institutions involved in developing and publishing population projections. The Population Division of the United Nations is possibly the best known institution, responsible for population projections up to 2050 for the majority of countries in the world. In addition to the UN projections, other projections are made on the national (e.g. the Netherlands) and regional scales (e.g. European). However, with different institutions developing projections at different aggregation levels, inconsistencies over the various geographical scales are almost inevitable. Furthermore, rock-solid sets of assumptions are often lacking, and uncertainties are only included by the definition of high, medium and low variants.
One of the ways to deal with uncertainties may be application of a scenario. Instead of covering up uncertainties with rather meaningless variants, a scenario methodology allows one or more consistent images of the future to be created. The IPCC has applied this methodology to gain better insights into future emission paths, resulting in an advanced and useful set of scenarios. In this approach, the two most relevant trends to cover most of the future uncertainties have been distinguished. These trends are globalization versus regionalization, and individualism/market orientation versus collectivity. Their combination will result in four scenarios.
The scenario approach has been applied to three aggregation levels, the Netherlands, Europe and the 17 major world regions. In these applications the assumptions on fertility, mortality and migration are, to the furthest extent, based on the underlying socio-economic and environmental determinants. By using the same methodology in all applications, a set of scenarios is created that is consistent for the various geographical scales. The associated simulation results show an assorted set of images of the future population.
Samenvatting
Bevolkingsontwikkelingen hebben een zeer belangrijke rol gespeeld bij het functioneren van het natuurlijk systeem. De hoge bevolkingsgroei in de afgelopen eeuw heeft geleid tot een hoge druk op het milieu, waarvan de voedselproblematiek een van de voorbeelden is waarin deze druk zichtbaar wordt. Alhoewel de bevolking in bepaalde regio’s aan het afnemen is, zal de wereldbevolking nog verder stijgen, in ieder geval de komende decennia. Door te kijken naar de drie basiscomponenten van de demografische veranderingen d.w.z. fertiliteit, mortaliteit en migratie, kan de dynamiek van veranderingen in omvang maar ook in structuur van de toekomstige bevolking, beter begrepen worden. De samenhang en verandering van deze componenten wordt beschreven in de theorie van de demografische transitie.
Er zijn diverse instellingen die bevolkingsprojecties maken. De bekendste is wellicht de Verenigde Naties die voor de meeste landen projectie tot 2050 maken. Daarnaast worden er op nationale (bijvoorbeeld Nederland) en regionale schaal (bijvoorbeeld Europa) ook projecties gemaakt. Doordat deze projectie door verschillende instellingen gemaakt worden ontbreekt de consistentie over de schaalniveaus. Ook de onderbouwing van de veronderstellingen die ten grondslag liggen aan deze projecties ontbreken nogal eens, en de onzekerheden worden vaak slechts gepresenteerd in varianten: hoog, midden en laag.
Een mogelijkheid om beter om te gaan met onzekerheden is het gebruik van scenario’s. In scenario’s wordt getracht een of meerdere consistent beelden van de toekomst te geven. Door de IPPC is deze methodiek toegepast om een beter inzicht te krijgen in toekomstige emissies. Deze zeer bruikbare toepassing gaat uit van twee trends die tezamen een groot deel van de onzekerheden ten aanzien van toekomstige ontwikkelingen dien af te dekken. Deze trends zijn globalisering versus regionalisering, en individualisme / marktwerking versus collectivisme. De combinatie van deze twee dimensies resulteert in 4 scenario’s.
Deze scenariomethodiek is toegepast op Nederland, Europa en de 17 belangrijkste
wereldregio’s waarbij de veronderstellingen voor fertiliteit, mortaliteit en migratie zoveel mogelijk gebaseerd zijn op achterliggende sociaal-economische en milieu-gerelateerde ontwikkelingen. Doordat een zelfde benadering gebruikt is voor de diverse schaalniveaus worden consistente bevolkingsprojecties verkregen. De resultaten voor de drie
schaalniveaus laten zien dat, gegeven de twee scenariodimensies, een grote diversiteit van toekomstbeelden verkregen wordt.
CONTENTS
Abstract 3 Samenvatting 4 Table of figures 6 1. Introduction 7 2. Demographic developments 92.1 Elements of demographic change 9
2.2 Demographic transition 12
3. Future population 15
3.1 Existing population projections 16
3.2 Discussion of projections 20
4. Scenarios in brief 23
4.1 What is a scenario? 23
4.2 Scenario types 23
4.3 Scenario development 27
5. Population & Scenarios 29
5.1 The four worlds 30
5.2 Demography in SRES 31
5.3 Discussion of SRES 33
6. Towards consistent population scenarios 35
6.1 Stepwise procedure towards population scenarios 35
6.2 Population in SRES revisited 37
7. Applications 43
7.1 The Netherlands 43
7.2 Europe 45
7.3 The World 48
8. Conclusions and recommendations 55
References 57
Appendix 1 Population Projections 61
Appendix 2 SRES Economic Scenarios 69
Table of figures
Figure 1. Total Fertility Rate for major regions, 1950-2000. 10
Figure 2. Life expectancy at birth for major regions, 1950-2000. 10 Figure 3. Distribution of causes of death, in Africa and Europe, 2000. 11 Figure 4. Migration rates and the total number of net migrants for major regions, 1950-2000. 12
Figure 5. The three stages of the demographic transition. 12
Figure 6. Age pyramids for countries at different stages of the demographic transition 14
Figure 7. Linkage of different geographical scale. 24
Figure 8. PSIR representation of the human and environmental system. 25
Figure 9. Quantitative versus qualitative scenarios. 26
Figure 10. Four scenarios in SRES. 29
Figure 11. Four population projections of the scenarios. 32
Figure 12. Rich-to-poor income ratio for the four SRES scenarios and history. 37 Figure 13 Historical pattern and assumptions for the Netherlands, 1950-2000. 44
Figure 14. Results for the Netherlands, 2000-2050. 45
Figure 15. Population in millions, simulation results for the clusters in Europe, 2000-2050. 47 Figure 16. Population in millions, simulation results for the EU-15, 2000-2050. 48
Figure 17. Results for the World Population, 2000-2100. 51
Figure 18. Results for the World, Population in billions by region, 2000-2100. 52 Figure 19. Results for the selection of regions/countries, old age dependency ratio, 2000-2100. 53
Figure 20. UN World Population Prospects, 1950-2050. 61
Figure 21. UN Long Range Global Population, 2000-2100. 62
Figure 22. TARGETS projections, 1995-2100. 63
Figure 23. IIASA Global Population projections, 1995-2100. 64
Figure 24. EUROSTAT EU15 Population projections, 1995-2050. 65
Figure 25. CBS/NiDi Europe Population projections, 1995-2050. 66
Figure 26. CBS/NiDi Netherlands Population projections, 1995-2050. 67 Figure 27. SRES Economic Scenarios Gross Domestic Product per capita. 69 Figure 28. SRES Economic Scenarios, GDP per capita as ratio of world average. 70
Figure 29. Clustering of European countries. 71
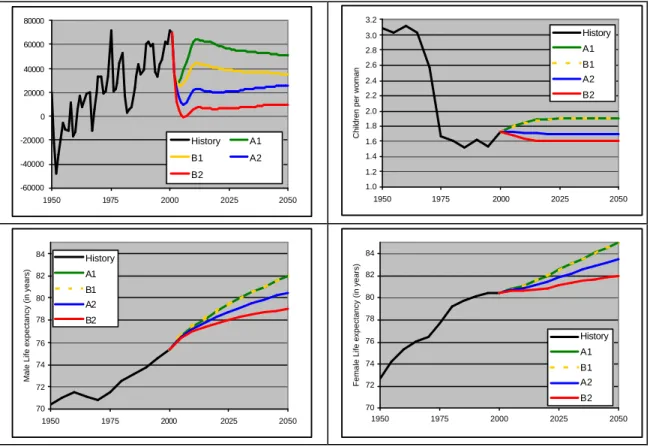
Figure 30. Average life expectancy for men and women for selected regions. 73
1.
Introduction
Throughout history, human activities have been recognized as an important factor affecting the structure and functioning of the Earth’s system. Future population developments are therefore useful to assess the pressure on environmental and economic resources. Future population developments are not only represented by the total population size. Changes in structure and composition are equally or even more important than a continuing growth of the population, especially given the long-term perspective. Ageing, changing household dynamics and increase of multi-cultural diversity are just some examples of enormous changes in society. However, the demographic input used in many environmental-oriented approaches is often restricted to the total size of the population and other developments are ignored.
The three basic demographic components fertility, mortality and migration determine population developments in size and structure. On the basis of a particular set of assumptions of these three components, various institutions provide a wide spectrum of population projections for the 21st century. However, the reasoning for the underlying assumptions is often rather weak or unclear, and consistency is consequently lacking. A model-based scenario approach can be helpful in assessing future developments. Unfortunately, there have been only few attempts to have a systematic description of the suppositions.
In this report, a cautious step is taken towards a more systematic connection between population projections and scenarios. First, various components of the demographic transition are described with a historical consideration of the main driving forces behind demographic changes. Secondly, an overview is given of existing population projections and scenario applications. The Intergovernmental Panel on Climate Change (IPPC) scenario study will be elaborated on. Finally, a framework is presented to provide population projections consistent with a specific scenario approach.
2.
Demographic developments
Demography is the science that studies developments in size, structure, composition and regional distribution of the population, and the societal causes and effects of these developments. In this report, the starting point of these demographic developments will be the population size and age structure since these facets have been more often the subject of studies exploring future developments. Nevertheless, the purpose of this report is to provide a broader scope and also include other relevant aspects like households and relationships, labour market, education, urbanization, ethnicity, and health and well-being.
2.1
Elements of demographic change
Population size and structure are determined by three fundamental demographic processes fertility, mortality and migration. For the first two, a generic pattern can be derived from historical patterns. A brief description of these demographic changes or transitions will be given below.
Fertility transition. This transition represents a shift from high total fertility rates1 (TFR) of around 7-8 children per woman to levels below 2.1 children per woman, the so-called replacement level2. The situation of high fertility is associated with a more traditional society in which children are used as farm labourers and serve as old-age security. This pre-transitional stage is characterized by a low marrying age and hardly any use of birth-control methods. The process of modernization brings a higher marrying age and spreading of birth-control methods. Higher ages at marriage and commonly used modern methods of contraception mark the last stage of the fertility transition in which low levels of the total fertility rate are obtained. In Figure 1, the fertility decline in major regions is shown for 1950-2000. In more developed countries, the initial decline in fertility has set in long before 1950 and the TFR has been below the replacement level for a couple of decades. The least developed countries, on the other hand, seem to have entered the phase of fertility decrease, although the TFR is still high, at a level of more than five children per woman.
1 TFR is the number of births that a woman would have at the end of her reproductive lifespan if current age-specific
fertility rates prevail.
2 Replacement level indicates the fertility level that implies zero population growth in the long term under the condition of
0 1 2 3 4 5 6 7 1950 -55 1955 -60 1960 -65 1965 -70 1970 -75 1975 -80 1980 -85 1985 -90 1990 -95 1995 -00
Children per woman Least developed
Less developed World
More developed
Figure 1 . Total Fertility Rate for major regions, 1950-2000 (Source: UN, 2000) .
Mortality or epidemiological transition. The epidemiological transition, also referred to as a component of the health transition (Frenk et al., 1993). This theory addresses changes in disease and mortality patterns, and the cond itions associated with these changes (Bobadilla et al., 1993, Omran, 1983). It describes the shift from low levels of around 30 years of life expectancy at birth to levels that may rise to above 80 or even 90 years (see Figure 2).
0 10 20 30 40 50 60 70 80 1950 -55 1955 -60 1960 -65 1965 -70 1970 -75 1975 -80 1980 -85 1985 -90 1990 -95 1995 -00 Years World More developed Less developed Least developed
Figure 2 . Life expectancy at birth for major regions, 1950-2000 (Source: UN, 2000).
The beginning of the epidemiological transition is characterized by poor conditions of sanitation, food provision and health services, as well as dominance of infectious diseases, causing high mortality rates, especially among children. The corresponding life expectancy at birth is very low, between 20 and 40 years. Later, improvements in overall cond itions cause a shift towards a situation in which infectious diseases are prevented by immunization programs or controlled by community health services. The elimination of infectious diseases makes way for chronic diseases associated with the elderly. In combination with improved health care, these chronic diseases are less lethal than infectious diseases, but cause relatively high morbidity levels. Most of the chronic diseases
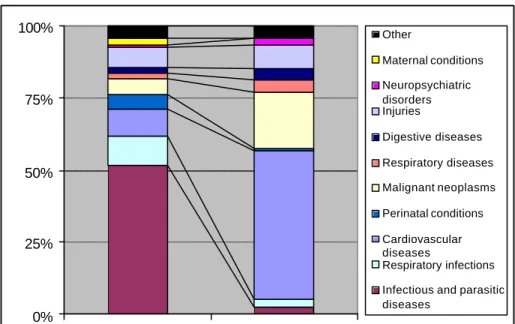
have declined in the Netherlands in the last 50 years, probably due to improved food preservation or changes in hygiene, nutrition and antibiotics. On the other hand, other causes of death (heart diseases, several types of cancer, traffic accidents and homicide) have shown an increase. These causes of death might be associated with behavioural factors like high cholesterol intake, smoking, and inactivity. Improved conditions like education, health services and female autonomy have paved the way in these countries to low mortality levels (Caldwell, 1993) with a corresponding life expectancy of around 75-80 years. Nevertheless, new emerging diseases can still cause a setback in the progress made by countries. Figure 3 illustrates the differences in mortality patterns well.
0% 25% 50% 75% 100% Africa Europe Other Maternal conditions Neuropsychiatric disorders Injuries Digestive diseases Respiratory diseases Malignant neoplasms Perinatal conditions Cardiovascular diseases Respiratory infections Infectious and parasitic diseases
Figure 3 . Distribution of causes of death in Africa and Europe, 2000 (Source: WHO, 2002).
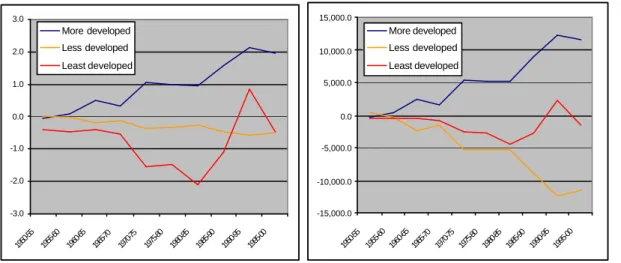
Migration process. The process of migration cannot be captured in such clear patterns as fertility and mortality. The underlying dynamics are affected by a complex of push-and pull-factors, but also by policy development and enforcement in many receiving countries. In addition, the state of migration statistics, not only on emigration and immigration, but also on net migration, hamper empirical foundation of any theory. However, some patterns can be distilled. International migrations have consistently moved towards regions of economic opportunity. Until World War I, the main flow consisted of Europeans seeking their fortunes in the USA, Canada, Australia, and South America (Bongaarts, 2000). After World War II this pattern had changed and migrants came increasingly from developing countries. The number of sending and receiving countries increased enormously, bringing about a high diversity of migrants. In 1990, the foreign-born population numbered 120 million, corresponding with just over 2% of the world population. This percentage remained at that level since 1965. Nowadays, the yearly net number of persons migrating to more developed countries is around 10 million (Figure 4).
-3.0 -2.0 -1.0 0.0 1.0 2.0 3.0 1950 -55 1955 -60 1960 -65 1965 -70 1970 -75 1975 -80 1980 -85 1985 -90 1990 -95 1995 -00 More developed Less developed Least developed -15,000.0 -10,000.0 -5,000.0 0.0 5,000.0 10,000.0 15,000.0 1950 -55 1955-60 1960-65 1965 -70 1970 -75 1975 -80 1980 -85 1985 -90 1990-95 1995-00 More developed Less developed Least developed
Figure 4 . Migration rates (per 1000 persons) and the total number of net migrants (x 1000) in major regions (note that the ‘least developed’ is part of the ‘less developed’), 1950-2000 (Source: UN, 2000).
2.2
Demographic transition
The profound transformation of changing fertility and mortality patterns is generally referred to as demographic transition (Notestein, 1945, Davis, 1945). The demographic transition can be characterized by three stages (see Figure 5). Each stage of the demographic transition is typified by a specific combination of fertility and epidemiological transition, as described above. Alas, the process of migration cannot be directly related to these stages, although aspects of push-and-pull factors of migration show some similarities. An advantage here is that the effect of migration on population growth has been small for the majority of countries, although this might change in the future.
Fertility Mortality
Stage 1 Stage 2 Stage 3
Figure 5 . The three stages of the demographic transition (Source: Niessen and Hilderink, 1997).
In the first or pre-transitional stage, both mortality and fertility are high, approximately cancelling each other out and resulting in a slow population growth. The occurrence of
infectious and parasitic diseases is usually responsible for mortality patterns, resulting in high infant and child mortality. Total fertility can vary appreciably as a result of changes in the propensity to marry and age at marriage. Birth control is restricted to traditional methods and hardly influences fertility levels. The characteristic population pyramid, representing age structure of a population, is broad at the bottom and steep in the direction of the higher ages. In Europe, fertility and mortality remained high until the mid-19th century. Almost all countries have now already passed this stage.
In the second or transitional stage, mortality starts falling, while fertility remains high; it or may even rise as a result of the erosion of old systems of control (Wrigley and Schofield, 1981). This period is characterized by a rapid population growth until fertility also starts to decline. Modern methods of contraception are introduced and widely spread. Most countries show a time lag before the fertility level drops, although some countries like Germany experienced a fertility drop coinciding with a decline in mortality rates (Coale, 1973). Most developing countries are in the second stage, some of them at the beginning (Sub-Sahara region) and others almost at the end (Frank and Bongaarts, 1991). The corresponding age pyramid shows some levelling off for the younger cohorts.
In the third or post-transitional stage, the populations that have completed the trans ition exhibit low levels of mortality and fertility, and little or no population growth. The shift of the causes of death from infectious diseases to chronic diseases has been completed. The developed countries are either in this stage of the transition, or have actually gone through this stage. The corresponding population pyramid shows the onset of the process of ageing. In many countries, the TFR is far below replacement level (e.g. Spain at 1.2 children per woman) and causes the population to decline if these fertility levels persist. This is accompanied by a continuing ageing of the population. Postponement of child-wish has resulted in relatively high ages of the mother at first birth, and to some extent even abandonment of child-wish.
This fourth, additional stage has been referred to as the second demographic transition by Lesthaeghe and Van de Kaa (1986) to describe major changes in demographic patterns in Western Europe from the 1960s onwards. Nowadays, all European populations are characterized by a life expectancy close to 80 years, mortality being confined to the older age groups and dominated by degenerative diseases, and a fertility level that, in general, is too low to guarantee replacement of generations. Yet there is some growth, attributable to the effect of the demographic momentum of higher fertility in the years 1945-1965, and a correspondingly large number of women in the reproductive age groups, combined with a rising tide of immigration from less-developed countries.
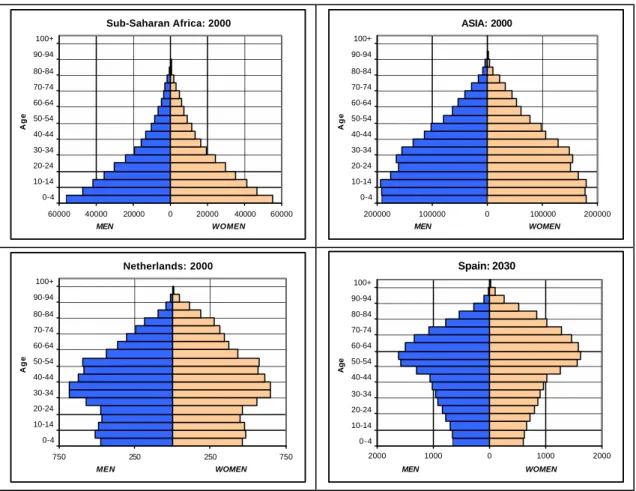
In the figure below, regions and countries are shown which represent different stages of the demographic transition. The 2030 situation is given for Spain (UN Medium projection),
which illustrates the dramatic effect of a TFR that remains below replacement level, with only a slight increase from 1.1 children in 2000 to 1.6 in 2050.
Sub-Saharan Africa: 2000 60000 40000 20000 0 20000 40000 60000 0-4 10-14 20-24 30-34 40-44 50-54 60-64 70-74 80-84 90-94 100+ Age MEN WOMEN ASIA: 2000 200000 100000 0 100000 200000 0-4 10-14 20-24 30-34 40-44 50-54 60-64 70-74 80-84 90-94 100+ Age MEN WOMEN Netherlands: 2000 750 250 250 750 0-4 10-14 20-24 30-34 40-44 50-54 60-64 70-74 80-84 90-94 100+ Age MEN WOMEN Spain: 2030 2000 1000 0 1000 2000 0-4 10-14 20-24 30-34 40-44 50-54 60-64 70-74 80-84 90-94 100+ Age MEN WOMEN
Figure 6 . Age pyramids for countries at different stages of the demographic transition (Source: UN, 2000, Spain 2030 medium variant).
The demographic transition is not an isolated process; it is part of a much broader transformation seen in a growing number of countries since the 18th century and commonly referred to as modernization (Easterlin, 1983). In the economic domain, this involves a rise in real output and wide-ranging innovations and improvements in the production, transportation and distribution of goods. On the demographic and social side, modernization involves significant alterations in fertility, mortality and migration, as well as in family size and structure, education and the provision of public health. At the level of the individual, modernization is characterized by an increased openness to new experience, increased independence from authority, belief in the efficacy of science, and ambitions for oneself and one’s children (Easterlin, 1983).
3.
Future population
Forecasting the size of a population has a long history. Frejka (1996) has provided us with an overview of existing long-range population projections dating from the time of Gregory King (1648-1719) at the end of the 17th century; he had even made estimates up to the year 20,000. The selected long-range population projections are defined as projections that span a century or more. The early long-range projections were based on mathematical extrapolation of total numbers or growth rates. In 1945, Notestein (1945) provided a general component framework for the calculation of global population trends based on assumptions for fertility, mortality and migration. The population projections since 1945 have applied and refined this methodology. Although the United Nations has become an authority in the field of population projections, other institutions like the U.S. Census Bureau, the World Bank and IIASA are also used as sources. On the basis of a particular set of assumptions on fertility, mortality and migration, these institutions provide a wide spectrum of population projections for the 21st century.
Box 1. Projection terminology
Projection refers to model-derived estimates of the future population, given a set of assumptions. Probabilistic Projection refers to model-derived estimates of the future population, given a distribution of the value of the assumptions, often based on a forecast.
Variant can be seen as a projection without any judgement of the likeliness of the assumptions. Forecast/Prediction is the most likely projection and is based on the most likely set of assumptions. A forecast usually covers a short- or medium-term period, since statements concerning the long-term (50-100 years) can hardly be labelled as 'most likely'.
Scenario is a coherent, internally consistent and plausible description of a possible state of the world (e.g. future population). A projection can be a part of a scenario, but also a more qualitative description (story) can characterize a scenario. A set of different scenarios can give a range in projections. Baseline/Reference refers to one particular projection or scenario that is often used to indicate differences between scenarios, taking this baseline as a gauge.
In the last 25 years, the methodology has been further refined by linking fertility, mortality and migration components to economic, social and environmental aspects instead of applying exogenously set assumptions. Applications of this third modelling approach are few: World3 (Meadows et al., 1974), Threshold21 (Millennium, 1996), TARGETS (Rotmans and De Vries, 1997) and PHOENIX (Hilderink, 2000). Even though the projection of population size is one of the outcomes, the aim of these models is to provide insights into the underlying mechanisms causing population growth and into the possible consequences of this growth. Although Cohen (1995) distinguishes a fourth method for population projection, namely, the stochastic population projection resulting in confidence intervals, this can be seen as a method to deal with uncertainty (e.g. see Lutz et al., 1997, Keilman, 2001). In this fourth method, assumptions for input variables concerning fertility, mortality and migration are taken stochastically where, for example, the UN provides non-probabilistic clusters of the assumptions. The non-probabilistic approach results in confidence
intervals while the UN results are clustered in variants, which are usually simply labelled as low, medium and high. The use of scenarios, i.e. the use of consistent sets of assumptions, representing a particular view on how future developments can be clustered, is still in an infant stage. The terminology of future images is not always used unequivocally or even considered to be interchangeable. Box 1 overviews the main terms and characteristics. However, the terminology in this report keeps to the original terminology used by institutions themselves, which is not always consistent with terms in the list below.
3.1
Existing population projections
Only a selection of population projections will be discussed here. This selection is based on the geographical coverage of the projections (preferably including the Netherlands, Europe and world regions) and the applications (providing a set of variants or scenarios). Table 1 shows an overview of this selection, with geographical coverage and brief remarks about the underlying assumptions. The next section will discuss the population projections in more detail. The accompanying figures showing the projection can be found in Appendix 1.
Table 1. Selection of population projections developed by various institutions.
Institution/Model Level of detail Scenarios/Variants/Forecast
UN World Population Projections (2000)
Global country-based
5-year age groups 1950-2050
Fertility: medium, high, low, constant, instant replacement (net reproduction rate3 equals 1)
Mortality: general, constant. Additional (NO) AIDS variants Migration: general and zero migration
UN Long-Range (1998)
Global 8 regions 5-year age groups 1950-2150 See UN WPP RIVM/TARGETS (1997) Global, 1 world 5 age groups 1900-2100
Nine variants consisting of three model variants or
perspectives and three perspectives of management styles
IIASA (2000) Global 13 regions 5-year age groups 1995-2100
Expert-based assumptions on fertility, mortality and migration
RIVM-Population Research Centre /PHOENIX (2000)
17 regions 1-year age groups 1950-2100
One scenario, fertility and migration based on socio-economic and environmental conditions, migration exogenous
Eurostat scenarios (1995-1999)
EU15+4
Age group: 5-year-olds 1950-2050
High-/Medium-/Low-based on high/medium/low assumptions for fertility, mortality and migration
CBS/Netherlands Interdisciplinary Demographic Institute (NiDi, 1999)
Europe 38 countries 1-year age groups year age
1996-2050
Two scenarios: diversity and uniformity based on a consistent set of fertility, mortality and migration assumptions
Statistics Netherlands (CBS, 2001)
The Netherlands 1-year age groups 1950-2050
Forecast with 67% and 97.5% confidence intervals
3 The average number of daughters that would be born to a woman if she passed through her lifetime conforming to the
3.1.1 UN World Population Prospects (2000)
The UN has a long history of population projections. The latest UN World Population Prospects (UN, 2000) consist of population projections up to 2050 for 228 countries (detailed statistics for 183 major countries). The UN also makes long-range projections up to 2150 based on a 1998 revision (United Nations-LR, 2000). The three variants (Medium, High and Low4) are actually only fertility variants, since the TFR is the only varying factor. Countries are clustered in three fertility categories. Assumptions corresponding with the three categories are made for each variant on the pace (change in the TFR per decade) or the convergence level (e.g. replacement level). Mortality is projected on the basis of the models for change of life expectancy. Clustering is not applied to mortality. In countries highly affected by the HIV/AIDS epidemic, estimates of the impact of the disease are made explicitly through assumptions on the future course of the epidemic, i.e. by projecting the yearly incidence of HIV infection.
The future path of international migration is set out on the basis of past international migration estimates and an assessment of the policy stance of countries with regard to future international migration flows. Migration differs only slightly for the three variants. It is based on numbers of migrants which are also assumed to be constant over time. No explanation is given on the source of these assumptions.
3.1.2 UN Long-range projections (based on the WPP 1998)
The Long-range World Population Projections, prepared by the United Nations Population Division (United Nations-LR, 2000), extend the World Population Prospects 1998 from 1950-2050 to 1950-2150. The results are presented for the world as a whole, and for six major areas and two large countries: Africa, Asia excluding China and India, Europe, Northern America, Latin America and the Caribbean, Oceania and China, and India. There are three scenarios more-or-less comparable with scenarios presented above: medium-fertility, in which fertility in all major areas stabilizes at replacement level by 2050 or thereafter; low-fertility, in which fertility is lower than in the medium-fertility scenario by about 0.5 child per woman after 2050; high-fertility, in which fertility is higher than in the medium-fertility scenario by about 0.5 children per woman after 2050). In addition, there are two intervening scenarios (low-medium fertility and high-medium fertility). In each of the scenarios, mortality is assumed to decline steadily during the projection period.
3.1.3 RIVM/TARGETS
The TARGETS model (Tool to Assess Regional and Global Environmental Health Targets for Sustainability) consists of five highly aggregated submodels (Population and Health, Energy, Land, Water and the Global Bio-chemical cycles) and an economic module
4 The UN also publishes several other variants (Constant fertility, Instant-replacement fertility, Constant mortality, Zero
resulting in scenarios for the gross world product. The model, which uses a systems dynamic approach, describes the Earth’s system including both the environmental and the human system. The various projections result from taking how the world functions into uncertainty (‘world view’) and how the world should be managed (‘management style’). These aspects of uncertainty are ‘filled in’ with the perspectives of the hierarchist, the egalitarian and the individualist on the basis of the cultural theory of Thompson (see Rotmans and De Vries, 1997). A worldview and management style have been combined to form one of nine possible futures. The population projections are based on different socio-economic and environmental conditions, influencing various aspects for fertility and morbidity/mortality. Since TARGETS is a one-world model, migration is not applicable.
3.1.4 IIASA
Another institute providing population projections is IIASA (Lutz, 1996). A multi-regional cohort-component model with five-year age groups and five-year projection intervals is used for these projections. Population projections for 13 world regions are obtained on the basis of high, low and central values for future fertility, mortality and migration levels. This modelling approach is rather extensive and advanced, although the withholding of information on vital assumptions and insights makes it hard to evaluate the approach and analyze model outcomes. The basis and justification of the assumptions is not explicitly given, but only referred to as being based on ‘the judgement of an interacting group of experts’ (Lutz, 1996, p. 42). Population projections are constructed on the basis of a combination of fertility, mortality and migration. In addition, interrelationships between fertility and mortality, but also between regions, are used to calculate confidence intervals (Lutz et al., 2001).
3.1.5 RIVM-Population Research Centre/PHOENIX
PHOENIX is a simulation model developed to assess the impact of developmental and policy factors on population dynamics (Hilderink, 2000). The model is part of an integrated framework of global change models developed by RIVM. In addition, a visualization package was developed to display the various components of population dynamics graphically. The model was used to assess the effect of such socio-economic factors as income and literacy on fertility behaviour using Bongaarts’ approach (Bongaarts and Potter, 1983) of proximate determinants for fertility (e.g. contraceptive use, age at marriage, divorce). The mortality approach is partly based on the population and health module used in TARGETS 1.0 (Niessen and Hilderink, 1997). In the Mortality subsystem, the population is subdivided by distinguishing people according to mortality risks strongly allied to socio-economic factors (e.g. poverty and education) and environmental factors (e.g. food availability and access to drinking water).
3.1.6 EUROSTAT
Eurostat collects and publishes demographic statistics for all EU15 countries at national, but also at a regional, level (NUTS3). National population projections are made on a regular basis up to the year 2050. The latest projections were made in 1995 with a revision of the assumptions and outcomes in 1999 (Eurostat, 2003). Although four additional EFTA countries (Norway, Switzerland, Iceland and Liechtenstein) are officially included, they have been left out here. Only straightforward assumptions are made for the 15 countries on life expectancy, total fertility rate and the net number of migrants. No further qualitative scenario embedding seems to be used. The results for the EU15 countries are presented in Appendix 1.
3.1.7 CBS/NiDi
For the European Population Conference (EPC) in The Hague in 1999, NiDi/CBS had developed two different population scenarios for all 33 countries in Europe. These two scenarios are Uniformity, where, in the long term, economic and cultural trends will converge and, consequently, differences across countries will decline, and Diversity, where differences will persist or even increase, resulting in different levels of fertility mortality and migration for various regions in Europe. In these scenarios, possible future images are depicted on the basis of cause and effect relationships. One major source of uncertainty is whether the differences in cultural and economic developments between countries will be reduced, remain at the same level or even increase. In view of these uncertainties, two different scenarios have been compiled for 33 European countries.
The first scenario, Uniformity, assumes that economic and cultural trends will, in the long term, converge and, consequently, differences between countries will disappear. In this scenario, increasing political integration and easy diffusion of cultural values are assumed, with successful transition from a communist to a capitalist economy for the former communist nations. Large economic growth, stimulated by internal free trade, will be achieved through a high rate of technological progress. The second scenario, Diversity, assumes that existing economic and cultural differences between countries will persist or increase. Political integration will be limited and will thus hamper the free market and, consequently, economic and technological growth.
3.1.8 Statistics Netherlands (CBS)
Statistics Netherlands published a population forecast in the Netherlands in 2000. This forecast is supposed to describe the most likely future demographic developments up to 2050. This forecast is based on assumptions on fertility, mortality and migration, specified by both emigration and immigration. The fairly advanced methodology used consists of mortality patterns related to six factors of influence, e.g. smoking, antibiotics, sex-differences, fertility related to women’s ideas about their expected number of children, educational level and migrants in the population. For the different categories of migrant
groups immigration number and re-migration chances are specified to determine the total migration flows.
Although the forecast is supposed to reflect the most likely future changes, forecasting over a period of 50 years involves many uncertainties. Confidence intervals reflecting the probability of deviations from the forecast have been calculated to take these uncertainties into account. For example, the population forecast for 2050 is 18 million, but with a probability of 67%, the range is 15.8 to 20.1 million, and for a 95% confidence interval, 14.4 to 22.8 million.
3.2
Discussion of projections
All the projections listed above cover a broad range of methodologies, geographical aggregation levels and projection periods. The UN WPP data show an extraordinary level of completeness, with widespread use and virtually no critical review of the results or questioning of assumptions. Especially assumptions concerning future fertility levels - the dominant factor for future population size – have only recently been adjusted to a more stateoftheart knowledge. For a long time, the medium and most commonly used -variant was based on the assumption of convergence to replacement levels, while the theoretical foundation was, and still is, lacking such an assertion. In addition, one of the most obvious shortcomings is the lack of feedback. The effect of possible food shortages on the mortality levels is not taken into account; this is especially relevant for Sub-Saharan Africa, where the population is expected to triple in the coming 50 years. Including variants for different mortality levels, and even migration, can partly solve this shortcoming. The IIASA modelling approach, on the other hand, is well described and is a good alternative to the UN projections. A point of criticism relates to the reasoning behind the assumptions; this could be better founded since a proper description is lacking. The use of probabilistic projection adds valuable insights to uncertainties concerning population projections. Another point of criticism is the homogenous approach of all countries and regions. In both the approaches, high scenario values are applied to all regions, while a combination of two trends in different regions is completely left aside.
The TARGETS model tries to deal with these feedbacks by applying a systems dynamic approach to the whole global system. One of the disadvantages is the high aggregation and abstraction level, which lacks any geographical diversity of population characteristics. The use of cultural perspectives to reveal unavoidable uncertainties in projection results in a valuable application. The PHOENIX model has a geographical dimension (17 world regions) and a strong integrated systems dynamic approach. However, since only the human system is described, no direct feedbacks of population growth on environmental conditions are taken into account.
For projections in European countries the CBS/NiDi approach is more advanced and transparent than the EUROSTAT projections. This approach represents one of the few attempts to apply the scenario methodology to population projections, although the basis (and with that the results) might already be superseded. The national projection made by Statistics Netherlands for the Netherlands might be one of the most advanced projections, especially regarding the specification of emigration and immigration. Specifying fertility and migration rates for all kinds of migrant groups is sophisticated, but so data-intensive that it can probably only be applied on a small scale. In the publication of a forecast - the most recent one with confidence intervals and previous ones with high and low variants – we can state how future developments might unfold. However, adjusting the peak level of a population of 0.7 million people (in the 1998 forecast, 17.4 million and in the 2000 forecast, 18.1 million) represents a 50% adjustment of what was supposed to be the most likely population increase two years ago.
4.
Scenarios in brief
Scenarios are widely used in all kind of approaches. There are different definitions in circulation. Originating in the theatre world, a scenario refers to a sequence of screenplays. Later, scenarios were used in mathematical war game strategies and are now widely applied to all kinds of scientific spheres. Since the time dimension plays an important role in scenarios, environmental sciences have welcomed the concept with open arms. There are now many examples of (environmentally oriented) scenario studies. In social sciences, on other hand, relationships tend to be multi-causal (Blossfeld and Rohwer, 1995) and often only the associative nature of social processes hampers the systematic exploration of future developments. Demography is one of the few exceptions in social sciences lending itself to scenario applications. However, it is especially these types of uncertain processes that could benefit from a scenario approach.
4.1
What is a scenario?
From the broad spectrum of scenario definitions in existence the most cited one is that: ‘scenarios are hypothetical sequences of events constructed for the purpose of focusing attention on causal processes and decision points’ (Kahn and Wiener, 1967). There are also other definitions commonly used, such as ‘Scenarios as archetypal descriptions of alternative images of the future created from mental maps or models that reflect different perspectives on past, present and future developments’ (Greeuw et al., 2000), or ‘Images of the future, or alternative futures that are neither predictions nor forecast, but an alternative image of how the future might unfold ’ (Alcamo, 2001).
The images of the future are not static snapshots, but a dynamic movie that consists of a logical sequence of possible images of the future, which, in turn, consist of states, events, action and consequences that are causally linked (Greeuw et al., 2000). As a result of causal interlinkage, internally consistent, plausible and recognizable stories are formed, which can then be used to construct (quantitative) scenarios.
4.2
Scenario types
There are different types of scenarios or ways to build scenarios. Various dimensions can characterize a scenario. Although the list of dimensions can be elaborated extensively, only a selection of these – the most relevant for population projections – will be described here.
Geographical scale. As shown above, population projections may have a high level of geographical aggregation, e.g. TARGETS with only one (world) population or rather extensive, such as the UN WPP giving projections for 238 countries. Often, a clustering is applied of countries expecting to have the same future patterns or changes. This clustering
is mostly based on geographical setting (CBS/NiDi) or on socio-economical characteristics (PHOENIX). The interaction between different geographical levels is recognized by several authors, but seldom included in the assumptions for projections. The effect of population growth, combined with economic inequities, on migration patterns is not explicitly taken into account in all approaches. Even within regions, like the EU, mutual influences between regions or countries are not included in scenarios.
Figure 7 . Linkage of different geographical scales (Source: Greeuw et al., 2000) .
Time horizon. For population scenarios, a long-term scale would seem more applicable. Population changes are rather slow; historical birth patterns are accountable for the current and near future age structure, although migration should be noted as well. Current changes, for example, in the number of children per woman, do not only have a direct effect on the number of young people now, but also an indirect effect after 25-30 years, this generation’s children. In demography this inertia is well-known as the so-called population momentum (Keyfitz 1985), a factor indicating to what extent a population would grow to a stable level if its fertility rates were immediately reduced to replacement levels and maintained at these levels. Fifty to hundred years seems an appropriate time span for following new generations completely.
Level of integration. This dimension deals with framing issues. The scenario approach can be narrow and single-theme (only taking demographic components, e.g. UN WPP, into account) or broad and integrated (considering interplay between economic, social and environmental processes, e.g. TARGETS and to less extent PHOENIX). The single-theme approach involves mainly single-discipline experts. By applying a causal chain approach, in which the single-theme scenarios are coupled or linked, the false impression of having reached an integrated approach can be created. An iterative methodology, in which the results of one theme are used as a feedback for other subsystems can result in soft
integration. The IPCC-SRES scenarios represent an example of coupled scenarios with no feedback (see next section).
Theme-specific approaches, which regard problems separately, have been complemented by integrated assessment (IA) approaches. The integrated approach results in a more consistent description, but also requires knowledge about the mutual interplay of various processes. IA modelling has facilitated a multi- or interdisciplinary approach. Two dimensions can be followed for integrating processes (Rotmans et al., 1997a):
•
Vertical integration or the closing of cause–effect relationships. This implies, for example, that the impacts of environmental changes on health outcomes are taken into account in overall demographic developments (and might result in adjustment of the environmental changes).•
Horizontal integration takes into account the cross-linkages and interactions between the subsystems. This dimension safeguards a level of consistency to some extent. For example, income distribution and poverty issues are important for demographic dynamics, but also for implementation and acceptance of all kinds of (environmental) policy measures.These two dimensions of integration are eminently applicable to the Pressure-State-Impact-Response organizing framework, which proved to be a helpful mechanism in structuring complex system (UNEP, 1997, Rotmans et al., 1997b, Hilderink, 2000). The vertical integration is implicitly incorporated in the PSIR mechanism by linking pressure variables to state variables, state variables to impact variables, impact variables to response variables and closing the cycle by linking response variables to state and pressure variables.
Human System Environmental System
RESPONSE PRESSURE
STATE IMPACT
Figure 8 . PSIR representation of the human and environmental systems (Source: Rotmans and De Vries, 1997) .
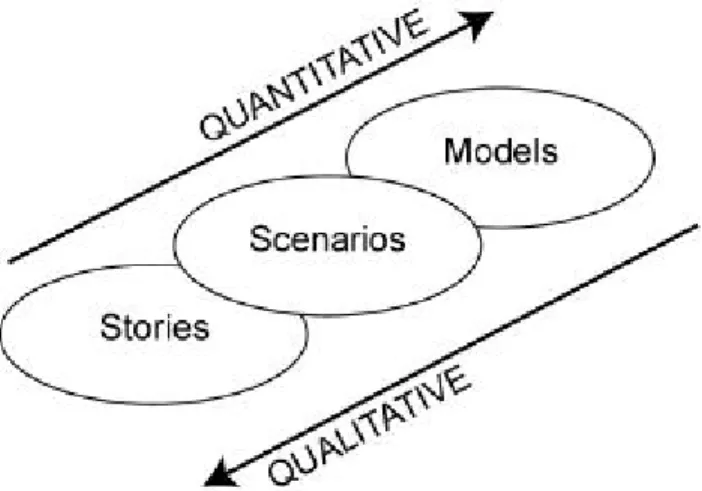
Qualitative versus quantitative. ‘Qualitative scenarios describe possible futures in the form of words or visual symbols rather than numerical estimates’ (Alcamo, 2001). On the basis of some key words, a narrative text or story line is developed which may form the context of a more quantitative scenario. The quantitative scenario is formed mainly by the
outcomes of a (computer simulation) model. The quantification of causal or associative relationships results in a numerical description of a selection of relevant variables over future periods. This description is only restricted to variables included in the model (i.e. those which can be quantified, and are relevant for the processes described by the model). Another disadvantage may be that a model is taken as a ‘truth machine’. Most uncertainties and (subjective) decisions about the structure of the model are covered up and the focus is only on a strict selection of a huge number of simulation results. On the other hand, consistency is guaranteed more than in a qualitative description since all relationships are formalized. In the TARGETS model these uncertainties are made transparent by the inclusion of cultural perspectives, one way to have a good mix of qualitative and quantitative aspects. Most of the population projections strongly emphasize a quantitative approach.
Figure 9 . Quantitative versus qualitative scenarios (Source: Nakicenovic and Swart, 2000).
Exploratory versus anticipatory. This is also referred to as forecasting versus backcasting, where the exploration or forecasting describes the future, taking the current situation as a starting point for exploring the future through persisting trends. The anticipatory scenarios take as a starting point a desirable future (or the definition of undesirable developments) and point out the possible pathways to this desired situation. These pathways can be achieved by all kinds of policy measures that will influence developments in a particular direction. This implies a normative description of desirability of developments. This scenario dimension can therefore also be regarded as descriptive versus normative. All projections described above are explorative scenarios. There’s no explicit inclusion of normative measures, although some models as TARGETS and PHOENIX include endogenous response behaviour, which can be seen as a normative reaction to changes in the system.
Baseline versus policy scenarios. This dimension is often applied in climate models. Since climate policies, which aim at reducing emissions, have a long-term effect on stabilizing concentrations, the timing or setting-in of policies results in a corresponding intensity of the
measurements. However, policy measures for population policies are less dominant than for environmental processes. Regulations for abortion or marriage, or the stimulation of contraceptive use can influence reproductive behaviour only slightly and the autonomous behaviour of individuals and couples could be leading factors. Health determinants (e.g. food availability and water quality) and the demand for health services are subjected to policies, but most projections don’t connect their mortality assumption with aspects like these. Migration could be the most easily influenced demographic component for policies, as more restrictive migration policies seem to be coming into fashion, especially within the EU. However, this is sometimes based on the erroneous idea of migration being a solution for ageing.
4.3
Scenario development
A step-wise scenario procedure should be applied to develop a scenario, as specified by the dimensions listed above. The scenario process distinguishes the following steps, derived from Alcamo (2001):
1) Selection and framing of the process or issue which will form the object of study: in this case, population size and structure, or demographic changes.
2) Driving forces: distinction of the main factors or determinants of influence on the process.
3) Base year, time horizon and time step.
4) Selection of a scenario type. This is based on the dimensions described above. This may be a storyline in which a narrative description is given of future images, but also a set of numerical assumptions. It may also be a combination of types: for example, first developing a set of qualitative storylines and then translating these storylines quantitatively into relevant model assumptions.
These procedural steps will be used as a guiding principle for the construction of demographic scenarios.
5.
Population & Scenarios
The next step is to link the dimensions of scenarios to the elements of demographic processes. There are or have been several initiatives to introduce consistent scenarios for both the human/social system and the environmental system. One of the most impressive ones is the Special Report on Emission Scenarios (SRES) by the intergovernmental panel for climate change (IPCC, Nakicenovic and Swart, 2000). The title of the report does not completely reflect the contents, since the scenarios covered a broad spectrum of developments. This study will be taken as a starting point in creating a framework for population scenarios.
In 1996, the IPCC decided to develop new emission scenarios, resulting in the SRES in 2000. The writing team of 28 lead authors and an additional 26 contributors constructed four scenario families, each with its own storyline and model-based quantification. They differ in assumptions on driving forces like population, economic activity and technology, but also in assumptions about specific measures and policies with regard to the North-South income gap, poverty and trade issues, and environmental problems.
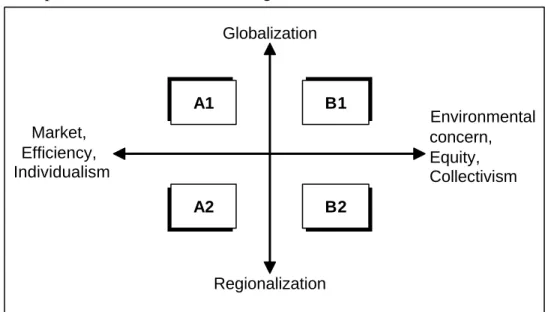
The four scenarios are formed by the combination of two dimensions representing trends assumed to be dominant or most distinctive for future developments. One dimension specifies whether leading trends are towards more or less globalization, with corresponding less or more regionalization. The second dimension specifies whether leading trends are towards a more market-oriented situation, in which economic efficiency is a main priority, or more towards a situation in which environmental and equity issues lead the priority list. This dimension can also be characterized by individualism versus collectivity. The four quadrants, A1-B1-A2-B2, then represent the different scenarios of each family, with its own specification of the main driving forces.
A1 B1 A2 B2 Globalization Regionalization Environmental concern, Equity, Collectivism Market, Efficiency, Individualism
5.1
The four worlds
5The four worlds cover a wide range of key ‘future’ characteristics such as demographic change, economic development and technological change. For this reason, their plausibility or feasibility should not be considered solely on the basis of an extrapolation of current economic, technological and social trends. The four worlds can be characterized as follows (IMAGE, 2001) into the worlds, A1, A2, B1 and B2.
A1 World
The A1 world experiences vary rapid economic growth, spurred on by globalization and rapid introduction of new and more efficient technologies. Major underlying themes are convergence among regions and increasing regional interactions.
Key elements: globalization, liberalization and privatization trends intensify; material prosperity is the key driver for people and governments; the role of governments is confined to upholding the 'rules of the game' and such accepted domains as defence and justice, and communication and trade nourish the development of 'global culture'.
A2 World
The A2 world is very heterogeneous. The underlying theme is self-reliance and preservation of local cultural identities. In economic terms, A2 is oriented to material-intensive lifestyles, but trade barriers slow down technological development and economic convergence.
Key elements: cultural identity and traditional values are dominant value-oriented; a strong role for governments, including market interference; inward, protectionist orientation and suspicion of globalization; pluralism in styles of governance, economic regimes, employment skills and organization, and resource management and the like.
B1 World
The B1 world emphasizes global solutions for economic, social and environmental sustainability, however, without climate initiatives. In economic terms, B1 will focus on a transition towards a services-oriented economy, with sharp reduction in material intensity and use of clean, resource-efficient technologies.
Key elements: material prosperity supplemented with concern on global and regional income equality; environmental integrity; governance effective on each scale level using the subsidiary principle; an emerging stronger role for the United Nations in
5 An extensive description and application of these four worlds can be found on the IMAGE CD-ROM (IMAGE, R.-.
(2001) The IMAGE 2.2 implementation of the SRES scenarios, Rijksinstituut voor Volksgezondheid en Milieu (RIVM), Bilthoven.
communication and trade nourishing the development of a 'global culture' but using global rules.
B2 World
The B2 world focuses on local solutions to economic, social and environmental sustainability. It is a world with continuously increasing global population at a rate lower than A2. Intermediate levels of economic development, and less rapid and more diverse technological change are shown than in the B1 and A1 storylines. While the scenario is also oriented to environmental protection and social equity, it focuses on local and regional levels.
Key elements: material prosperity supplemented with concern about regional income equality and environmental integrity; technology is a means, not an end, and should be directed by societal concerns; governance is effective at the national and regional level, not at the global level, while communication and trade emphasize local and regional culture and advantages.
5.2
Demography in SRES
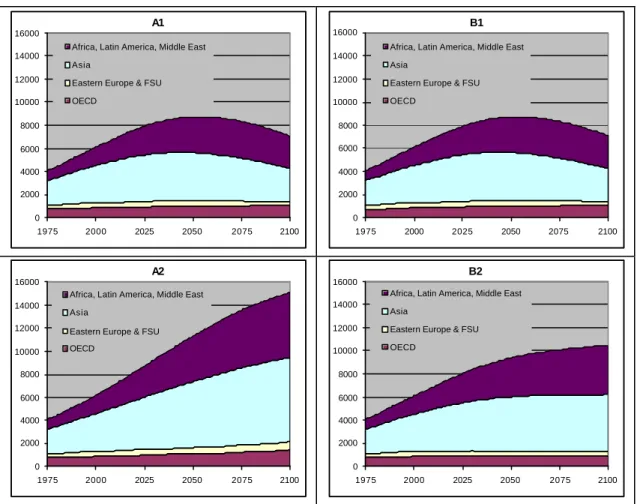
Demographic developments are only mentioned briefly in the description above, but analyzing the underlying data might reveal more. There were existing population projections taken to represent the four worlds. Actually, demographically speaking there are only three worlds, since A1 and B1 are equal. The population scenarios are presented and described below.
Population
The following population projections were selected by IPCC as representative of the four worlds (Sources: Lutz, 1996; UN, 1998):
A1/B1 adapted the LLC-IIASA scenario (Low fertility, Low mortality, Central migration). This means fertility levels of around 1.5 children per woman for the centrally planned Asian countries and China, and 2.0 for the rest of Asia and Africa, in 2030-2035. For the other regions fertility remains at levels below replacement (1.7-1.85). Gains in life expectancy will be around 2-4 years per decade until 2030-2035. Central migration implies that a net number of 1.7 million migrants can be expected, most flows originate in Latin America and Asia, go on to North America and Africa, then proceed to Western Europe. Western Europe also receives a substantial number of migrants from Eastern Europe and the former Soviet Union.
A2 HHC-IIASA scenario (High fertility, High mortality, Central migration). This scenario assumes a fertility increase for presently developed countries reaching levels between 2.1 and 2.3. In developing countries, fertility rates will reach 4.0 in North Africa &
Middle East, Sub-Saharan Africa and 3.0 in South Asia and Latin America. An increase in fertility can be expected in China and Pacific Asia (3.0 children per woman), and in Central Asia (4.0). The high mortality scenario assumes declines in life expectancy of two years per decade in Sub-Saharan Africa, mainly due to HIV/AIDS. In other regions, life expectancy will stay at present levels or just slightly increase.
B2 UN long-range 1998 medium projection. This scenario is selected because the UN has greater recognition internationally, and garners considerable attention. In this scenario, all regions are assumed to converge to replacement-level fertility in 2100. Life expectancy will increase from around 79 years in Africa to 86 years in North America in 2100. No migration assumptions are specified.
A1 0 2000 4000 6000 8000 10000 12000 14000 16000 1975 2000 2025 2050 2075 2100
Africa, Latin America, Middle East Asia
Eastern Europe & FSU OECD B1 0 2000 4000 6000 8000 10000 12000 14000 16000 1975 2000 2025 2050 2075 2100
Africa, Latin America, Middle East Asia
Eastern Europe & FSU OECD A2 0 2000 4000 6000 8000 10000 12000 14000 16000 1975 2000 2025 2050 2075 2100
Africa, Latin America, Middle East Asia
Eastern Europe & FSU OECD B2 0 2000 4000 6000 8000 10000 12000 14000 16000 1975 2000 2025 2050 2075 2100
Africa, Latin America, Middle East Asia
Eastern Europe & FSU OECD
Figure 11 . Four population projections of the scenarios (Source: IPCC, 1999).
Ageing
Ageing is recognized as an important aspect in SRES, especially in relation to household developments. With the ageing of a population, the household size might further decrease and result in a higher growth of households than the population growth might suggest. The level of energy use is related to the number of households, which is further enforced by the higher energy use per person in smaller households. However, household developments are
not included in the scenarios, since household formation rates are not well enough understood.
Urbanization
Urbanization is also mentioned as one of the important demographic factors. Especially in developing countries, urbanization has expanded enormously resulting in mega cities which have their own specific problems. Because of the differences in demographic dynamics -urban populations tend to have lower fertility rates but also lower mortality rates- changes in urban population differ from rural population changes. In combination with a foreseen rural-to-urban migration, the impacts on infrastructure, transportation use and energy consumption (urban populations use more energy) can be huge. However, these relationships are not well-founded. Under influence of the SRES scenarios, urbanization rates are not interlinked with population growth, but taken independently and consequently not used as deviating factor in the economic and energy subsystems.
5.3
Discussion of SRES
Regrettably, an adequate justification for selecting population projections in SRES is missing. It seems to be that the population scenarios are selected on the basis of the total population size, instead of taking the components of demographic developments as a starting point for the scenarios. Consistency of the associated assumptions with the storylines can therefore not be verified and appearances belie this - at least in some cases. For example, B2 stands for a scenario in which all regions keep their regional identity; however, total fertility is expected to converge to replacement level in all regions. On the other hand, although A1/B1 represents globalization, there is still a socio-demographic gap between sub-Saharan Africa and the rest of the regions. Even the horizontal axis, which includes the equity facet, does not influence this gap since the A1 and B1 scenarios are assumed to be completely equal.
The reasoning for assuming A1 equal to B1 can thus be questioned. This assumption implies that in a globalizing world, the demographic behaviour of people does not differ if emphasis is more on sustainability and equity than on material wealth. Although resulting population projections could be equal, in mortality patterns caused by different medical technology or income assumptions, for example, and given different sets of assumptions, are more likely to result in diverging demographic futures. In addition, even in the case of mutual compensating effects (lifestyle and/or education could have a similar positive effect on average life expectancy in B1 and income growth in A1) underlying age-specific mortality will show differences given the more equal distribution in B1. Obviously, this has its effect on the age structure and population size.
The scenarios are not distinctive on migration. The effect of migration on the total size of the global population might be limited in scenarios in which all regions develop the same
mortality and fertility patterns. But even in these scenarios, the distribution of the global population growth over the regions is partly determined by migration patterns. Moreover, the globalization-regionalization dimension is an outstanding characteristic that should be represented by different migration scenarios. In addition, unequal distribution of wealth (i.e. the horizontal axis) might form an irrepressible pressure on people’s migration intentions.
In the scenarios, only the total population size is taken into account. The other population characteristics mentioned (households, consequences of ageing, and urbanization) are not considered to be distinctive in the SRES scenario dimensions. One of the arguments used is that these processes are not understood well enough. Giving the importance of these issues - ageing considered as one of most challenging demographic issues - they may warrant special attention in the scenarios. A similar lack of attention has resulted in inconsistent assumptions about urbanization; it is not that plausible that urbanization rates in the A2 world with 15 billion people are equal to the 7 billion of the A1 and B1 worlds.
6.
Towards consistent population scenarios
Following the stepwise procedure, as described in Section 4.3, the next step taken should result in a more consistent set of population scenarios. The application of this procedure to the population is therefore described in this section, followed by a reconsideration of points of departure for the SRES scenarios.
6.1
Stepwise procedure towards population scenarios
The first step is framing the process and the issues for description. The broad definition of demography, in which population is not only considered in absolute numbers, but also characterized by its structure and composition, is taken as a stepping stone. The three basic demographic processes of fertility, mortality and migration are explicitly described and interconnected. The level of detail that will be used to describe each of the components is fairly subjective. For example, the description of migration can vary from relatively simple net migration numbers, with no distinction as to origin and destination, or to migration motives and ethnic backgrounds. The choice for these levels will be based on the relevance and feasibility of the component, starting from the demographic transition theory as a framework for coherence.
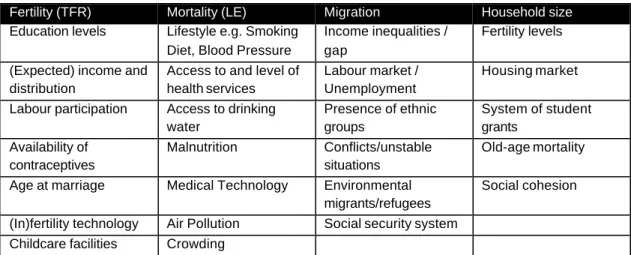
The second step is the distinction of the main determinants of these processes. The geographical scale is important in the selection of determinants. Socio-economic and environmental conditions are important for both developing and developed countries although a gradation - for example, in basic and higher levels - should be distinguished (such as literacy and higher levels of education, malnutrition and diets). Aspects of access to or distribution of natural, economic and social resources play an important role in demographic dynamics. The main determinants are listed for each of the components and will be used to describe the various scenarios. Table 2 presents these determinants. They require further explanation since the effect of the determinant is not always unambiguous. For example, at the beginning of the fertility transition the fertility levels drop with increased educational levels, but at the end of the fertility transition in a situation with a low average TFR, high education levels might show a relatively higher TFR. The complex relationship between socio-economic conditions and fertility outcomes is recognized and well described in many studies (e.g. Easterlin, 1983, Becker, 1991, Becker, 1993, McDonald, 2002). Most of the changes in the underlying determinants will be given in the detailed description of the scenarios. A brief overview is given in Table 2. The order of the determinants does not reflect a direct ranking of importance. First of all, some determinants (e.g. education) have both a direct and indirect effect and, secondly, the magnitude of the effect depends on the stage of the demographic transition (e.g. lifestyle).