Scientific Assessment and Policy Analysis
WAB 500102 010
Assessment of the relation between climate
and nitrogen related policy for the Dutch
CLIMATE CHANGE
SCIENTIFIC ASSESSMENT AND POLICY ANALYSIS
Assessment of the relation between
climate and nitrogen related policy for the
Dutch situation
Report
500102 010Authors
A. Bleeker J.W. Erisman H. van Grinsven H. Kros M. van Schijndel W. de Vries K. Zwart January 2009This study has been performed within the framework of the Netherlands Research Programme on Scientific Assessment and Policy Analysis for Climate Change (WAB) project ‘Assessing the relation
between climate policies and nitrogen-related policies and the effect of (new) reactive nitrogen abatement on greenhouse gas emissions and sinks in the Netherlands and Europe’.
Wetenschappelijke Assessment en Beleidsanalyse (WAB) Klimaatverandering
Het programma Wetenschappelijke Assessment en Beleidsanalyse Klimaatverandering in opdracht van het ministerie van VROM heeft tot doel:
• Het bijeenbrengen en evalueren van relevante wetenschappelijke informatie ten behoeve van beleidsontwikkeling en besluitvorming op het terrein van klimaatverandering;
• Het analyseren van voornemens en besluiten in het kader van de internationale klimaatonderhandelingen op hun consequenties.
De analyses en assessments beogen een gebalanceerde beoordeling te geven van de stand van de kennis ten behoeve van de onderbouwing van beleidsmatige keuzes. De activiteiten hebben een looptijd van enkele maanden tot maximaal ca. een jaar, afhankelijk van de complexiteit en de urgentie van de beleidsvraag. Per onderwerp wordt een assessment team samengesteld bestaande uit de beste Nederlandse en zonodig buitenlandse experts. Het gaat om incidenteel en additioneel gefinancierde werkzaamheden, te onderscheiden van de reguliere, structureel gefinancierde activiteiten van de deelnemers van het consortium op het gebied van klimaatonderzoek. Er dient steeds te worden uitgegaan van de actuele stand der wetenschap. Doelgroep zijn met name de NMP-departementen, met VROM in een coördinerende rol, maar tevens maatschappelijke groeperingen die een belangrijke rol spelen bij de besluitvorming over en uitvoering van het klimaatbeleid.
De verantwoordelijkheid voor de uitvoering berust bij een consortium bestaande uit PBL, KNMI, CCB Wageningen-UR, ECN, Vrije Universiteit/CCVUA, UM/ICIS en UU/Copernicus Instituut. Het PBL is hoofdaannemer en fungeert als voorzitter van de Stuurgroep.
Scientific Assessment and Policy Analysis (WAB) for Climate Change
The Netherlands Programme on Scientific Assessment and Policy Analysis Climate Change has the following objectives:
• Collection and evaluation of relevant scientific information for policy development and decision–making in the field of climate change;
• Analysis of resolutions and decisions in the framework of international climate negotiations and their implications.
We are concerned here with analyses and assessments intended for a balanced evaluation of the state of the art for underpinning policy choices. These analyses and assessment activities are carried out in periods of several months to a maximum of one year, depending on the complexity and the urgency of the policy issue. Assessment teams organized to handle the various topics consist of the best Dutch experts in their fields. Teams work on incidental and additionally financed activities, as opposed to the regular, structurally financed activities of the climate research consortium. The work should reflect the current state of science on the relevant topic. The main commissioning bodies are the National Environmental Policy Plan departments, with the Ministry of Housing, Spatial Planning and the Environment assuming a coordinating role. Work is also commissioned by organisations in society playing an important role in the decision-making process concerned with and the implementation of the climate policy. A consortium consisting of the Netherlands Environmental Assessment Agency, the Royal Dutch Meteorological Institute, the Climate Change and Biosphere Research Centre (CCB) of the Wageningen University and Research Centre (WUR), the Netherlands Energy Research Foundation (ECN), the Netherlands Research Programme on Climate Change Centre of the Vrije Universiteit in Amsterdam (CCVUA), the International Centre for Integrative Studies of the University of Maastricht (UM/ICIS) and the Copernicus Institute of the Utrecht University (UU) is responsible for the implementation. The Netherlands Environmental Assessment Agency as main contracting body is chairing the steering committee.
For further information:
Netherlands Environmental Assessment Agency, WAB secretariat (ipc 90), P.O. Box 303, 3720 AH Bilthoven, tel. +31 30 274 3728 or email: wab-info@pbl.nl.
Preface
This report was commissioned by the Netherlands Programme on Scientific Assessment and Policy Analysis Climate Change (WAB).
This report was produced by:
Albert Bleeker, Jan Willem Erisman
Energy research Centre of the Netherlands (ECN) Hans van Grinsven, Marian van Schijndel
Netherlands Environmental Assessment Agency (PBL) Wim de Vries, Hans Kros, Kor Zwart
Wageningen University and Research Centre (WUR)
Name, address of corresponding author:
Albert Bleeker
Energy research Centre of the Netherlands (ECN) P.O. Box 1
1755ZG Petten, The Netherlands http://www.ecn.nl
E-mail: a.bleeker@ecn.nl
Disclaimer
Statements of views, facts and opinions as described in this report are the responsibility of the author(s).
Copyright © 2009, Netherlands Environmental Assessment Agency
All rights reserved. No part of this publication may be reproduced, stored in a retrieval system or transmitted in any form or by any means, electronic, mechanical, photocopying, recording or otherwise without the prior written permission of the copyright holder.
Abstract
In the framework of the Netherlands Programme on Scientific Assessment and Policy Analysis Climate Change (WAB-CC) the major drivers and interactions for flows of nitrogen and greenhouse gasses in the Netherlands were assessed. This was done to determine opportunities for synergism of climate and nitrogen policies, but also to identify possible risks for antagonisms. Because of the nature of this assessment, its conclusions may help in defining and prioritising future research and possible policy developments on the different topics.
In view of the complexity of the interactions between greenhouse gas (GHG) emissions and reactive nitrogen a division was made into five more comprehensive smaller subsystems. The subsystems were chosen in such a way that they are also relevant for (future) policies. These five subsystems and their research topics are:
1. Emission of NH3, N2O, CO2 and fine particles in energy production
• here the trends in and interactions between different GHG and nitrogen emissions are assessed, as well as the possibilities for specific measures and the effect of changing particle emissions on global warming.
2. Impact of N-fertilization on GHG emissions in agricultural systems
• here the effects of climate change (temperature and precipitation) on the agricultural emission of GHG and N are assessed, as well as the effects of N measures on GHG emissions
3. Impact of biofuel use, and associated land use change, on GHG emissions in the energy sector and agriculture
• here the impact of biofuel use (and its production) on the GHG emissions is assessed in the whole chain from fertilizer production to the conversion of bio fuels
4. Impact of N deposition and climate policies on greenhouse gas emissions in terrestrial ecosystems
• here the effect (both qualitative and quantitative) of changing nitrogen depositions on GHG emissions in different terrestrial ecosystems (forested and non-forested) in Europe is assessed
5. Impact of N-inputs on GHG emissions in aquatic ecosystems
• here the effect of changing nitrogen inputs (mainly via water) on the GHG emissions in aquatic ecosystems is assessed, as well as the effect of climate change on aquatic systems.
The main conclusions for each subsystem are:
1. Emission of NH3, N2O, CO2 and fine particles in energy production
• looking at the energy sector as a whole, the way in which energy is produced now and in the future is largely determined by fuel prices and availability of fossil fuels, but also by consumer behaviour (which can be influenced by changes in climate);
• synergies and antagonisms between GHG and N emission reductions are possible in the energy productions sector, for instance by means of the use of sustainable energy sources and, more in general, by chosing different fuel types. The net effect is not always clear and should be investigated in more detail;
• measures targeting at the reduction of GHG emissions can result in reduced emissions of aerosols. This is contra productive since fine particles can partly compensate global warming, due to their cooling effect. However, the regional impact of emission reductions on this effect is still poorly understood.
2. Impact of N-fertilization on GHG emissions in agricultural systems
• Nitrogen use in the animal production sector (feed, production and storage of manure) and arable sector (use of fertilizer and animal manure) leads to substantial GHG emissions. Possibilities for lowering these emissions are: reduced nitrogen use and adjusted nitrogen management.;
• NEC ammonia measures enhance N2O emissions through mandatory manure
incorporation (antagonism). At present there is no adequate method available to determine the net environmental effect with respect to low emission manure spreading (like e.g. manure incorporation);
• the nitrate directive has lead to 30% reduction of total N inputs, with direct co-benefits for climate via a reduction of N2O emissions (synergy);
• (co-) digestion of manure can be a worthwhile measure to reduce methane and nitrous oxide emissions from manure storage, and to increase the fertilizing value of manure as compared to untreated manure.
3. Impact of biofuel use, and associated land use change, on GHG emissions in the energy sector and agriculture
• Use of biofuels in decentralised units without emission reducing measures leads to higher NOx emissions;
• (co-) digestion is a widely promoted option to produce biogas and/or heat and power. However, there is a competition between animal feed and energy/biofuels. Although addition of plant material results in a higher energy output, it also results in higher GHG emissions;
• increased biomass production yield higher N emissions in the existing cascade, as a result of the needed additional fertilizer;
• 2nd generation biofuels is favourable in relation to energy/GHG balances. However, the (indirect) competition with food production for humans and animals still needs attention. 4. Impact of N deposition and climate policies on greenhouse gas emissions in terrestrial
ecosystems
• nitrogen deposition has overall a positive effect on the global warming potential (GWP) in terrestrial ecosystems because of the additional carbon uptake;
• assessing the efficiency of existing of future measures related to reduced N use requires a full quantification of its effects on the exchange of CO2, N2O and CH4 by
complete life cycle analyses;
• the overall impact of 1 kg N used in agriculture on the global warming potential may be negligible when the N is applied in the form of animal manure. When it is applied in the form of N fertilizer, it is likely to have an negative impact due to CO2 and N2O emissions
during the production of fertilizer.
5. Impact of N-inputs on GHG emissions in aquatic ecosystems
• both fresh waters and coastal zones are a net source of GHG, especially because of N2O emission originating from leaching and run-off from agriculture;
• the overall net effect of aquatic processes on the GWP is uncertain, since no quantitative information is available on the net carbon sequestration of the aquatic system.
Contents
Nederlandse samenvatting 11
Summary 14
1 Introduction 25
2 Emission of NH3, N2O, CO2 and fine particles in energy production 29
2.1 Introduction 29
2.2 Overview of Energy Production 30
2.3 Quantification of nitrogen and GHG emissions due to energy production 32
2.3.1 The energy production sector 32
2.3.2 Emissions from the energy sector 35
2.3.3 Interaction between nitrogen and GHG emission reduction options 40
2.3.4 Aerosols and their cooling effect 42
2.4 Effect of possible future policies/measures 42
2.5 Conclusions 45
3 Impact of N-fertilization on GHG emissions in agricultural systems 47
3.1 Introduction 47
3.2 Nitrogen and climate policies for Dutch agriculture 48
3.3 Linkage of N and C-cycles. 50
3.4 Qualitative assessment of linkages between agricultural nitrogen policies,
greenhouse gas emission and climate change 54
3.4.1 Climate effect on N-cycle 55
3.4.2 N-fertiliser use and CO2 effect 57
3.4.3 Greenhouse gas emission related to manure (co-) digestion 60 3.4.4 Relation between N2O-emission and soil and crop management 63
3.5 Conclusions 65
4 Impact of biofuel use and land use change on GHG emissions in the energy sector
and agriculture 67
4.1 Introduction 67
4.2 Specific overview of linkages 68
4.2.1 Fertilizer production, application and biomass yield 70
4.2.2 Fuel production and use 74
4.2.3 Overall assessment of interlinkages 76
4.3 Conclusions 78
5 Impact of nitrogen deposition on greenhouse gas emissions in terrestrial ecosystems 81
5.1 Overview of linkages 81
5.2 Quantification of nitrogen deposition impacts on net green house gas exchange 85
5.2.1 Quantification for European forest ecosystems 85
5.2.2 Quantification for non forested ecosystems and uncertainty in the N
deposition impacts 90
5.3 Discussion and conclusion 97
5.3.1 Discussion 97
5.3.2 Conclusions 101
6 Impact of N-inputs on GHG emissions in aquatic ecosystems 103
6.1 Introduction 103
6.2 Specific overview of linkages 106
6.3 Quantification of effects on GHG emissions 109
6.3.1 Interaction N and climate change 111
6.3.2 Effect of climate change on N and GHG emissions from aquatic systems 111
6.4 Effect of existing and possible future policies/measures 112
7 Conclusions of the assessment 113
References 117
List of abbreviations 125
List of Tables
II Overview of the impact of nitrogen deposition on the net GHG emission by European
forests. 20
III Quantification of effect of changing N load on N2O, CH4 and CO2 emissions from
aquatic systems. 21
IV Quantification of climate change on GHG emission from aquatic systems. 22 2.1 Effect of climate (in Tg) on the energy demand for the different scenarios. 35
2.2 Overview of PM10 emissions for biomass use processes 39
2.3 Overview of options with the largest emission reduction potential for GHG. 41 2.4 Total emission reduction for the options from Table 2.3 per sector. 41 2.5 Overview of additional emission reductions for compounds/themes at maximum
reduction for other compounds/themes. 42
2.6 Identified option categories from Daniels & Farla (2006b). 43
2.7 Emission reduction for the Netherlands for different compounds/themes for specific
measures available for the energy sector. 44
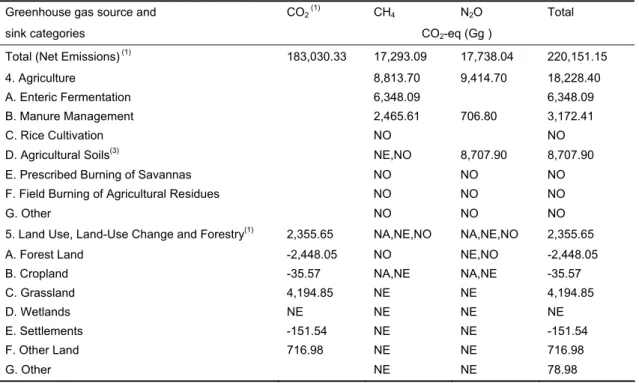
3.1 Summary report for CO2 equivalent emissions for the Netherlands IPCCC inventory
2004. 53
3.2 N-measures and relative N2O effect as compared to situation with no measures. 55
3.3 Climate change in 2100 (ranges in between brackets) for the middle climate scenario
Netherlands 2100. 56
3.4 The modelled effect of global temperature increase on the net CO2 exchange of
forest ecosystems 57
3.5 The gross GHG-emission balance for a arable field with 15 ton dry matter yield and
500 kg input of N-fertilizer (in CO2-eq/kg N). 58
3.6 Effect of manure (co-) digestion on greenhouse gases. 62
3.7 Environmental factors controlling indirect N2O production during denitrification. 63
4.1 Energy Balance for Modern Ammonia Plant. 71
4.2 Overview of emissions of fertilizer production in the literature. 71 5.1 The influence of environmental factors on nitrification, denitrification and N2O
fractions (fN2O), based on literature (see text). When an environmental factor is
increased, this may have a positive (+) or negative (-) influence on nitrification,
denitrification and N2O production by both processes. 84
5.2 Estimated N2O emission factors for deciduous and coniferous forests . 88
5.3 Estimated ranges in long term annual average CO2, N2O and CH4 emissions and the
impact of N deposition on those emissions, including a comparison of their global
warming potential (GWP) in CO2 equivalents. 89
5.4 Estimated ranges in carbon sequestration per kg nitrogen addition in above and
below ground biomass in forest at various scales. 91
5.5 Estimated ranges in carbon sequestration per kg nitrogen addition in above and
below ground biomass in moorlands and heathlands at sites in the UK. 93 5.6 Estimated soil carbon sequestration per kg nitrogen addition and soil C/N ratios at
the Ruabon heathland N manipulation site 94
5.7 Estimated NH3 emission fractions for animal manure, fertilizer and organic products
and a country averaged fraction for the Netherlands 99
5.8 Estimated NH3 emission fractions for animal manure, fertilizer and organic products
and a country averaged fraction for the Netherlands assuming low emission housing 99 5.9 Estimated NH3 emission fractions for animal manure, fertilizer and organic products
and a country averaged fraction for the Netherlands assuming low emission housing 101
6.1 NBW-standards for protection against light 105
6.2 Effect of residence time on the release of N2O, CH4 and CO2 from various aquatic
6.3 Effect of N on the release of N2O, CH4 and CO2 from various aquatic systems. 109
6.4 Effect of C on the release of N2O, CH4 and CO2 from various aquatic systems. 109
6.5 Effects climate change on the emission of N2O, CH4 and CO2 in various aquatic
systems. 111
6.6 Quantification of reduction in N load on N2O, CH4 and CO2 from various aquatic
systems. 112
List of Figures
I Overview of the main interlinkages between nitrogen and greenhouse gases
assessed here (explanation of the numbers is given in the text below). 14
II Nitrogen cascade through the agricultural system. 17
1.1 Qualitative linkages between the implementation of nitrogen and climate policies in industry/ traffic and in agriculture and greenhouse gas emissions in terrestrial and
aquatic ecosystems. 26
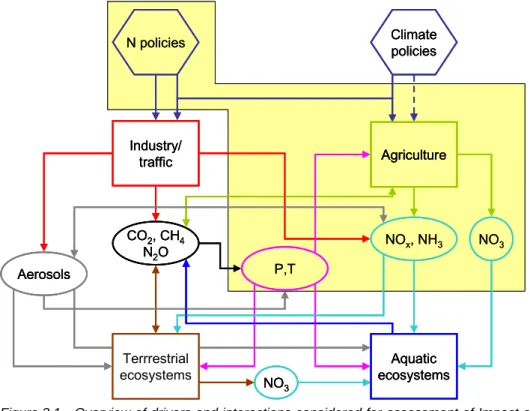
2.1 Overview of drivers and interactions considered for assessment of the relation between NH3, CO2, N2O and particulate matter emissions from energy production
and N and Climate policy. 29
2.2 Outline of relations in the energy production process. 30
2.3 Development of the trend in degree days, uncertainty ranges and projections using
climate models. 31
2.4 Total heat, electricity and non-energetic energy demand (in PJ) for the industrial
sector (excluding refineries). 33
2.5 Total electricity demand (in PJ) for the consumer sector. 34
2.6 Annual change (in %) in electricity demand in the period 1940-2020 according to the
two scenarios. 35
2.7 Electricity production (in TWh) per production type for the period 2000-2020. 36
2.8 Distribution of sustainable energy supply in 2003. 36
2.9 Development of the amount of sustainable energy until 2020 (expressed as Tg
avoided CO2 emission). 37
2.10Emission of CO2 (in Tg) for the electricity production sector in the period 1990-2020
according to the SE and GE scenarios. 37
2.11Development of the total emission of non-CO2 GHG (in Tg) in the Netherlands. 38
2.12Development of NOx emissions (in Gg) in the Netherlands. 38
2.13Development of PM10 emissions (in Gg) in the Netherlands. 38
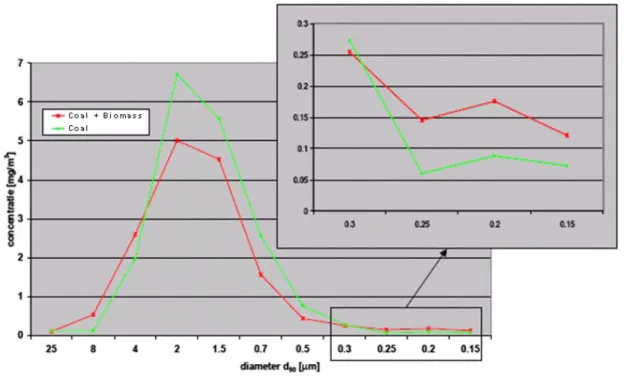
2.14Shift in PM particle size for coal and coal+biomass burning. 40
2.15GHG emission reductions per category of the option bundles listed in Table 2.6 ,
compared to the 2020 GE emission . 44
3.1 Overview of drivers and interactions considered for assessment of Impact of
N-fertilization on GHG emissions in agricultural systems. 47
3.2 Overview of EU and national policies and targets for nitrogen. 49
3.3 The approximate nitrogen balance (Gg) for Agricultural soils in the Netherlands
1995-2000 51
3.4 Linkage between N-loss from agro-ecosystems and N-loading of natural
ecosystems. 51
3.5 Main loss routes for nitrous oxide related to manure and fertilizer use in the
agricultural sector following the IPCC-protocol. 52
3.6 Relative contributions of emissions of CO2, N2O and CH4 from various agricultural
activities and processes to the total greenhouse gas emission of the Netherlands in 2003, including the CO2 emission from heating in horticulture (total contribution
14%). 53
3.7 Trends and shares of greenhouse gas emissions by the Dutch agricultural (in green)
sector. 54
3.8 Future average winter temperature the Netherlands 56
3.9 Enhanced temperature sensitivity at low temperatures 57
3.10Development of prices of single nitrogen fertilizer (CAN). 59
3.11Example relationship between wheat yield and nitrate loss at various N-application
3.12Conceptual and hypothetical relation ships between carbon yield, nitrogen input and
time. 60
3.13Effect of C/N ratio in pig slurry on the rates on denitrification and nitrous oxide
emission 64
3.14Effect of soil type and N-source on the emission of nitrous oxide 64 4.1 Overview of drivers and interactions considered for assessment of impact of biofuel
use and land use change on GHG emissions in the energy sector and agriculture. 68
4.2 Scheme showing the biomass technological and product routes. 69
4.3 Scheme showing the interaction between inputs and outputs. 70
4.4 Leaf exchange rates at light saturation as a function of leaf N content per unit area 72 4.5 Yield and nitrogen content in the crop as function of fertilizer input, calculated with
the Nitrogen Crop Response Model for Dutch conditions 72
4.6 Compilation of N losses as function of N-input from the literature 73
4.7 Direct N2O from annual crops, Germany 73
4.8 Soil carbon storage calculated for low and high initial carbon stock 74
4.9 Summary of LCA GHG emissions for selected power plants 75
4.10LCA nitrogen emissions from biomass options to produce heat and power 75 4.11LCA GHG emissions from biomass options for transport fuels differentiated between
WTT and WTW 76
4.12Overall estimates of GHG emissions for different options 77
4.13Contribution of different GHG emissions in the production and use of rapeseed oil as
diesel in the transport sector. 78
4.14Comparison of break-even points for two estimates of N2O emissions. 78
5.1 Overview of drivers and interactions considered for assessment of the impact of
nitrogen deposition on GHG emissions in terrestrial ecosystems. 82
5.2 Diagram showing the potential effects of increases in atmospheric N deposition on
CO2 sequestration, N2O emissions (direct and indirect) and CH4 uptake. 83
5.3 N2O-N emission as a function of N-input for deciduous forests (left) and coniferous
forests (right), based on the literature 88
5.4 Net greenhouse gas budget (in CO2 equivalents) per unit N added for European
forests and for a lowland heath land in southern England (Thursley Common) 97 6.1 Overview of drivers and interactions considered for assessment of the impact of
nitrogen inputs on GHG emissions in aquatic ecosystems. 103
6.2 Hierarchy of aquatic systems and their relation between N (and C load) and GHG
emissions. 104
6.3 Overview linkage C and N in terrestrial and aquatic systems. 106
6.4 Interactions between carbon cycling in terrestrial and aquatic system. 108
Nederlandse samenvatting
In het kader van het Nederlandse Programma Wetenschappelijke Assessment en Beleidsanalyse (WAB) Klimaatverandering zijn de belangrijkste interacties tussen de cycli van stikstof en broeikasgas onderzocht. Waar mogelijk en zinvol zijn resultaten gericht op de Nederlandse situatie. Het doel van het het onderzoek is om de mogelijkheden voor de synergie tussen klimaat- en stikstofbeleid te bepalen, maar ook om de mogelijke kansen op negatieve terugkoppelingen te identificeren. De complexiteit en de onzekerheid van de interacties blijken zeer groot. De conclusies van dit onderzoek bieden handvatten voor het definiëren en prioriteren van toekomstig onderzoek en mogelijk ook van beleidsontwikkelingen.
Vanwege de complexiteit van de interacties tussen emissies van broeikasgassen (BKG) en reactief stikstof, is een onderverdeling gemaakt in vijf deelsystemen. De deelsystemen zijn mede gekozen voor aansluiting op het (toekomstige) beleid. De onderzoeksonderwerpen per deelsysteem zijn:
1. Emissies van NH3, N2O, CO2 en fijn stof bij de energieproductie
• Hier zijn de trends en interacties tussen BKG en stikstofemissies onderzocht, maar ook de mogelijkheden voor specifieke maatregelen en het effect van veranderende emissies en concentraties van aërosolen op het broeikaseffect.
2. Invloed van stikstofbemesting op BKG emissies in landbouwsystemen
• In dit systeem zijn de effecten van klimaatverandering (temperatuur en neerslag) op de emissie van BKG en stikstof vanuit de landbouw onderzocht, maar ook het effect van stikstofmaatregelen op de BKG emissies.
3. Invloed van het gebruik van biobrandstoffen en de bijbehorende verandering in landgebruik op de BKG emissies in de energie- en landbouwsector
• De invloed van het gebruik (en de productie) van biobrandstoffen op de BKG emissie zijn onderzocht in de hele keten van kunstmestproductie tot de conversie van biobrandstoffen.
4. Invloed van stikstofdepositie en klimaatbeleid op BKG emissies voor terrestrische ecosystemen
• Hier is het effect van veranderende stikstofdeposities op de BKG emissies in verschillende terrestrische ecosystemen (bos en overig) in Europa onderzocht.
5. Invloed van stikstofaanvoer op de BKG emissies voor aquatische ecosystemen
• Het effect van veranderende stikstof aanvoer (voornamelijk via water) op de BKG emissies in aquatische ecosystemen is onderzocht, naast het effect van klimaatverandering op de kwaliteit van aquatische systemen.
De belangrijkste conclusies per deelsysteem zijn:
1. Emissies van NH3, N2O, CO2 en fijn stof bij de energieproductie
• voor de energiesector in zijn geheel hangt de manier waarop energie nu en in de toekomst wordt geproduceerd voornamelijk af van de brandstofprijzen (politiek) en de (fysieke) beschikbaarheid van fossiele brandstoffen. Ook veranderend consumentgedrag (welke mogelijk beïnvloed kan worden door veranderingen in het klimaat) is van belang;
• in de energieproductiesector is er synergie en antagonisme mogelijk tussen emissiereducties van BKG en stikstof; bijvoorbeeld door de inzet van duurzame energie of, meer algemeen, door keuze voor andere brandstoffen. Het netto effect is niet altijd duidelijk en zou in meer detail onderzocht moeten worden;
• maatregelen ter reductie van emissies van BKG kunnen leiden tot minder emissie van aërosolen. Dit is contraproductief omdat aërosolen het broeikaseffect compenseren door kun koelend effect. Echter, op regionale schaal is dit effect nog niet kwantificeerbaar.
2. Invloed van stikstofbemesting op BKG emissies in landbouwsystemen
• Stikstofgebruik in veeteelt (ruwvoer en krachtvoer, productie en opslag van mest) en de akkerbouw (gebruik van kunstmest en dierlijke mest) leidt tot aanzienlijke BKG
emissies. Er zijn veel mogelijkheden om deze emissies te verminderen door minder stikstofgebruik en aanpassing stikstofmanagement;
• Het verplicht onderwerken van mest als maatregel om de ammoniakdoelstelling van de NEC richtlijn te halen leidt tot een verhoging van de N2O emissies (antagonisme; ook
voor nitraat). Er is nog geen goede methode om de netto milieuwinst van emissiearme aanwending te bepalen;
• De Nitraatrichtlijn heeft daarentegen geleid tot een reductie van de totale stikstof aanvoer van 30%, met bijkomende voordelen voor het klimaat door reductie van N2O
emissies (synergie);
• (co-) vergisting van mest kan een effectieve maatregel zijn voor het reduceren van emissies van methaan en lachgas vanuit mestopslagen. Tevens levert vergisting een residu met een betere bemestende waarde dan onbewerkte dierlijke mest.
3. Invloed van het gebruik van biobrandstoffen en de bijbehorende landgebruiksverandering, op de BKG emissies in de energie- en landbouwsector
• de toepassing van biobrandstoffen in kleinere regionale eenheden zonder emissiereducerende maatregelen zal leiden tot hogere NOx emissies;
• (co-) vergisting is een breed gepromote optie voor het produceren van biogas en/of warmtekrachtkoppeling. Er is een trade-off tussen het gebruik van plantenresten voor (co-) vergisting en als diervoer. Verder heeft toevoeging van plantaardig materiaal weliswaar een hoger energierendement tot gevolg, maar tevens een hogere BKG emissie;
• een verhoogde biomassa productie zal leiden tot hogere stikstof emissies in de bestaande cascade als gevolg van de extra benodigde (kunst)mest;
• tweede generatie biobrandstoffen verdienen de voorkeur gelet op energie- en BKG balansen. Echter, gelet moet worden op de (indirecte) competitie met voedsel productie voor mens en dier.
4. Invloed van stikstofdepositie en klimaatbeleid op BKG emissies voor terrestrische ecosystemen
• over het algemeen heeft stikstofdepositie een netto positief effect op de ‘global warming potential’ (GWP) in terrestrische systemen vooral door de extra CO2 opname;
• om de effectiviteit van bestaande en toekomstige maatregelen gerelateerd aan reductie van stikstofgebruik te bepalen, is een complete kwantificering van de effecten op de uitwisseling van CO2, N2O en CH4 nodig door middel van een ‘ketenanalyse’ (LCA);
• Een analyse van de hele keten laat zien dat het effect van bemesting van 1 kg stikstof in de vorm van dierlijke mest waarschijnlijk verwaarloosbaar is op de GWP. Wanneer direct toegediend als kunstmest, heeft het waarschijnlijk een negatieve invloed ten gevolge van CO2 en N2O emissies tijdens de productie van het kunstmest.
5. Invloed van stikstofaanvoer op de BKG emissies voor aquatische ecosystemen
• zowel zoete oppervlaktewateren als kustzones zijn een bron van BKG, vooral vanwege de N2O emissies, die vooral afkomstig zijn uit- en afspoeling uit de landbouw;
• het totale netto effect van aquatische processen op de GWP is onzeker. Dit komt doordat er geen kwantitatieve informatie beschikbaar is over de netto koolstofvastlegging in aquatische systemen.
Naast de bovenstaande specifieke conclusies worden ook enkele algemene inzichten gegeven. Deze richten zich met name op de belangrijkste relaties (zowel positief als negatief) tussen stikstof- en klimaatbeleid, die op dit moment nog niet verankerd zijn in dat beleid. De observaties zijn gebaseerd op de inzichten verkregen uit de onderliggende studies en vormen toekomstige belangrijke aandachtsgebieden.
Observatie 1 Grootschalige teelt biobrandstoffen
Het gebruik van biobrandstoffen en bioenergie vraag om meer kennis voordat het op grote schaal kan worden toegepast, vanwege (i) de onzekerheid met betrekking tot het netto CO2
effect, (ii) de negatieve neveneffecten voor de stikstofkringloop en (iii) de competitie met de vraag naar land voor natuur en/of voedselproductie. Dit is vooral het geval voor de zogenaamde eerste generatie brandstoffen. Negatieve neveneffecten op de stikstofkringloop zijn de additionele emissies van N2O en NH3 en een toename van de stikstof uitspoeling naar
aquatische systemen door een toename van kunstmestgebruik. Ook is er sprake van additionele NOx emissies tijdens de productie en de conversie van biobrandstoffen zoals bij
decentrale warmte-kracht toepassing. Er is een duidelijke behoefte aan integrale assessments die alle effecten in de hele keten gerelateerd aan het gebruik van biobrandstoffen onderzoeken.
Observatie 2 Bevordering koolstofopslag in natuur door stikstofbemesting
Het stimuleren van koolstofopslag in organisch materiaal van (semi) natuurlijke ecosystemen door een verhoogde aanvoer van stikstof is een potentieel relevante, maar tijdelijke, optie om BKG emissies te compenseren. Het gebruik van een dergelijke optie als onderdeel van klimaatbeleid conflicteert met stikstofbeleid, omdat een toename (of lagere ambities voor reductie) van de productie van reactief stikstof door de productie van kunstmest en het verbranden van fossiele brandstoffen zal leiden tot extra effecten, zoals vermesting, verzuring, luchtverontreiniging, etc. Een complete kwantificering van de effecten van stikstofgebruik op de uitwisseling van CO2, N2O en CH4 door middel van een ‘ketenanalyse’ (LCA) geeft meer inzicht
in de meest optimale toepassing van stikstof in de landbouw met het oog op het netto BKG effect.
Beleid gericht op het bevorderen van koolstofvastlegging in bossen, (bijvoorbeeld) door het langer toestaan van de huidige hoge N depositieniveaus, impliceert dat een groter gewicht wordt toegekend aan schade voor de samenleving door klimaatverandering dan door eutrofiëring. De wetenschap kan echter op dit moment nog geen geschikte methodieken leveren voor het ondersteunen van een dergelijke beslissing. Maatschappelijke schade door klimaatverandering en eutrofiering vloeien beiden voort uit biodiversiteitverandering, maar een correcte afweging vereist dat deze schade (en andere schadelijke effecten) worden uitgedrukt in vergelijkbare eenheden.
Observatie 3 Noodzaak en ruimte voor het reduceren van stikstof kunstmest
Gegeven de negatieve effecten van overbemesting, zowel in termen van eutrofiëring, verzuring, grootschalige luchtverontreiniging, waterverontreiniging als van klimaatverandering (broeikasgasemissies), is het zeer relevant om de productie en het gebruik van kunstmest te optimaliseren. De emissie van N2O tijdens de productie van kunstmest kan worden verminderd
door de implementatie van bestaande procestechnologieën. Er zijn ook verschillende opties om de efficiëntie bij het gebruik van kunstmest te verhogen. De huidige opvatting in de landbouw is dat, wanneer goedkope kunstmest beschikbaar is, het gebruik van grote hoeveelheden stikstof een goede optie is om het risico van lagere winst bij verminderde gewasopbrengsten te verlagen. Wanneer echter ook de maatschappelijke schade door klimaatverandering en stikstofgerelateerde effecten beschouwd worden zal het economische optimale bemestingsniveau lager zijn. Met name in geïndustrialiseerde landen zijn maatregelen gericht op een vergroting van de kunstmestefficiëntie effectief bij de mitigatie van klimaatverandering, en andere stikstofgerelateerde effecten, zonder bijkomende risico’s voor de voedselproductie.
Observatie 4 Integraal stikstofbeleid vereist meer inzicht in kosten en baten
Het is momenteel niet goed mogelijk om de kosten en baten van verschillende opties voor stikstof- en klimaatbeleid tegen elkaar af te wegen. Hoewel sommige effecten wel kunnen worden gemonetariseerd is de bijdrage van stikstof niet altijd te kwantificeren. Dit is bijvoorbeeld het geval voor koolstofvastlegging door verhoogde stikstoftoevoer, de bijdrage van stikstof aan de globale koeling door aërosolen, de uitwisseling tussen ammonia en lachgas, bijdrage aan biodiversiteitsverlies, de keten van biobrandstoffen, etc. Er is meer onderzoek nodig om te komen tot een gemeenschappelijke basis voor de vergelijking van verschillende maatregelen en voor het kwantificeren van schade per eenheid stikstof voor de verschillende stikstof-componenten.
Summary
The overall objective of this assessment was to investigate the relation between climate policies and nitrogen related policies and (where possible) to determine the effect of (new) reactive nitrogen abatement on greenhouse-gas emissions and sinks in the Netherlands. Although there are different procedures possible when conducting an assessment, we did this by summarizing and synthesis of existing material on this subject. Because of the nature of this assessment, its conclusions may help in defining and prioritising future research on the different topics. In general we tried to identify the major drivers and interactions for flows of nitrogen and greenhouse gasses in the Netherlands in order to determine:
• the opportunities for synergism of climate and nitrogen policies • the risks for antagonism of climate and nitrogen policies.
Investigating the 'climate - nitrogen' system showed different interlinkages related to nitrogen and greenhouse gasses that are presented in the following overview (Figure I).
Industry/ traffic CO2, CH4 N2O P,T NOx, NH3 Aerosols Climate policies Agriculture N policies NO3 NO3 Aquatic ecosystems Terrrestrial ecosystems 3 1 2 5 4 Industry/ traffic CO2, CH4 N2O P,T NOx, NH3 Aerosols Climate policies Agriculture N policies NO3 NO3 Aquatic ecosystems Terrrestrial ecosystems Industry/ traffic CO2, CH4 N2O P,T NOx, NH3 Aerosols Climate policies Agriculture Agriculture N policies NO3 NO3 Aquatic ecosystems Terrrestrial ecosystems 3 1 2 5 4
Figure I Overview of the main interlinkages between nitrogen and greenhouse gases assessed here (explanation of the numbers is given in the text below).
In general the major producers of reactive nitrogen are also major greenhouse gas (GHG) emitters: industry (including energy), traffic and agriculture. Industry and traffic are responsible for more than 90% of the emission of CO2 equivalents in the Netherlands, while the nitrogen
emission from these source categories mainly consists of the emission of NOx (90% of total
Dutch NOx emission). Agricultural activities contribute relatively more to the emission of nitrogen
than to GHG. However, due to the interactions between the nitrogen and carbon cycle, agriculture is important both as source and sink of GHG. On the receptor side terrestrial and aquatic (eco)systems (including coastal waters) are important sinks for nitrogen and GHG emissions. At the same time these systems can also act as sources and therefore complicating relations between nitrogen and GHG considerably.
Five comprehensive smaller subsystems were identified for which the interactions between Nitrogen and GHG-emission could me more easily assessed and which are also relevant domains for (future) policies (denoted by the numbers in Figure I):
1. Emission of NH3, N2O, CO2 and fine particles from energy production
2. Impact of N-fertilization on net GHG emissions in agricultural systems
3. Impact of biofuel use, and associated land use change, on N and GHG emissions in the energy sector and agriculture
4. Impact of N deposition and climate policies on net GHG emissions in terrestrial
ecosystems
5. Impact of N-inputs on net GHG emissions in aquatic ecosystems
Apart from the first section, the following interactions were taken into account:
• Emissions of CO2 and N2O related to the production of nitrogen fertilizer (Chapter 3);
• CO2 sequestration in agricultural soils due to N input (fertilizer and manure) and in terrestrial ecosystems due to N deposition in response to elevated NH3 and NOx emissions (Chapter 5);
• N2O exchange from agricultural soils (Chapters 3 and 4), non agricultural soils (Chapter 5) and re-emission from aquatic systems in response to changed N input and N deposition (Chapter 6);
• CH4 emissions from animals, stored manure, agricultural soils and terrestrial ecosystems in response to changed N input and N deposition.
Section 1: Emission of NH3, N2O, CO2 and fine particles in energy production
The way in which energy is produced is largely determined by oil price and availability of fossil fuels, while the amount of energy that is used is depending on e.g. additional factors such as developments in consumer behaviour (which in turn is also related to the energy price). Presently this behaviour can be influenced by changes in climate (e.g. higher temperature - less heating, but more air conditioning). The energy production sector has contributed to issues like acidification through the emission of SO2 and NOx. In the past decades a large suite of
measures has been implemented Europe wide to reduce the negative effects caused by these emissions. The effect has been a reduction of 81 and 34% in European SO2 and NOx emissions
between 1990 and 2005, respectively. Looking at the energy production sector, the reductions have been achieved mainly by fuel switch and end-of-pipe techniques. NOx measures included
improved efficiencies e.g. high efficiency co-generation, fuel injection at gasoline engines; reducing air excess in industrial installations and Selective Catalytic Reductions (SCR). Side-effects of these measures include additional fuel use of 3% by cars and ~1% for refineries and coal based power stations.
Synergies between GHG and N emission reductions are possible in the energy production sector where NOx and CO2 can be reduced simultaneously by e.g. sustainable sources and
energy saving. In some cases also reduction of SO2 and particulate matter is possible at the
same time. However, it should be noted that antagonisms are also possible between measures focussing at specific compounds. This is especially true for the use of biofuels and bio-energy (see also following sections), but also for e.g. the earlier mentioned additional energy use through end of pipe techniques.
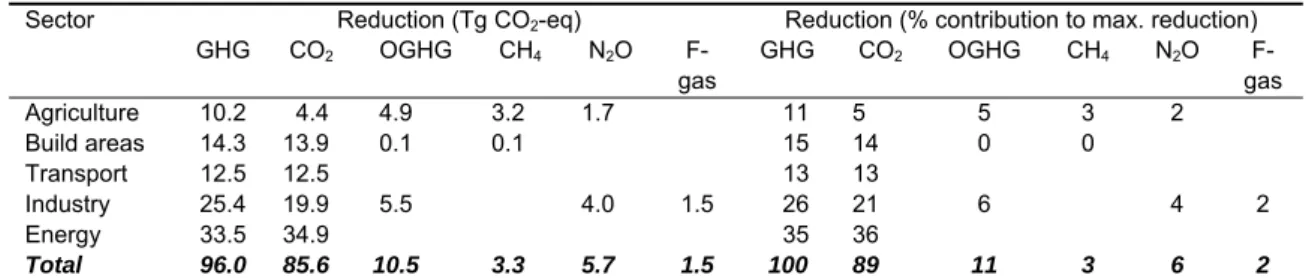
For the energy sector most of the new emission reduction measures focus on CO2 emission
reduction (with a possible simultaneous reduction of NOx and SO2). Within the Option document
on Energy and Emissions 2010/2020 (Daniels & Farla, 2006) it is concluded that the CO2
reduction potential for The Netherlands to reach NOx (and SO2) targets is about 10 Tg CO2.
However, to reduce CO2 emissions with 30% in 2020 (being the new Dutch government target)
energy saving, CO2 capture and storage, nuclear power and renewables will all be necessary.
All of these options at the same time will reduce NOx emissions, except some options for
bio-energy. Especially the decentralised bio-energy options will increase NOx emissions, because it
So far, there are only a few new options targeting NOx and SO2 emissions directly, such as
increased efforts in the emission trading for energy producers. In general the quantification of coupled CO2/NOx/SO2/PM emission reductions is possible, but requires further investigation.
A possible side-effect of the use of biofuels in e.g. co-firing systems is a change in the size-distribution of aerosols being emitted during the process. Some indications show that there is a shift towards smaller aerosols that may give a larger contribution to different human health issues. Aerosols not only contribute to these human health issues, but also have a cooling effect, compensating part of the global warming. In this context aerosols have a direct and indirect effect: direct because of the adsorption of radiation which will thus not reach the earth surface and indirect because aerosols form the cloud condensation nuclei as a basis for clouds, which also prevent radiation to reach the earth surface. Measures to reduce NOx and/or NH3
limit the formation of ammonium nitrate aerosol that is responsible for a cooling of about 2.5 W.m-2 in the Netherlands region (sum of direct and indirect). This cooling effect cannot directly be translated into a temperature change, because the relations are complex (temporal variations in aerosol concentrations and sizes, feedback mechanisms, interactions, etc.). Furthermore, the regional climate impact of aerosols is still poorly understood and it is not known if there is a positive or negative impact. It is advisable to quantify these side-effects of emission reductions and adopt the degree of implementation of policies/measures related to air pollution to new measures to reduce GHG emissions and vice versa.
Section 2: Impact of N-fertilization on GHG emissions in agricultural systems
The processes and issues under this section also apply to the next section on biofuels. The difference is made by the policies affecting N and GHG; cultivation of biomass for generation of fuels and electricity is mainly driven by climate policies, while conventional agriculture is mainly driven by food and feed demand. This section mainly focuses on the effects of N-measures on GHG emission:
• N-measures following from implementation of the EU National Ceilings directive for ammonia and the EU Nitrates directive,
• Production and use of chemical fertilizer for food, fodder and fibers.
Effects of climate change (temperature and precipitation) on the N and C cycle in relation to GHG emission and N-losses for agro-ecosystems can also be substantial but are hardly quantified for the Dutch situation and need further attention. Effects of climate measures on N-emissions in agriculture were not considered.
agriculture fertilizers N2, fossil fuels CO2 CO2 N2 NO3 NOx, N2O, NH3 Food Biomass for biofuels Animal feed manure Human SNG Transport fuels Chemicals Heat&Power NOx NH3 CO2 N2O? Waste
Figure II Nitrogen cascade through the agricultural system.
The figure shows the cascade of nitrogen through the system, starting with the production of chemical fertilizer and ending in food products for animals/humans and in energy application (bio-energy). During the cascade the nitrogen losses are apparent and there are different interactions with the emission of GHG. Following the cascade, the losses and interactions become more uncertain in terms of quantification and comprise a much broader scale in time and space. N2O is a large contributor to the overall GHG balance for food and bio-energy. N2O
is emitted during fertilizer production, application and further in the cascade (producing animal food, manure, losses to groundwater and atmosphere, etc.).
Even though the start of the cascade seems reasonably simple there are different estimates of the emissions of CO2, N2O and NH3 along with fertilizer application. The total GHG emissions
range from about 1 to 12 kg CO2-eq.kg-1 N in the final agricultural products, the contribution of
N2O to the total GHG emission is highest and most uncertain. This is also complicated by the
fact that emission factors for N2O are constantly being revised. The current range is so large
that in Life Cycle Analysis or Well to Wheel analysis it is uncertain whether cultivation of energy crops are a net source or sink of GHG! It is therefore very effective to abate N2O emissions from
fertilizer production. However, in general it can be stated that agriculture has substantial and partly evitable net GHG effects both by the arable sector (fertilizer) and animal sector (enteric fermentation and manure storage)
Current measures to reach the EU National Emission Ceilings for ammonia have a negative impact on N2O emissions through mandatory manure incorporation, implying the need of a
policy evaluation weighing the ammonia-ecology benefits against the GHG effect of additional nitrous oxide emission. The nitrate directive has lead to 30% reduction of total N inputs to Dutch agricultural soils and has direct co-benefits for NH3 emissions and for climate via reduction of
N2O emission. Further reduction to increase nitrogen efficiencies is possible. Ideally the
approach of marginal gain of Euros or CO2-eq emission should be used to find the optimal
fertilizer dose, including damage costs (and benefits) of the GHG-effects. When taking a national perspective (as opposed to a farmers perspective), the very likely outcome would be that the most appropriate fertiliser dose would be substantially lower than present N-fertilizer recommendations, for both food/fibre and energy crops.
Effective measures for agricultural production to limit nitrogen pollution should be aimed at reduction of the creation/use of reactive nitrogen, and will require increasing the nitrogen use efficiency in the various agricultural systems. If the nitrogen use efficiency can be increased
without affecting the yield of crops, there is no net effect on the carbon sequestration in soils. If the yield is smaller, less CO2 will be sequestered. However, the overall nutrient availability also
determines the distribution between tradable and non-tradable (e.g. roots and stems) yield. At lower nutrient availability plants will have to invest more in the non-tradable parts compared to the tradable parts, acting as a potential carbon sink when left at the fields.
A worthwhile measure to reduce CH4 and N2O emissions from manure handling seems (co-)
digestion of manure. This will increase the fertilizing value of manure as compared to chemical fertiliser at the same time. Focusing too much on biogas and energy generation may lead to unsustainability if this would reduce replacement of chemical fertilizer by manure and reduce the organic matter supply to the soil. Furthermore, irrespective of applying co-digestion, if feed stuff is imported, animal production likely will enhance depletion of nutrients and carbon of soils in the regions were the feed is produced. It is questionable if there is net GHG-emission reduction when (in particular poultry) manure is incinerated. As all N is inevitable lost and P is not recycled to agriculture, this loss of N and P would have be compensated by increasing use of chemical N and P-fertiliser (either here or in the region where the feed stuff was important from).
Section 3: Impact of biofuel use, and associated land use change, on GHG emissions
The stimulation of bio-energy will increase nitrogen losses because of increased fertilizer use, similar to the nitrogen-food cascade. Some energy crops might need more fertilizer than food because they most likely will be produced on marginal land used for agricultural or nature, and production will be driven by higher ton biomass per ha with a low fertilizer price compared to a high (biofuel) yield and price. Policies to stimulate bio-energy should focus on the sustainability criteria. Furthermore, food production and imports, especially for animal feed should be regulated using the same sustainability criteria as those for bio-energy, to prevent trade-off of environmental side effects of large scale biomass production from industrialized countries to developing regions!
Digestion or co-digestion of manure primarily is a climate measure. However, as it also generates new residues and products, it also affects implementation of the EU Nitrates directive and NEC ammonia directive. Digestion (with or without co-substrates) of manure can be a worthwhile measure to reduce methane from manure storage, and to increase the fertilizing value of manure as compared to chemical fertilizer, while producing energy (biogas or heat/power). At the same time digestion will reduce the manure volume and may change field application procedures, which may have an effect on application emissions of ammonia and nitrous oxide. Focusing too much on biogas and energy generation may lead to unsustainability if this would reduce replacement of chemical fertilizer by manure and reduce the organic matter supply to the soil. Addition of additional substrates (e.g. silage maize) to manure for co-digestion increases the energy yield, but is less attractive to reduce GHG emissions. Digestion of manure alone is less attractive for energy production, because the yields (and revenues) are much smaller, but the reduction of GHG emissions is much higher. While (co-)digestion is a widely promoted option to produce biogas and/or heat and power, it should be noted that this may lead to a competition between animal feed (silage maize) and energy/biofuels. The use of 2nd generation biofuels is then favourable in relation to energy/GHG balances. However, the competition with animal feed still needs attention.
When opting for a more decentralised bio-energy use for heat and power higher NOx emissions
may be the result. This is in contrast to large scale production facilities where possibilities exist for de-NOx and SCR installations and fuel use with possibilities for catalytic converters.
Table I gives an overview of several mitigation options in agriculture that have an effect on N and GHG.
Table I Mitigation options for the agricultural sector with an effect on N and GHG. Mitigative effects Measure Examples CO2 CH4 N2O NOx NH3 NO3 Cropland management Agronomy Nutrient management Tillage/residue management Water management (irrigation/drainage) Agro-forestry
Set-aside, land-use change
+ + + +/- + + + +/- + +/- + +/- + +/- + +/- +/- +/- + - + +/- +/- +/- + - + +/- +/- +/- +/- Grazing land management / pasture improvements Grazing intensity
Increased productivity (e.g. fertilization)
Nutrient management Fire management
Species introduction (including legumes) +/- + + + + +/- + +/- +/- +/- +/- +/- +/- +/- +/- +/- +/- - - +/- - - +/- Management of organic soils
Avoid drainage of wetlands + - +/- +/-
Restoration of degraded lands
Erosion control, organic amandments, nutrient amendments
+ +/- +/-
Livestock management
Improved feeding practices Specific agents and dietary additives
Longer term structural and management changes and animal breeding + + + + + + + + +/- + + +/- Manure/biosolid management
Improved storage and handling Anaerobic digestion
More efficient use as nutrient source + + + +/- +/- + +/- - + + + + + + + SCR options in (fertilizer) industry De-NOx, N2O abatement - +/- + + - +/-
Sustainable energy Wind mills, solar panels, energy saving, etc.
+ +/- +/- + +/- +/1
Bio-energy Energy crops, solid, liquid, biogas,
residues
+ +/- +/- - - +/-
+ denotes reduced emissions or enhanced removal (positive mitigative effect); - denotes increased emissions or suppressed removal (negative mitigative effect); +/- denotes uncertain or variable response
Section 4: Impact of nitrogen deposition on greenhouse gas emissions in terrestrial ecosystems
An increase in N deposition affects GHG exchange from these systems as it may lead to increased CO2 sequestration, due to enhanced biomass production, but also to enhanced N2O
emission and a reduced CH4 sink.
The productivity of many temperate ecosystems is nitrogen limited. Adding N via deposition thus has the potential to increase growth, and therefore to sequester CO2 from the atmosphere.
Besides by increased growth, an increase in N deposition on forests may increase C sequestration by an increased accumulation of soil organic matter. An increased rate of soil organic matter accumulation in response to increased N deposition may be due to (i) stimulation of growth and subsequent increased leaf/needle biomass and litter production and (ii) reduced long-term decomposition rates of organic matter, caused by an increased recalcitrance of N-enriched litter. Recent estimates range from a net carbon sequestration of 725 kg C per kg N added1 (as wet deposition) to 428 kg C per kg N added2 (as total deposition). Atmospheric
nitrogen deposition is also one of the key factors influencing N2O emissions together with the
soil C/N ratio.
An increased availability of nitrogen for the microbial processes of nitrification and denitrification, due to additional nitrogen deposition, will result in an enhanced N2O emission
from forest soils due to elevated nitrification and denitrification. Not only deposition is responsible for this increase; in many commercial forests nitrogen additions in the form of fertilizer N (urea or ammonium nitrate) can result in a doubling of the N2O emission rates from
forest soils. The indirect N2O emission from surface waters may also be increased by the
increased input of nitrogen via deposition, because it affects the nitrogen leaching/runoff from forests.
The relation between increased nitrogen availability and methane (CH4) exchange is still poorly
understood. The mechanisms of CH4 exchange differ from site to site, tipping the balance from
a net source to a net sink of CH4.
In this WAB study the quantification of the effect of additional nitrogen deposition on the GHG emissions in terrestrial ecosystems focused on European forest ecosystems. This is mainly because much of the research addressing this relationship was targeted on forested ecosystems. After estimating the, sometimes, counteracting relationships between nitrogen availability and GHG exchange, an overview can be given of the impact of nitrogen deposition on the net emission of the different GHG by European forests. This overview is listed in Table II, where estimated ranges in the long term annual average GHG emissions and the impact of nitrogen deposition on those emissions is given (together with changing GWP for the different GHG).
Table II Overview of the impact of nitrogen deposition on the net GHG emission by European forests.
GHG Emission change ( kg.ha-1.yr-1) per kgN GWP change (kg CO2-eq-1.ha-1.yr-1) per kgN
CO2-C -21 to -33 (-26) -78 to -118 (-100)
N2O-N +0.018 to +0.039 (0.029) + 7.1 to +17,9 (12.5)
CH4-C +0.001 to +0.018 (0.0093) + 0.036 to +0.39 (0.21)
1 The N deposition impacts are given for an estimated increase in total N deposition of 1 kg N.ha-1.yr-1
(and 0.43 kg NH4-N.ha-1.yr-1)
From the results in Table II it can be concluded that the GWP of CO2 sequestration in response
to nitrogen deposition is clearly outweighing the GWP of increased N2O emissions and that the
effect on the CH4 sink can be ignored. However, CO2 sequestration as a result of increased
deposition can be regarded as a positive side-effect of a negative environmental change. N-deposition in itself might have other environmental impacts, such as acidification, eutrophication, loss of biodiversity, NO3 pollution of ground water, etc.
A similar conclusion can be drawn for other ecosystems, based on the ratio of carbon sequestration to N input, which mainly determines the balance between N input and GHG exchange. The below-ground C sequestration, which is the ultimate sink for C, is comparable in forests and other terrestrial ecosystems, such as moorlands and heathlands. However, the positive relationship between N deposition and C sequestration in moorlands is debatable. Recent research in European peat bogs showed that N deposition promotes C losses.
Quantification of all above pathways shows that, when looking at the total chain from source to receptor (i.e. production, use, emission and subsequent deposition on e.g. nature areas), the overall impact of 1 kg N used in agriculture on the GWP (in kg CO2-eq) may be negligible when
the N is applied in the form of animal manure. When it is applied in the form of N fertilizer, it is
2 De Vries et al. (2008) Ecologically Implausible Carbon Response? Nature 451, E1-E3. / Sutton et al. (2008)
Uncertainties in the relationship between atmospheric nitrogen deposition and forest carbon sequestration. Global Change Biology 14, 2057-2063
likely to have a negative impact on the GWP due to the CO2 and N2O emissions during the
production of fertilizer which are, however, highly uncertain.
Assessing the efficiency of existing or future measures related to reduced N use requires a full quantification of its effects on the exchange CO2, N2O and CH4 by complete life cycle analyses,
including: (i) release of CO2 and N2O related to the production of N fertilizer, (ii) C sequestration
in agricultural soils in response to a change in N input, (iii) C sequestration in terrestrial ecosystems (forests) in response to a change in N (NH3) input induced by the change in N use,
including on-site and off-site sequestration and (iv) N2O exchange from agricultural soils, non
agricultural (forest) soils and re-emission from aquatic systems.
Section 5: Impact of N-inputs on GHG emissions in aquatic ecosystems
The role of aquatic systems in the exchange of GHG has not been investigated as thoroughly as compared to terrestrial systems, but it may be as important. When looking at aquatic systems a distinction can be made between upland fresh water lakes/streams, reservoirs, rivers, estuaries, seas/oceans. Obviously both N- and GHG- flows in these different aquatic systems are connected, but integrated studied are rare. The main focus of this section was on fresh water systems, although the other systems are also touched upon. Important drivers for the overall exchange of GHG from aquatic systems are the residence time and the load of both nitrogen and carbon. The residence time of a system strongly regulates the N/C processes within aquatic systems. An example of this is the nitrogen removal from the system. This will be enhanced at longer residence times through nitrification and denitrification, immobilization and/or retention. The nitrification and denitrification processes are important sources of N2O
emission.
It is known that aquatic systems can both act as a source or a sink of GHG, depending on the type of GHG (CO2, CH4, N2O) and of the system. When looking at fresh waters and coastal
zones, evidence is available to suggest that these systems are a net source of GHG. The total anthropogenic contribution to the GHG emission through surface waters is relatively small. There is a clear relation between the N2O emission and the anthropogenic contribution to these
systems through waste water and agricultural N losses.
When assessing specific measures targeting at reduction of N loads to aquatic systems, it is clear that N2O and possibly also CH4 emissions will be decreased. However, at the same time
the decrease in nitrogen loads may result in a decrease of the CO2 sequestration. Due to these
counteracting effects, the total effect of nitrogen measures on the GWP is uncertain. A complicating factor in determining the overall effect on the GWP is the fact that no quantitative information is available on the net CO2 sequestration of aquatic systems (neither actual, nor
past and future situation). Table III shows the quantification of a reduction in nitrogen load on N2O, CH4 and CO2 emissions from aquatic systems.
Table III Quantification of effect of changing N load on N2O, CH4 and CO2 emissions from aquatic
systems. Driver Effect N2O CH4 CO2 Reduction fertilizer use Less Nin ++ 1) ? - Reduction N deposition Less Nin ++ ? - Reduction animal numbers (manure)
Less Nin and Norg ++ ? ?
Improvement wastewater treatment
Less Nin and Norg ++ + ?
1). ++ = a strong reducing effect; + = a reducing effect; +/- = an uncertain effect; - = an increasing effect; -- = a strong
increasing effect; ? = uncertain effect
The effect of climate change on the emissions of GHG from aquatic systems is shown in Table IV. Although the effects of climate change on GHG emission from surface waters might be large, the net effect is uncertain. Possible measures addressing different water quality and
quantity issues may counteract: higher discharges in spring and autumn yield a decrease in GHG, whereas anthropogenic water management measures to regulate discharge and to prevent (summer) drought may increase GHG emissions.
Table IV Quantification of climate change on GHG emission from aquatic systems.
Effect CC Effect N2O CH4 CO2
Temperature increase Decomposition >
Degassing >
++ +/- ++
Higher discharge Not relevant Not
relevant
Not relevant
Not relevant Shorter up stream residence time Methonagesis >
Biomass > Degassing >
+ ++ ++
Another way nitrogen can influence the climate system is via the formation of aerosols in the marine system. The cooling effect of aerosols was already mentioned when discussing the emissions from energy production. The marine system can also contribute to this cooling effect by the production of dimethylsulphide (DMS), which is a result of the decomposition of demethylsulphoniopropionate (DMSP). DMSP is a biogenic product in seawater formed by phytoplankton and the diffusive transfer of DMS from sea-to-air is known to be the most important source of natural non-sea salt sulphur in the atmosphere. The relation between nitrogen and climate via the DMSP-DMS pathway can be described in short as follows: more nitrogen - more phytoplankton - more DMSP - more aerosols (more clouds above seas: cloud condensation nuclei).
General observations from this assessment
Besides the different conclusions for the different subsystems, some general policy relevant observations are presented here. They mainly focus on the most important interlinkages (both positive and negative) between nitrogen and climate policies, not yet firmly embedded in present policies. These observations are inspired by insights from the underlying studies and are important areas of interest for the future
Observation 1: Large scale production of biofuels
Use of biofuels or bio-energy requires more knowledge before it is applied on a large-scale because of (i) the uncertainty about their net CO2 effect, (ii) the negative side-effects on the
nitrogen cycle and (iii) the competition with the need of land for nature and/or food production. This is especially true in relation to the so-called first generation fuels. Negative side effects on the nitrogen cycle are additional emission of N2O and NH3, and increased leaching of nitrogen
to aquatic systems due to an increased used of artificial fertilizer. There are also additional NOx
emissions during the production and use of biofuels, like with decentralised combined heat & power installations. There is a clear need for integrated assessments addressing the all impacts related to the use of biofuels.
Observation 2: Enhanced carbon storage in natural systems through nitrogen fertilisation
Stimulating carbon storage in organic matter of natural and semi-natural ecosystems by increased input of nitrogen is potentially a relevant but temporary option to compensate for the emission of GHG. The use of this option as part of climate policy can conflict with nitrogen policy, because the increased generation (or lower ambitions for reduction) of reactive nitrogen by production of fertilizer and fossil fuel combustion leads to effects such as eutrophication, acidification, air pollution, etc. A complete quantification of the effects of nitrogen use on the exchange of CO2, N2O and CH4 by means of a life cycle analysis (LCA) will give more insight in
the most optimal use of nitrogen in agriculture with a focus on the net GHG effect.
Policies aimed at enhancing carbon sequestration in forests, (e.g.) by allowing a continuation of the present high nitrogen deposition levels, implies a larger value being put to the societal damage due to climate change compared to eutrophication. At the moment science cannot provide a suitable method for supporting this decision. Societal damage by climate change and
eutrophication are both originating from changes in biodiversity, but proper weighting requires that this damage (and other negative effects) are expressed in comparable units.
Observation 3: Need and opportunity for the reduction of nitrogen fertilizer
Given the negative effects of an excess use of fertilizers, in terms of eutrophication, acidification, large scale air pollution, water pollution and climate change (GHG emissions), it is very relevant to optimise the production and use of chemical nitrogen fertilizer. Emission of N2O
during production of chemical fertiliser can be reduced by implementing existing process technology. There are also various options to increase the efficiency of the use of chemical fertilizer. The current opinion in agriculture is that when cheap fertilizer is available, using large quantities of nitrogen is a good option to lower the risks for reduced profits by lower crop yields. However, when also considering societal damage due to climate change and other nitrogen related effects, the economical optimal fertilisation level will be lower. Particularly in the industrialized countries measures aimed at increasing the fertiliser efficiency are effective to mitigate climate change and other nitrogen related effects without additional risks to food production.
Observation 4: Integrated nitrogen policy requires more insight in costs and benefits
It is currently almost impossible to weigh the costs and benefits of different options for nitrogen and climate policy. Whereas some effects can be monetised, the contribution of nitrogen can not always be quantified. This holds e.g. for the additional CO2 sequestration by nitrogen
enrichment, the contribution of nitrogen to global cooling of aerosols, the pollutant swapping between ammonia and N2O, contribution to biodiversity loss, the chain of biofuels, etc. More
research needs to be done to find a common ground for comparison of different measures and to quantify damage effects per unit of nitrogen for the various nitrogen compounds.