A publication of the
Netherlands Environmental Assessment Agency P.O. Box 303, 3720 AH Bilthoven, The Netherlands www.mnp.nl/en
Report 500113001
J.A.Bakkes et al.
Background report to the OECD Environmental
Outlook to 2030 Overviews, details, and methodology
of model-based analysis
ound r epor t to the OECD En vir onmental Outlook to 2030 MNP Repor t 500113001Background report to the OECD Environmental Outlook to 2030 Overviews, details, and methodology of model-based analysis
International environmental policy has a chance of succeeding if Brazil, Russia, India and China participate, and if swift action is taken. Then, serious climate policy will be affordable and feasible. The Netherlands Environmental Assessment Agency and OECD have assessed a package of policy measures in the area of free trade, climate, water and air. These analyses form the basis of the OECD Environmental Outlook to 2030.
Rapport de base des Perspectives de l’Environnement à l’Horizon 2030 Présentation, Détails et Méthodologie de l’Analyse Basée sur les Modèles La politique environnementale internationale a une chance de réussir si le Brésil, la Russie, l’Inde et la Chine participent, et si une action rapide est prise. Alors, une politique climatique sérieuse sera abordable et faisable. L’Agence Néerlandaise d’Évaluation Environnementale (MNP) et l’OCDE ont évalué un ensemble de mesures de politique dans le domaine du libre échange, du climat, de l’eau et de l’air. Ces analyses forment la base des Perspectives de l’Environnement de l’OCDE à l’horizon 2030.
Overviews, details, and methodology of model-based analysis
Netherlands Environmental Assessment Agency
J.A. Bakkes* (ed.) P.R. Bosch (ed.) A.F. Bouwman H.C. Eerens M.G.J. den Elzen M. Isaac P.H.M. Janssen K. Klein Goldewijk T. Kram F.A.A.M. de Leeuw J.G.J. Olivier M.M.P. van Oorschot E.E. Stehfest D.P. van Vuuren OECD P. Bagnoli J. Chateau J. Corfee-Morlot Y-G. Kim
With contributions from LEI-Wageningen and the Center for Environmental Systems Research (CESR, University of Kassel)
The opinions expressed in this papers are the sole responsibility of the authors and do not necessarily reflect those of MNP, the OECD or the governments of its member countries. Comment are welcome, and should be sent to the corresponding author at info@mnp.nl or env.contact@oecd.org or at the Netherlands Environmental Assessment Agency or at the OECD Environment Directorate, at the addresses below.
MNP reports can be downloaded from www.mnp.nl
This background report is also available on www.oecd.org/environment/outlookto2030
ISBN 978-90-6960-196-0
MNP Report 500113001/2008
© MNP 2008, © OECD 2008
Parts of this publication may be reproduced, on condition of acknowledgement:
‘Netherlands Environmental Assessment Agency, and Organisation for Economic Co-Operation and Development, the title of the publication and year of publication.’
MNP Netherlands Environmental Assessment Agency, P.O.Box 303, 3707 AH Bilthoven, The Netherlands, info@mnp.nl
OECD Organisation for Economic Co-Operation and Development, 2 rue André Pascal, F-75775 Paris Cedex 16, France
About this report
This background report provides overviews of the forward-looking analyses carried out for the OECD Environmental Outlook to 2030 (OECD, 2008). The first of these overviews gives the results of three comprehensive policy packages that were simulated: enhanced environment-related policies in OECD countries, in OECD countries+BRIC and in OECD
countries+BRIC+Rest of the World. The second overview summarises the impact of the Base-line and policy packages on the various regions, showing important differences and similarities. These overviews are important in order to appreciate the case for international collaboration. The focus of this report is on the comprehensive analyses conducted with the suite of models of OECD, MNP and others. It does not discuss theme-specific simulations that were run directly with the ENV-Linkages model of OECD. Moreover, the focus of the report is on the analyses in which model-based quantification is important.
Furthermore, this report documents the results of model-based quantification in more detail than available in the OECD Environmental Outlook report. Frequently these details have featured in discussions with delegates and other reviewers and, from a good practice point of view, are therefore documented in this report.
Other examples of the importance of documenting details are the time series that were
developed as part of the modelling for the Outlook. For many environmental variables, the full set includes the period from 1970 to 1980, which helps to put the projections into perspective. Additionally, the analysis for the slow-changing processes features a policy horizon of 2030 and an impact horizon of 2050. This background report gives this sort of wider information, allowing the Outlook reader a better understanding of the results in the main report.
Finally, this report describes the modelling framework and the assumptions behind the outcomes in the OECD Environmental Outlook to 2030. It explains the relation between the variables used in the Outlook. Also, it discusses the main uncertainty issues at a deeper level than in the main report.
JEL Classification : Q01, Q54, Q58, Q56 Keywords:
Assessment, outlook, environment, model, scenario, world, future, policy, economy, globalisation, integrated assessment, uncertainty
Rapport in het kort
Wanneer Brazilië, Rusland, India en China meedoen én wanneer er snel actie wordt onder-nomen, heeft internationaal milieubeleid een kans van slagen. Serieus klimaatbeleid is in dat geval uitvoerbaar en betaalbaar. Het Milieu- en Natuurplanbureau heeft hiervoor samen met de OESO een pakket maatregelen doorgerekend op het gebied van vrijhandel, klimaat, water en lucht. Deze analyses vormen de basis van de OECD Environmental Outlook to 2030.
Résumé
La politique environnementale internationale a une chance de réussir si le Brésil, la Russie, l’Inde et la Chine participent, et si une action rapide est prise. Alors, une politique climatique sérieuse sera abordable et faisable. L’Agence Néerlandaise d’Évaluation Environnementale (MNP) et l’OCDE ont évalué un ensemble de mesures de politique dans le domaine du libre échange, du climat, de l’eau et de l’air. Ces analyses forment la base des Perspectives de
l’Environnement de l’OCDE à l’horizon 2030.
Ce rapport de base offre la présentation et les détails des analyses pour les Perspectives, basées sur des modèles d’évaluation intégrées. Les analyses globales ont été menées dans 24 régions. Elles couvrent le changement climatique, la pollution de l’air en milieu urbain et les impacts sanitaires liés; la charge nutritive à l’environnement aquatique par l’agriculture et par les tendances en assainissement et systèmes d’égout; la biodiversité terrestre.
Un scénario de ligne de base a été développé, ainsi que trois ensembles de politique. La majorité des analyses basées sur les modèles pour les Perspectives de l’Environnement incluent un examen rétrospectif jusqu’en 1970 et prospectif jusqu’en 2050. Ceci permet l’évaluation du coût de l’inaction politique et de la remise à plus tard d’une telle action.
Ce rapport de base compare les impacts de la ligne de base pour les différentes régions du globe. Il évalue également l’impact des incertitudes dans la modélisation des messages clés des
Contents
Figures and Tables 13 Summary 17
The Baseline 18
The policy simulations 19 Part 1: Overviews 21
1.1 Policy packages with participation by OECD, BRIC and the Rest of the World 21 1.1.1 Introduction 21
1.1.2 Global results 21
1.2 Environmental impacts of Baseline and policy packages, by region 26 Part 2: Detailed findings 31
2.1 The Baseline 31
2.1.1 Population and economic developments 31 2.1.2 Economic developments 32
2.1.3 Energy use 38
2.1.4 Agriculture and land use 42 2.1.5 Climate change 50
2.1.6 Air pollution 53
2.1.7 Water quantity issues 58 2.1.8 The nitrogen cycle 61 2.1.9 Terrestrial biodiversity 65 2.2 Policy simulations 71
2.2.1 Policy simulations agriculture and land use 71 2.2.2 Policy simulations Energy and Climate change 73 2.2.3 Policy simulations air pollution 91
2.2.4 Policy simulations water use and availability 96 2.2.5 Policy simulations nutrient cycles 98
2.2.6 Policy simulations Biodiversity 108
Part 3: Methodology 115 3.1 Model descriptions 115
3.1.1 ENV-Linkages 116 3.1.2 LEITAP 120
3.1.3 IMAGE Energy (The TIMER model) 125 3.1.4 IMAGE emissions database (‘EDGAR’) 126 3.1.5 IMAGE overall; and terrestrial module 128 3.1.6 Coupling of LEITAP and IMAGE 131 3.1.7 FAIR 2.1 134
3.1.8 WaterGAP 135
3.1.9 Air pollutant emissions 136 3.1.10 Air Quality models 137
3.1.11 Modelling of the fate of nutrients 142 3.1.12 Biodiversity Indicator and Modelling 146 3.1.13 Connections between the models 150 3.2 Uncertainty issues and limitations 152
3.2.1 Introduction 152
3.2.2 Sources of uncertainty 154
3.2.3 Implications for the robustness of the main conclusions 163 Annexes 171
Regional classification 171
Overview of key variables per theme 173 References 175
Abbreviations, units and conversions 181 Acknowledgements 183
Figures and Tables
Figures
Figure 1.1 Emissions of greenhouse gases, difference with the baseline Figure 1.2 Emissions of sulphur dioxide, difference with the baseline Figure 1.3 Remaining terrestrial biodiversity, difference with the baseline
Figure 1.4 Load of nitrogen compounds on fresh water ecosystems, difference with the baseline
Figure 1.5 GDP per capita
Figure 2.1 World population, baseline
Figure 2.2 Imports in proportion to GDP, baseline Figure 2.3 Gross Domestic Product, baseline
Figure 2.4 Gross Domestic Product per capita, baseline Figure 2.5 Sectoral value added, baseline
Figure 2.6 Final energy use by energy carrier, baseline Figure 2.7 Final energy use OECD, BRIC and ROW, baseline
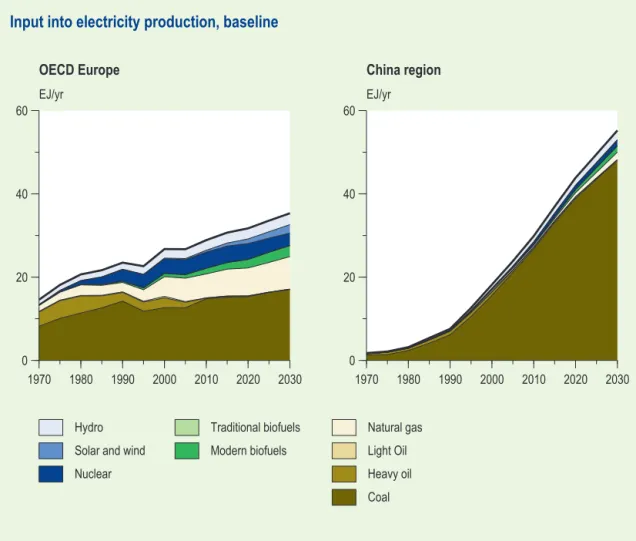
Figure 2.8 Primary inputs into electric power production, baseline
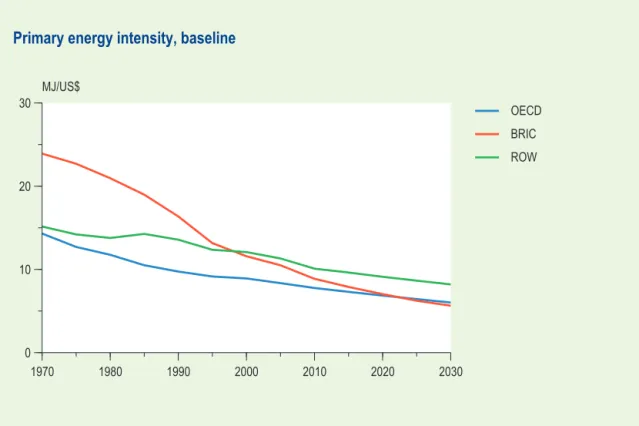
Figure 2.9 Primary energy intensity of OECD, BRIC and ROW economies, baseline Figure 2.10 Oil consumption and trade, baseline
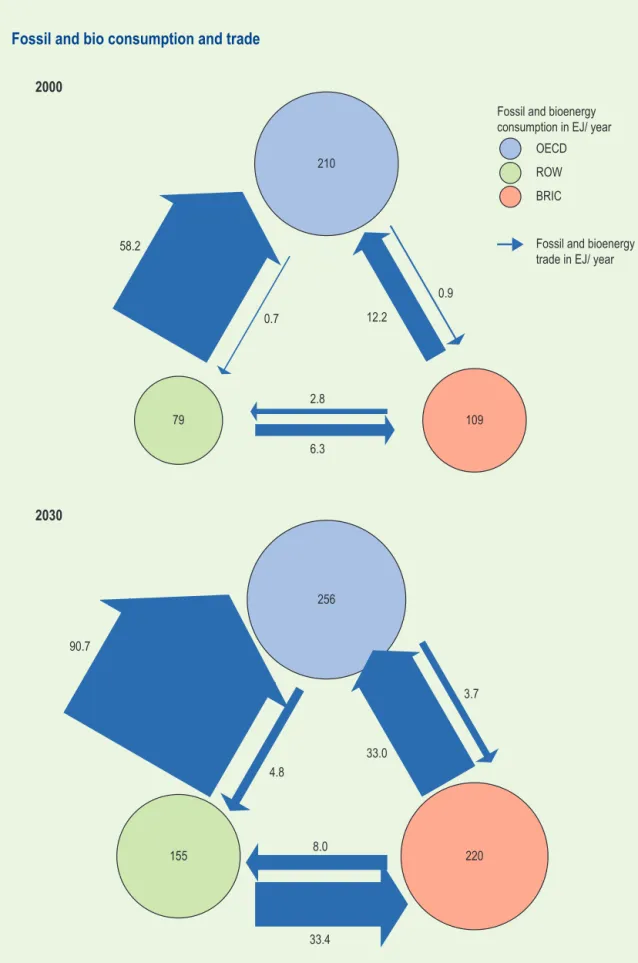
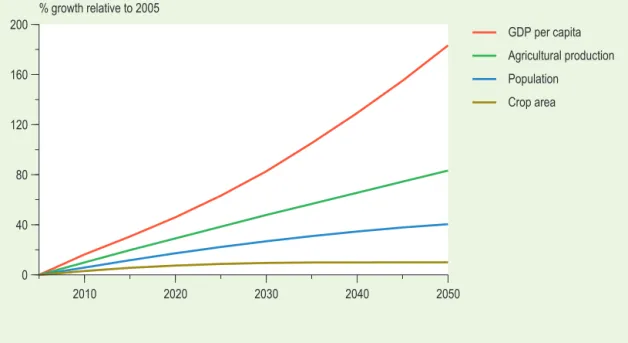
Figure 2.11 Consumption and trade of fossil fuels and biomass, baseline Figure 2.12 Growth of world population, GDP per capita,
agricultural production and crop area; baseline Figure 2.13 Production of food crops, baseline
Figure 2.14 Production of animal products, 2005-2050, baseline Figure 2.15 Change in crop area, 2005-2050, baseline
Figure 2.16 Water erosion sensitivity, 2030, baseline Figure 2.17 Agricultural areas in arid zones
Figure 2.18 Area with decreasing, stable or increasing yield of wheat in 2050 relative to 1990, baseline
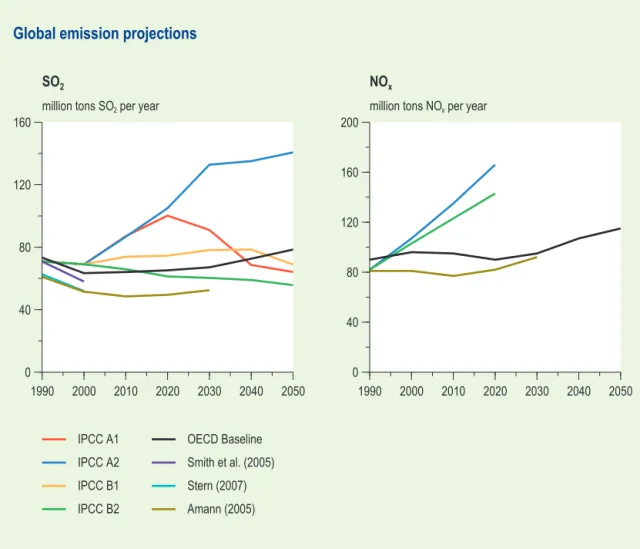
Figure 2.19 Global baseline emissions of sulphur dioxide and nitrogen oxides Figure 2.20 Annual mean particulate matter (PM10) concentrations, baseline
Figure 2.21 Exposure of the urban population to particulate matter (PM10)
Figure 2.22 Ozone concentrations at ground level, 2000 and 2030 baseline
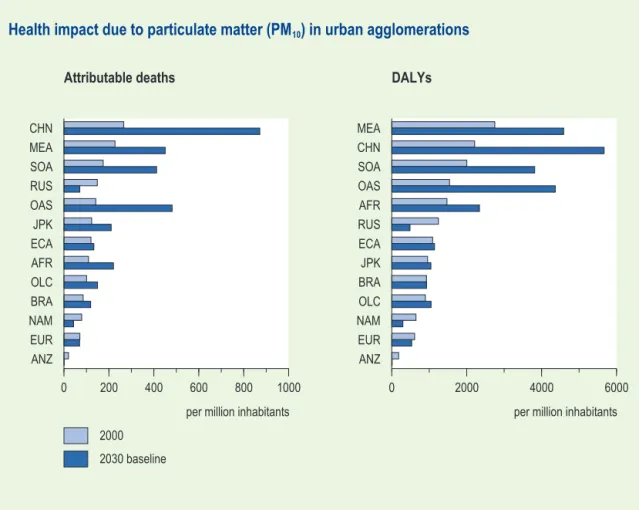
Figure 2.23 Baseline estimates of premature deaths and of the loss of DALYs from airborne particulate matter in urban agglomerations
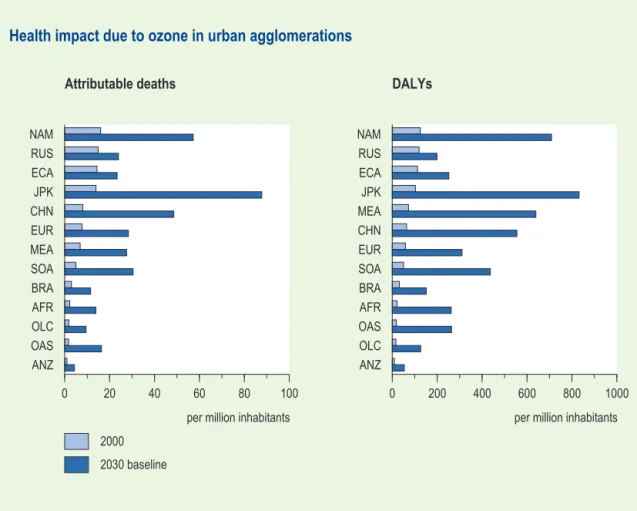
Figure 2.24 Baseline estimates of premature deaths and of loss of DALYs due ozone exposure in urban agglomerations
Figure 2.25 Water stress areas in 2030, baseline
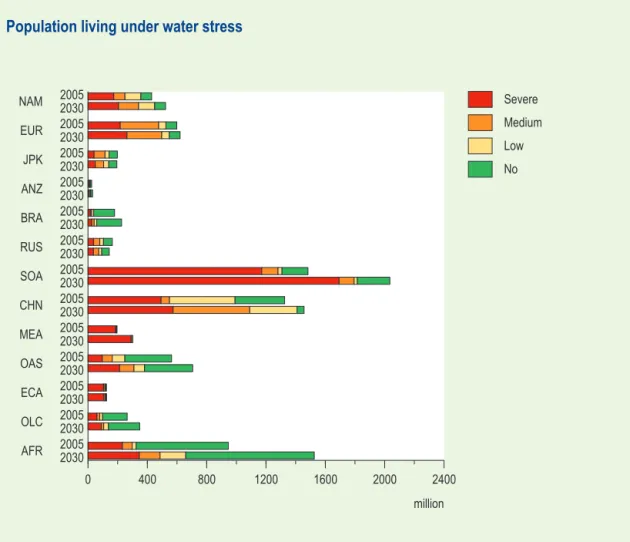
Figure 2.26 Population by degree of water stress in the drainage basin, baseline
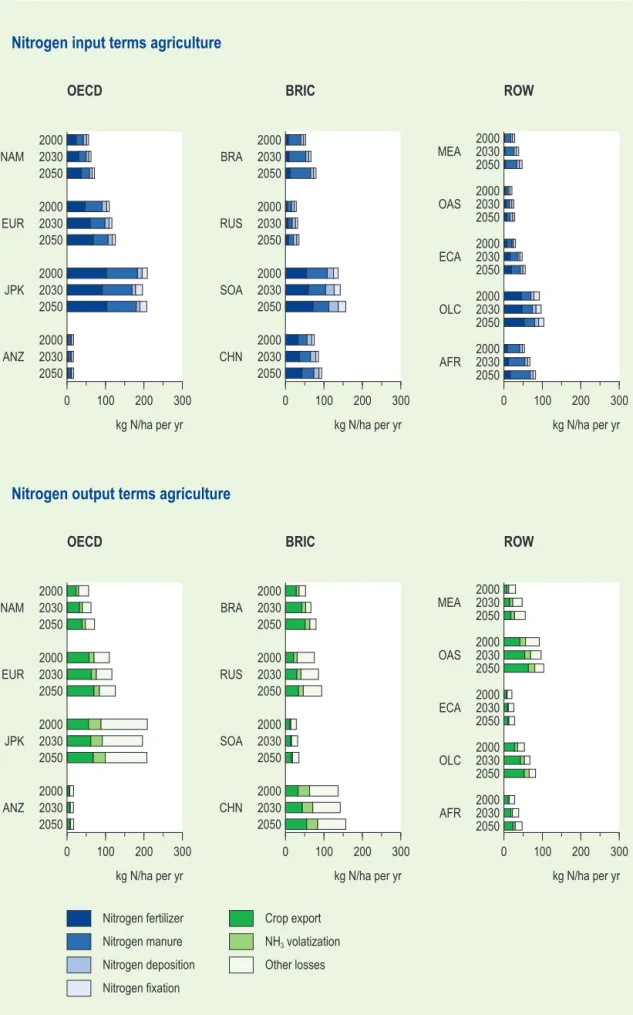
Figure 2.27 In- and output terms constituting the agricultural nitrogen balance, baseline Figure 2.28 Global biodiversity from 1700 to 2050, baseline
Figure 2.29 Global biodiversity loss in the baseline
Figure 2.30 Biodiversity levels in the OECD and BRIC regions and Rest-of-the-World: remaining levels and contributions to the decline, baseline
Figure 2.31 Change in agricultural area in 2050 relative to 2000 for Baseline and policy cases Figure 2.32 Change in food crop area in 2050 relative to 2000 for the baseline and the policy
Figure 2.33 Change in grassland area in 2050 relative to 2000 for the baseline and the policy cases
Figure 2.34 Greenhouse gas emissions in the climate policy cases analysed Figure 2.35 Global greenhouse gas emissions; comparison to stabilization profiles
Figure 2.36 Contribution of different measures to decreases of greenhouse gas emissions, 450 ppm multigas case
Figure 2.37 Primary energy use, by energy carrier, baseline and climate policy cases Figure 2.38 Abatement costs of greenhouse gas emissions relative to GDP
Figure 2.39 Net present value of abatement costs and decrease of greenhouse gas emissions in comparison with the baseline, 2010-2050
Figure 2.40 Greenhouse gas emissions and abatement costs for stabilisation at 450 ppm carbon dioxide equivalent, comparing a cap-and-trade system and global carbon tax, by three regional groups
Figure 2.41 Abatement costs for stabilisation at 450 ppm carbon dioxide equivalent, comparing cap-and-trade system and global carbon tax, by thirteen regional clusters
Figure 2.42 Global mean temperature increase to 2050 under various policy cases Figure 2.43 Rate of change of global mean temperature
Figure 2.44 Change in annual precipitation: Baseline difference 1990-2050 and policy cases difference with the Baseline by 2050
Figure 2.45 Global mean temperature increases to 2100, baseline and stabilization cases Figure 2.46 Emissions of sulphur and nitrogen oxides: baseline and policy cases
Figure 2.47 Sulphur dioxide emissions in climate policy cases
Figure 2.48 Premature deaths from exposure of populations of urban agglomerations to particulate matter, Baseline and policy cases, 2030
Figure 2.49 Loss of DALYs from exposure of populations of urban agglomerations to particulate matter, Baseline and policy cases, 2030
Figure 2.50 Water use in the Baseline, policy packages and two GEO4 scenarios Figure 2.51 River nitrogen load originating from nonpoint sources
Figure 2.52 Access to improved sanitation and connection to sewerage Figure 2.53 Removal of nitrogen from sewage
Figure 2.54 River nitrogen load originating from nonpoint sources Figure 2.55 River nitrogen load, all sources
Figure 2.56 Schematic representation of the relation between direct and indirect drivers of change and biodiversity loss
Figure 2.57 Biodiversity loss between 2000 and 2030 in OECD countries
Figure 2.58 Biodiversity change since 2000 due to area use for the production of woody biofuels and to climate change
Figure 2.59 Biodiversity loss between 2000 and 2050: baseline, global policy package and 450 ppm multigas stabilisation
Figure 3.1 The modelling principle applied in the OECD Environmental Outlook Figure 3.2 Overview of the models used
Figure 3.3 Structure of production in ENV-Linkages Figure 3.4 Land allocation tree within LEITAP Figure 3.5 Land supply curve for Canada and China
Figure 3.6 The chain from demand for energy services to related emissions as modelled by TIMER
Figure 3.7 Schematic diagram of IMAGE 2.4 Figure 3.8 LEITAP and IMAGE coupling
Figure 3.10 Scheme of estimation of sewage nitrogen effluent to surface water Figure 3.11 Scheme of surface nitrogen balance for agricultural systems
Figure 3.12 IMAGE 2.4 calculation of river nitrogen load from nitrogen leaching, atmospheric nitrogen deposition and sewage nitrogen effluent
Figure 3.13 Homogenization process and mean species abundance (conceptual scheme) Figure 3.14 Dataflow overview environment
Figure 3.15 Dataflow nutrients Figure 3.16 Dataflow air quality
Figure A.1 Map of regions used in environmental modelling for the OECD Environmental Outlook
Tables
Table 1.1 Overview of environmental policy packages for integrated analyses
Table 1.2 Synopsis of environmental impacts, by regional cluster
Table 2.1 Population increase, baseline
Table 2.2 Productivity growth variants: GDP difference from baseline by 2030
Table 2.3 Change in land used for agriculture in 2030, baseline
Table 2.4 Change in greenhouse gas emissions from land use changes 2005-2030, baseline
Table 2.5 Emissions of greenhouse gases from energy use, industry and land use; baseline
Table 2.6 Water use, baseline
Table 2.7 Global water use, by sector, baseline
Table 2.8 Broad policy packages analysed with environmental models
Table 2.9 Climate and energy policy variants
Table 2.10 Atmospheric GHG concentrations, global mean temperature, rate of temperature change
Table 2.11 Air pollution control costs in addition to the baseline, global policy package Table 2.12 Nitrogen uptake ratio for upland crops, energy crops and wetland rice Table 2.13 Fertilizer use for all crops, grassland and energy crops
Table 2.14 Total inputs of reactive nitrogen for agricultural land
Table 2.15 Crop nitrogen uptake and nitrogen uptake in the form of grazing or grass or hay cutting
Table 2.16 Nitrogen surplus in agricultural systems
Table 2.17 Population with access to improved sanitation, connection to public sewerage; removal of nitrogen from sewage; 2030
Table 2.18 River nitrogen export, contribution from various sources
Table 3.1 Main assumptions in the TIMER model
Table 3.2 Assumed introduction period for enhanced emission control for conventional
macro air pollutants in the power and industry sectors
Table 3.3 Estimates of relative risk of mortality, coefficients of concentration response
function (B)
Table 3.4 Types of sewage treatment distinguished and their nitrogen removal rates
Table 3.5 Assumptions for access to improved sanitation, population with sewerage
connection and nitrogen removal in sewage treatment systems
Table 3.6 BRIICS versus BRIC
Table A.1 Clustering of model results for presentation in the OECD Environmental Outlook
Summary
What will be the consequences, over the next decades, if no policy action is taken to address the key environmental issues? What can be done about the problems? What is the significance to governments of OECD countries of the increasing global interconnectedness and the emerging significant players such as Brazil, China, India and Russia? What does this mean in terms of the potential for and type of solutions to environmental problems of the next decades?
The new OECD Environmental Outlook to 2030 reports on these questions (OECD, 2008). Its backbone is model-based quantification. This background report of the Outlook provides overviews, details and a methodological account of the model-based analyses developed for the Outlook. It focuses on the environmental projections. A closer look at uncertainties is included. The key dimensions of the analyses for the Outlook are as follows. Most of them cover the past from 1970 and the future up to at least 2030 (2050, for many issues). As a reference for policy options, the consequences of a no new policies Baseline are quantified. Among other things, this provides the basis to assess the consequences and some of the consequences of inaction.
Three policy packages are analysed, comprising measures on issues ranging from agricultural trade to worldwide air pollution. They illuminate the link between policies of OECD countries and those of the new significant players in the world economy. The packages are distinguished as follows: enhanced policies in OECD countries only; in OECD countries plus Brazil, Russia, India and China (BRIC); and in OECD countries plus BRIC plus the Rest of the World.
In order to properly assess efforts and the distribution of impacts, a fairly detailed regional breakdown has been applied, namely 34 regions in the economic modelling and 24 regions plus a spatial grid for the environmental projections.
The overviews in part 1 of this background report show, for example, that the impact of air pollution on human health can be actively pushed back. In many parts of the world outside OECD, air pollution policies have to row against the tide of urbanisation and ageing, when attempting to effectively reduce health impacts. Global circulation of air pollution in the north-ern hemisphere is becoming a handicap for local air quality managers.
The details in part 2 make up the lion’s share of this report. They show, for example, expansion of sanitation and sewerage in the spirit of the Millennium Development Goals, competing with the need to protect water ecosystems and human health – necessitating that sewage treatment is part of sanitation programmes. Also, they show that limiting global warming at two degrees Celcius is achievable but requires, among other things, a more compact agriculture. In another example is shown that biodiversity is declining in the Baseline as well as in the policy packages, for lack of specific policies.
The methodological account in part 3 decribes the models of OECD and MNP, as well as of others, that have been used in support of the analysis in the Outlook. Special attention is given to the way they have been combined for this exercise. The discussion of uncertainty issues iden-tifies sources of uncertainty, as is also briefly touched upon in the Outlook itself. The Baseline, problem framing and indicator selection are important factors. It is important to realise that the Baseline is not the sure autopilot path to 2030 and 2050 in terms of environmental conditions.
For example, the coming decades could conceivably bring lasting dependence on large-scale low-tech coal use in some regions. This would mean much more air pollution, much more greenhouse gas emissions and consequently the cost of inaction would be much larger.
The Baseline
The Baseline projects a stylised picture of the environmental developments in the next decades. Its hypothesis is no new policies in response to environmental pressures - as well as no new policies on subsidies in agricultural production and on tariffs in agricultural trade. The picture from an environmental perspective is disconcerting. In the absence of additional policy interven-tions and under conservative economic assumpinterven-tions, the environmental outcomes deteriorate as the expanding and more affluent population exerts increasing pressure on the natural resource stocks.
Under the conservative assumptions of the baseline, by 2030, annual emissions will have increased by more than fifty percent, compared to 2000. By 2050, they will have increased by almost seventy per cent. (Counting from 2005, as reported in the Outlook main report, this is +37% and +52%, respectively.) Together with previous emissions, the ongoing build-up of atmospheric concentrations keeps global warming going at a rate of almost 0.3°C every ten years. Biodiversity keeps deteriorating. Once plentiful land resources (for agriculture, energy crops and carbon sequestration, urban uses and transport, leisure and nature) will be squeezed. On the positive side, production technology keeps improving, as reflected in improvement of labour productivity and sectoral composition of the world’s economies. Specifically, energy efficiency continues to improve, as does land-efficiency in agriculture. But this is more than offset by the increased demands of a world population of over 9 billion by 2050 (+ 50% since 2000) with on average three times greater affluence.
Much of the increase in pressures has to do with the growth of significant new players outside the current OECD, such as Brazil, Russia, India and China. But at the same time, in OECD countries key driving forces of environmental pressure – for example, energy use per capita - continue as before.
In OECD countries, conventional pollution will by and large cease to grow under Baseline condi-tions, or the growth will level off. Transport-related problems such as air pollution are a notable exception.
The methodology applied in this study allows a regional specification of this picture, as shown by the maps and regional charts. These illustrate the broad distinction between OECD, BRIC and the Rest of the World for most issues at stake. Broadly speaking, the Baseline development sends red flags going up for atmosphere and water issues in particular in India, China and the Middle East; for land use in particular in Brazil, India and Africa; and for climate and biodiver-sity in all regions.
Energy and land emerge from the analysis as the key resources which use in the next decades governs interdependence as well as environmental problems. However, also for the old-fashioned problems of urban air pollution and sewage the Outlook reveals noteworthy insights.
in urban agglomerations would not increase, the health damage such as premature mortality would. This is caused by urbanisation and ageing during the next decades, in particular outside OECD countries. Secondly, on the Northern hemisphere, global circulation of air pollution will increasingly frustrate the work by local air quality managers in relatively clean areas.
For sanitation and sewerage, the – perhaps unsurprising – news is that the increasing number of urban dwellers with access to improved sanitation and public sewerage, although a great asset for health and development, will at the same time severely increase the pollution burden on coastal marine ecosystems. This, too, is related to urbanisation and will happen at a large scale outside OECD countries.
An analysis of variants to the economic Baseline mostly indicate a potential for an even stronger increase in economic activities. This applies especially to the BRIC group, if developments over the next decades would continue like they have since 2000, rather than between 1980 and 2000. In addition, it is conceivable, even without new policies, that production stages will continue to be spread internationally and this in turn would mean a stronger growth of environmental pressures from transport than there is in the Baseline. In all, from an environmental viewpoint, the uncertainties around the Baseline seem asymmetric, more towards the side of larger environmental pressures than is projected in the Baseline.
In the Outlook, these projections are used to assess the cost of inaction. They also set the stage for the model-based policy simulations that are central to the outlook and presented in detail in the following sections.
The policy simulations
Comparing the results of the policy simulations to the Baseline reveals, above all, that serious environmental issues can be addressed at moderate cost. In addition, comparison between three comprehensive policy packages with broadening participation -- OECD only; OECD+BRIC and OECD+BRIC+Rest of the World -- underscores the point that the current round of globalisation also may pave the way for effective environmental policies at the global scale.
Climate change options have been explored in detail, separate from the three comprehensive packages. This quantifies examples of the environmental cost of delaying action and of the benefits of burden sharing between countries.
Two sets of findings are particularly illustrative regarding ambition levels of environmental policies. Firstly, the modelling results indicate that stabilising greenhouse gas concentrations at approximately 450 ppm carbon dioxide equivalent is feasible and affordable to the world as a whole. But it requires nearly the full range of the considered technologies to be deployed and worldwide participation is necessary. Secondly, there is biodiversity. None of the analysed policy packages includes policies specifically targetted at halting biodiversity loss. Consequently, the results show biodiversity will continue to decline. Only certain side-effects from, for instance, climate policies have some impact.
Liberalising agricultural production and trade creates opportunities for a more efficient •
use of resources and for fair trade. At the same time, it will induce a shift in the location of agricultural production towards regions where land is cheap. Thus, other things being equal, this may result in a net increase of pressures on biodiversity. The outlook concludes that ‘depending on where agricultural production is reduced and where it is increased in these shifts, this could lead to a reduction in global biodiversity value’.
Air polluting emissions typically decrease as an ancillary effect of climate policies. On •
the other hand, serious air quality policies worldwide will considerably decrease aerosol concentrations and thus affect global warming – temporarily hampering the effect of climate change mitigation efforts. This requires more detailed analysis.
Providing improved sanitation and sewerage to urban dwellers more rapidly than in the •
Baseline would be in the spirit of the Millennium Development Goals. However, even the projected extra increase in sewage treatment is not enough to keep up with this. The net result is a very large increase of the environmental pressure on coastal marine systems. The Outlook’s main report has combined the model-based findings with insights on policy instrument mixes and institutional capacities. Interestingly, for some global problems the technical potential to address them is currently clearer than the policies that would mobilize this potential. An important example of this is the potential to keep worldwide agriculture more compact in terms of land use, than under the conditions of the Baseline or the comprehensive policy packages. Modelling shows this to be a key factor from a point of view of climate stabilisation and biodiversity conservation. But policy options that to promote this are currently lacking
Part 1: Overviews
1.1
Policy packages with participation by OECD, BRIC
and the Rest of the World
1.1.1 Introduction
The OECD Environmental Outlook to 2030 presents comparative policy analysis: what difference can policies make over the next decades, relative to a no new policies Baseline? Most importantly, it revisits the case for collaboration between OECD countries and non OECD-countries. The analysis has been set up in such a way that it highlights the role that newly emerging players – on particular Brazil, Russia, India, China (BRIC) - play among the other world regions.
This is reflected in the three comprehensive policy packages which were analysed, namely more ambitious policies in OECD countries only; in OECD countries+BRIC or in OECD
countries+BRIC+Rest of the World. These simulations focus on the impact that OECD countries and other countries joining forces, have on environmental policies and related issues. Logically, the benefits of co-ordinated global policies would show in a comparison of these three packages against the Baseline. Equally, trade-offs would show, too.
The detailed design of the Baseline and the three policy packages are addressed in part 2 of this report; the current overview highlights the results. In a nutshell, these policy packages address a specific set of issues, namely:
agricultural liberalisation •
climate change policies •
air pollution •
sewage treatment •
with the ambitions summarized in Table 1.1. A number of other, individual policy simulations was undertaken for the outlook report and are reflected in the relevant chapters of the report accordingly. This background report focuses on the Baseline and the three policy packages analysed; of the individual simulations only those on climate policy are presented.
Obviously, the issues above are only a selection of the issues reported in the main report. For example, biodiversity protection or water use are not addressed in the policy packages exam-ined, although the Outlook finds that in these areas urgent action would be required.
1.1.2 Global results
What difference will it make if OECD countries and other significant players join forces? To which kind of issues is this essential? What can be achieved, for example, by simultaneous liber-alisation of trade in agricultural products, as well as worldwide climate policy? Much depends on timeliness and ambition level, exact agreements and concrete implementation. Undoubt-edly, different perspectives exist on which principles are primarily applicable to such a package and on its format and effectiveness. The example of combining trade liberalisation and climate change policy is already characteristic of one specific perspective, namely the logic of globali-sation -- in terms of economic and environmental policies. With these limitations in mind – a
limited set of issues; contingency upon details; and the existence of very different perspectives – the results of the analyses can be read as follows.
The global participation policy package sees a strong decrease in the emission of greenhouse gases. By 2030, as shown in Figure 1.1, the effect would be almost twice as large as it would be if only OECD countries implement the measures. The largest step comes with the participation of BRIC. By 2050, participation of the rest of the world will have helped to decrease emissions significantly, but even then the largest difference is created by BRIC participation. The effect of action in OECD countries is a basic ingredient in all three cases and remains by far the largest. Obviously, as explained in part 2, the level of carbon tax and when it starts (e.g. 2012 or 2030) determine how large the emission reduction will be. However, at a tax that gradually increases from US $25 per ton of carbon dioxide, the decrease in emissions is not enough to limit greenhouse gas concentrations at 450 ppm carbon dioxide equivalents, one of the most ambitious limits being discussed internationally.
Emissions of classical air pollutants can be considerably decreased. The health damage avoided by these measures makes them cost-effective, in the sense of cost-benefit analysis. This applies even in regions that are already advanced in control of air pollution. Among other things, the
Table 1.1 Overview of environmental policy packages for integrated analyses
pp OECD pp OECD+BRIC pp global
Agriculture Baseline Baseline plus agricultural
liberalisa-tion between OECD and BRIC. Subsidies and tariffs are reduced by 50% by 2030: starting in year 2010, decreasing by 3% per year. This is applied to import tariffs and export subsidies between countries of OECD and BRIC (bilateral) as well as input, output and factor subsidies within OECD and BRIC countries (unilateral).
Baseline plus global agricultural liberalisation.
Same as pp OECD+BRIC but applied to import tariffs and export subsidies between all countries and input, output and factor subsidies in all countries
Climate change Carbon tax in OECD countries,
starting at US $ 25 per ton of carbon dioxide and increasing 2.4% per year. Starting in 2012.
Carbon tax in OECD and BRIC, starting at US $ 25 per ton of carbon dioxide and increasing 2.4% per year. OECD countries start in 2012. BRIC starting in 2020.
Carbon tax in OECD, BRIC and ROW starting at US $ 25 per ton of carbon dioxide and increasing 2.4% per year. OECD countries start in 2012. BRIC starting in 2020. ROW starting in 2030.
Air pollution Development towards but not
quite reaching Maximum Feasible Reduction(as defined in Cofala et al., 2005) in OECD countries. Onset and speed differentiated by region (26 regions) and sector (Transport; Power, Refineries and Industry; Domestic and other.) Phased decrease of sulphur dioxide emissions from marine shipping.
Same as pp OECD but applied in BRIC as well.
Some countries reach target level after 2030.
Same as pp OECD and pp OECD+BRIC, but applied worldwide.
Some low income countries reach target level long after 2030.
Water quality1) Installing sewage treatment on new
and existing sewerage systems. For existing sewage treatment, upgrad-ing the treatment to the next best level in terms of removal of nitrogen compounds.
Same as pp OECD but applied in BRIC as well.
Same as pp OECD and pp OECD+BRIC, but applied worldwide.
1): The simulations assume that (i) access to improved sanitation will develop according to the Baseline and that (2) in the country groupings included in the policy package, the gap between the 2000 situation and a target of access to improved sanitation and/or access to public sewerage for all urban dwellers would be halved by 2030.
outlook policy simulations assumed the introduction of measures in those sectors in which action will become cost-effective during the scenario period, such as in marine shipping. It is also assumed that present low-income countries will not enhance their air pollution policy until their GDP per capita has grown above a certain minimum, later this century. Figure 1.2 shows the decrease of sulphur dioxide emissions. Following the design of the simulations, the decrease in sulphur dioxide emissions by 2030 is by far the largest in OECD countries. Comparing global totals (the right hand group of bars in each chart) between the three policy packages shows that participation by BRIC and the Rest of the World each add a further step of roughly same order of magnitude to the decrease of global sulphur dioxide emissions. The 2050 chart shows the pattern by the time the policy package would have its full effect in most regions. Then, sulphur dioxide emissions are approximately 85% less than they would have been under ‘no new poli-cies’ conditions. While these air pollution policies are cost-effective in themselves, combining them with climate change policies in the global policy package results in an additional benefit. Liberalisation of agricultural production and trade without specific biodiversity policy does not reduce the rate of biodiversity loss for the world as a whole. Most importantly, the deteriora-tion of terrestrial biodiversity in the Baseline remains at least as steep as it has been over the past decades. In particular, the enhanced growth of agricultural areas outside the current OECD countries is an important factor. Relative to the decline in the Baseline, the policy simulations reveal only small differences. For example, Figure 1.3 shows a slightly less steep deterioration of worldwide biodiversity by 2030, compared to the Baseline. This slight improvement reflects
OECD BRIC ROW World
-40 -30 -20 -10 0 10 % pp OECD pp OECD+BRIC pp global 2030
Greenhouse gas emissions compared to baseline
OECD BRIC ROW World
-40 -30 -20 -10 0 10 % 2050
Figure 1.1 Emissions of greenhouse gases, difference with the baseline
a small shrinkage of OECD agricultural area, resulting from the global policy package. However, even this is probably an overestimation. An increase in natural areas in OECD countries typically leads to an improvement in biodiversity but only after a couple of decades, while the decrease elsewhere has immediate effect. By 2050, the difference between the policy packages and the Baseline has become negligible.
In the Outlook, the nutrient load exemplifies the pressure on aquatic ecosystems. Figure 1.4 shows the effect of the policy package, expressed as changes to the load of nitrogen compounds at the river mouth. This load is mostly caused by agricultural activities and sewage. In the policy package analysed here both factors increase outside the present OECD countries. In the Rest of the World group, even additional sewage treatment cannot keep up with the Millennium Devel-opment Goals-related drive to provide more people with improved sanitation and access to sewerage.
The aggregate economic cost of implementing the global participation policy package would be relatively low. On average, it is expected to reduce global GDP growth by about 0.02% per year up to 2030. This would mean a cumulative 1.2% loss in gross GDP up to 2030. In other words, instead of realising the projected 98.5% in growth under the Baseline, the growth in GDP would be 97.3% between 2005 and 2030. These calculations have taken into account the effect of measures on trade and agriculture; mitigation of greenhouse gas emissions; and air pollution.
OECD BRIC ROW World
-100 -80 -60 -40 -20 0 20 % pp OECD pp OECD+BRIC pp global 2030
SO2 emissions compared to baseline
OECD BRIC ROW World
-100 -80 -60 -40 -20 0 20 % 2050
Figure 1.2 Emissions of sulphur dioxide, difference with the baseline
OECD BRIC ROW World -1 0 1 2 % points MSA pp OECD pp OECD+BRIC pp global 2030
Biodiversity compared to baseline
OECD BRIC ROW World
-1 0 1
2 % points MSA
2050
Figure 1.3 Remaining terrestrial biodiversity, difference with the baseline
OECD Environmental Outlook modelling suite, final output from IMAGE cluster (005x_oec08)
OECD BRIC ROW
-20 0 20 40 60 80 % baseline pp global Change in river nitrogen load, 1970 - 2030
Figure 1.4 Load of nitrogen compounds on fresh water ecosystems, difference with the baseline
In reality, these losses might be counter-balanced to some extent by the social welfare improve-ments arising from the global participation policy package, such as improved environmental and health conditions. However, these effects were not monetized in the analyses.
These examples illustrate that the combination of economic and environmental globalisation, although logical in itself, will require additional policies. Liberalisation of agricultural produc-tion and trade, such as a decrease of subsidies and removal of tariffs, is an attractive component of this combination. But agricultural liberalisation in particular, requires additional – ‘flanking’ - policy in order to realise expansion of production in BRIC and the Rest of the World. This policy should be aimed at mitigating the cost to biodiversity – by a fast expansion of agricultural areas or by increased use of nutrients and pesticides. Water use in agriculture is another example of this.
1.2
Environmental impacts of Baseline and policy packages, by region
The Baseline and policy packages impact the various regional groups in different ways. This section shows important differences and similarities, which are important in appreciating the case for international collaboration.
Table 1.2 provides a synthetic overview of the environmental impacts on the thirteen regional clusters, under of the conditions of the Baseline and the three comprehensive policy packages. In the Outlook itself, this information is rather fragmented because of the theme/instrument oriented chapter structure. Box 1.1 describes the method used to arrive at this overview.
OECD BRIC ROW World
0 20 40
60 thousand US$ (2001 US$) 2000
2050 baseline pp global GDP per capita
Figure 1.5 GDP per capita
The climate policy component in the policy packages on which Table 1.2 is based, is the US $ 25 per ton carbon tax. As discussed in Section 2.3.4, this is not enough to mitigate the increase in radiative forcing. Mitigating the increase will require measures on the scale of the 450 ppm multigas stabilisation case, as is described in the same section in the Outlook. Note that the rating in the table considers the change and rate of change in mean temperature only.
Atmosphere
The impact of air pollution on human health is reduced under the policy packages –from orange to green in OECD regions and from red to orange, elsewhere. In many parts of the world outside OECD, air pollution policies have to row against the tide of urbanisation and ageing when attempting to effectively reduce health impacts. In Eastern Europe, Central Asia, Other Latin America and Africa, little difference is visible between the Baseline and policy packages. However, this is only a matter of time: the policy simulations project decreasing emissions in those regions, later this century.
From the global perspective of the Outlook, the development of air pollution policies and their impact over this century begins to resemble that of climate policies – which makes it more attractive to study co-benefits.
Nutrient load
Typical of non-OECD regions, the improvements in treatment of sewage are not enough to keep up with the increased access to sanitation and connection to sewerage. This problem is foreseeable for the Baseline but also in the case of acceleration of environmental policies. At the same time, an even larger load of nutrients originates from agriculture. As a result, for the regions Other Asia and Africa, a marked deterioration of the nutrient load on aquatic systems is projected precisely under the conditions of a global environmental policy package.
Terrestrial biodiversity
The policy packages do not foresee specific policies aimed at protecting biodiversity, like measures to keep agriculture compact; expansion and interconnection of protected areas; or revenue-sharing arrangements of protected areas in low-income countries. Therefore, no change is anticipated in the rate of decrease of terrestrial biodiversity.
Land use
Under the no new policies Baseline, human land use increases in most regions. This is, in part, due to the urban sprawl and conversion of landscapes everywhere, but mainly because of agricultural land use. The two policy packages involving BRIC anticipate an even faster expansion of land use in regions such as Brazil and Other Latin America. This is due to liberalisation of agricultural production and trade, causing the production to increase with a preference for low-income countries where land is cheap. The development in North America shows by and large the mirror image.
Fresh water
Under the no new policy conditions, water stress is projected to increase strongly in precisely those regional clusters that are vulnerable to this additional strain. As these projections looked ‘only’ to 2030, the modelling does not yet show effects of climate change on water availability a scale that would influence the results. The policy packages influence this projection only marginally, indirectly through changes in size and agricultural location and, eventually, through
some mitigation of climate change. Therefore, without incentives to use water much more efficiently, especially in agriculture, the regional pattern of deteriorating water stress will develop unchecked.
Original forests
The overall pattern of loss of original forest is driven by agricultural developments. Because of this, the policy packages involving BRIC feature a red traffic light for Brazil, instead of amber as in the Baseline. This reflects side-effects of the reform of agricultural tariffs, as explained under ‘land use’.
The pattern across issues and regions
(1) Trade-offs are real and need further exploration. One example featuring in this table is the connection between trade liberalisation, agricultural technology and protection of biodiversity. A possible implication is that policies on agricultural technology and biodiversity protection form a necessary ingredient for liberalisation of agricultural production and trade.
Also, there is the connection between improving access to better sanitation worldwide and waste water treatment that has to keep up with expanding connections to public sewerage. Failure to do so will result in steep increases in the loading of pollutants on ecosystems and in public health risks. In relation to this, a certain proportion of investments in better sanitation should be earmarked – or added – in order to boost waste water treatment, as well.
(2) Environmental goal-setting needs to be ambitious. In fact, relative to a benchmark of climate stabilisation at global mean temperatures not much more than two degrees Celsius, all of the broad policy packages fall short. But the more ambitious 450 ppm multigas stabilisation case does go in this direction.
(3) Inertia is a factor to be reckoned with. It is the common factor that makes the rows in
Table 1.2 look so similar, even between the Baseline and the global policy package. When focusing on impact (such as climate change) rather than pressure (such as emissions) the slowest element in the chain is highlighted. At the end of the chain all delays accumulate: from the time needed for education, replacement of capital stock and year after year improvements in resource efficiencies, to the longevity of some human-induced changes to the environment.
The delay between action and result surely is a political handicap. It is also a key reason to prioritise those actions that deal with durable infrastructure and capital goods, such as city layout, power plants or the fishing fleet, and seize opportunities arising through the current dynamic development of the BRIC economies.
(4) The difference between the issues also highlights a need for policies that address some issues head-on. For example, without explicit protection, biodiversity will keep on deteriorating at the current rate or even faster. Also, without policies targeted at agricultural water use, problems of water stress will only become more serious.
NAM EUR JPK ANZ BRA RUS SOA CHN MEA OAS ECA OLC AFR World Climate change
Temperature change and rate of temperature change Baseline pp OECD pp OECD + BRIC pp Global 450 ppm Atmosphere Excess mortality attributable to urban air pollution by PM10 Baseline pp OECD pp OECD + BRIC pp Global Nutrient loading Agricultural nitrogen losses and nitrogen load at river mouths
Baseline pp Global Biodiversity Mean Species Abundance Baseline pp OECD pp OECD + BRIC pp Global Land use Change in agricultural land area Baseline pp OECD pp OECD + BRIC pp Global Fresh water Population living in areas under severe water stress Baseline pp Global Forests Change in natural forest area Baseline pp OECD pp OECD + BRIC pp Global Legend
increase of a large problem in the context of internationally articulated objectives intermediate situations, including hotspots or situations getting worse before getting better significant decrease in problem
inconclusive
OECD Environmental Outlook modelling suite, final output from IMAGE cluster
For definitions of Baseline and policy cases see part 2 (Baseline), Table 1.1 (policy packages) and Table 2.20 (450 ppm multigas) (164t_oec08)
The ‘traffic light’ table presents a simplified synopsis of the regional impacts of the Baseline and of the policy packages that have been analysed for the Outlook, The table compares the Baseline and the three policy packages in terms of the pattern of their regional impacts. It is not meant to provide a concrete predicament of a specific policy package.
The ‘traffic light’ table is the product of a judgmental process, i.e. • Themes were operationalised by narrowing them down to
specific issues. For example, air pollution is assessed using information on premature mortality which is attributable to urban air pollution, with suspended particulate matter smaller than 10 micrometers by 2030, and trends in sulphur dioxide emissions after 2030.
• Estimates for the chosen issues were derived from a visu-alisation system filled with modelling results for the Outlook. These were primarily considered at the level of 13 regional clusters, then checked at the 24 regional levels for the under-lying distribution within regions.
• The projections for the next quarter century were compared to the current trend of a specific issue, to see the degree of change across Baseline and policy packages. Three dimen-sions were taken into account..
- First off, most weight was given to the change in environ-mental pressures between now and 2030 (direction and rate of change).
- Secondly, the 2030 and 2050 levels of environmental pressure were considered: would they come anywhere near to targets discussed in the Outlook?
- Thirdly, a more detailed check was carried out. Spatially, by checking for important hotspots within a regional cluster (by looking at the underlying results of the environ-mental modelling in terms of 24 regions), and temporally: would the situation become significantly worse before getting better? If such hotspots or bumps in time were indicated, then the traffic light score could never be higher than amber.
• For themes that feature particularly large delays between changes in driving forces and environmental impacts such as climate, developments have been considered for the next half century rather than for the next quarter century.
• The table depicts environmental impacts as changes towards the end of the causality chain: health impacts, biodiversity impacts and the like.
• The table highlights differences and similarities between regional impacts. In addition, a ‘world’ column has been included to provide an overview of the impacts on a global scale. • For some issues, such as climate change, the out-come of the model based analysis directly shows a relevant impact on the world as a whole.
• For other issues, such as for population living in areas with water stress, the signal in the ‘world’ column is a weighted average of the regional signals.
• For biodiversity, the remaining mean species abundance was considered rather than the decrease. Considering the de-creases would not have differentiated between the cases that were investigated, partly because of the inertia of the natural system.
• For urban air pollution, the modelled health impacts up to 2030, as reported in part 2, were considered. In order to differentiate in BRIC and the Rest of the World, the trends in 2030-2050 in emissions of sulphur and nitrogen oxides were weighted in.
• Generally, a red signal shows an increase of a large problem in the context of internationally articulated objectives. An amber signal shows either improvement or deterioration of the problem, and a green signal reveals a significant decrease in the problem.
• The amber lights in the table span a range of intermediate situations, hiding the differences. For example, projections of water stress tend to come with wide intra-regional variations but were often allocated an amber traffic light for the region as a whole. Or, decreases in original forest cover of 200 and 250 thousand square kilometers in North America were both allocated an amber traffic light.
Part 2: Detailed findings
Part 2 of this report describes some detailed outcomes of the OECD Environmental Outlook process that were not included in the main report. Outcomes of the analysis of the Baseline are in chapter 2.1, while chapter 2.2 deals with the policy simulations. As the focus is on environ-mental analysis, the description of the population and economic Baseline has been kept shorter than in the outlook main report. The regional classification can be found in Annex 1.
2.1
The Baseline
By design, the Baseline is a no-new policies scenario. It imagines the world developing over the next decades largely as it does today, without new or intensified policies in response to the projected developments.
The Baseline assumes that many aspects of today’s world remain the same – not frozen in time, but evolving along the same lines as today. Population and income are projected to increase, and diet preferences, mobility demand and other consumption preferences keep shifting and increasing with income in the same way as in the past decades.
By implication, the Baseline is not the most plausible future development. It is likely that deci-sion makers in governments and elsewhere will react to all sorts of developments, including the environmental trends described in the Environmental Outlook, and that the Baseline trends will never show in reality. The Baseline is thus only a benchmark for comparison. The purpose of a well-described Baseline is to identify the need for new policies in certain areas, and to provide a background for assessing the effect of new policies.
Although the Baseline shows an continuously increasing burden on the environment, the models used behave as if the projected quality of the environment would not disturb demographic and economic development. In modelling terms: there is no feedback from environmental pressures onto economic and social development.
Because the purpose of the Baseline to support a discussion that centers on policy options and possible alliances, rather than on the merits of the Baseline, it has been aligned as much as possible with authoritative thematic projections (as for population, energy, agriculture) and long-term historic series (in particular long-term growth rates of labour productivity). Refer-ences are included in the discussion.
As the focus is on environmental analysis, the description of the Baseline for population and aggregate economic development has been kept shorter than in the outlook main report.
2.1.1 Population and economic developments Population
The Baseline uses the medium population projection of the United Nations, which shows a stabilisation of the world population at around 9.1 billion inhabitants by the middle of this century (UN, 2005). Almost all of this increase will be in the developing countries. (See
development. It is already apparent in OECD countries, but will show its effects in the develop-ing countries in the comdevelop-ing decennia – quite soon in China. Without policies, agedevelop-ing of the population leads to a decrease in labour participation and an increased economic burden on the working segment of the population.
The medium population projection of the United Nations is a middle-ground scenario with 8.2 billion people in 2030, compared to the extremes of the IIASA probabilistic population projections, that range between 7.7 and 8.8 billion in 2030 (Lutz et al., 2004).
2.1.2 Economic developments Points of departure
At the level of generality and the time horizon of the outlook, the following three factors are considered as the long-term determinants of growth in economic activity for each region. For each of these, a time-path was developed that reflected convergence (as per Sala-i-Martin, 1996) and the notion of ‘no new policies’.
labour force •
labour productivity – influenced by skills and production technology •
trade. •
The Baseline does not incorporate feedbacks of the projected environmental changes on regional economies
However, the projections of the two main forms of resource use linking economy and environ-ment, energy use and land use, are realistic in the sense that they do take into account scarcities by region and fuel type and land type.
1970 1980 1990 2000 2010 2020 2030 2040 2050 0 2000 4000 6000 8000 10000 million ROW BRIC OECD Global population, baseline
Figure 2.1 World population, baseline
In particular for the economic Baseline, ‘no new policies’ is very different from ‘policy-free’. It means no policy initiatives that bring important changes to the dynamics of economic development.
In fact, the Baseline projects for the next half-century a world that is very similar to today’s in factors such as the role and size of government, policy priorities, taxes, technology diffusion, intellectual property rights, liability rules and resource ownership. Hence ongoing technological change will impact on the economy in much the same way it has in the past.
It is also similar to today’s world in terms of dietal preferences, mobility demand and other consumption habits for given income levels. Since incomes in developing countries will change, there will be some change in consumption patterns, but in a manner that will make them look more like today’s developed countries.
Labour force
Labour force participation in OECD countries is assumed to follow past trends while in non-OECD countries it was assumed to converge slowly to the OECD average of 60 per cent. (Labour force participation is the percentage of the adult population that considers itself part of the labour force – i.e. works or is looking for work.) The assumed convergence is slow, at a rate of one per cent gap closure per year in the direction of the OECD average.
Taken together, the population and participation rate projections lead to increases in the labour force of 10, 27 and 50 per cent in OECD, BRIC and ROW, respectively, between 2005 and 2030. Here, the assumptions for the labour force are a challenge to reconcile with the ‘no new policies’ character of the Baseline. UN population projections estimate the most probable development. For some regions, this implies new polices on health care, education and migration. Similarly, participation in the labour market is a policy rich field. Government policies are thought to have
1970-2000 2000-2030 2020-2050 % North America 43 27 15 OECD Europe 17 5 -2 OECD Asia 27 0 -11 OECD Pacific 44 26 18 Brazil 72 34 15
Russia & Caucasus 15 -13 -16
South Asia 79 33 15
China region 47 14 -2
Middle East 156 74 42
Other Asia 84 49 26
Eastern Europe & Central Asia 29 3 -7
Other Latin America & Caribbean 74 43 21
Africa 120 85 57
World 61 35 20
Note: overlapping 30-year periods: 2000-2030 and 2020-2050
added to downward trends in labour force participation in OECD countries. Thus, the assumed slow trend towards the current OECD average may in some regions involve new government policies for example on pensions, child care facilities, lifelong learning and migration.
Nonetheless, since these policies are largely uncorrelated to environmental policies and issues of the type being discussed in this report, the ‘no new policies’ rule remain valid.
Labour productivity
The central assumption is how of labour productivity in each region will change over time. Labour productivity quantifies how much more goods and services a worker generates per unit of time. The assumption is that gradually, over the first three to five decades of this century, the annual changes in this variable in all regions will start to move in the direction of – not necessar-ily attaining - the long-term average in industrialized countries.
Countries slowly converge to that rate by closing the growth rate gap by 2% per year (implying that half the gap is closed in about 35 years). The process of moving toward growth conver-gence occurs in two stages: (i) moving from current productivity growth rates to the average for 1980-2001 (this is largely completed by 2015) (ii) then moving to the 1.75% growth target, by closing the growth rate gap by 2% per year. In other words, a country whose productivity is growing at 5% at the beginning of the convergence process will grow at 4.94% in the following year, 4.87% the next year, and so on.
This long-term benchmark is taken at 1.75 per cent per year. It has been gleaned from time series over the two past centuries (Maddison, REF; Crafts, REF) and is thus meant to capture the productivity effect of technological transitions even if they are as large and important as the introduction of electric power, the motor car, antibiotics and ICT. At the most general level, two evident assumptions are institutional stability in most countries and unspecified but continuing technological progress.
Sectoral productivity is differentiated in the same way, for each region. This leads to shifts in sectoral composition over time, with the familiar pattern of stronger growth in the service sectors than in for example agriculture. Thus, by 2030 or 2050 the weight of agriculture vis a vis the other sectors in most economies will be less than today. But importantly to the environment, this only means that the value added of – in this example – the service sector has increased more than that of agriculture. It does not necessarily mean that the activity in agriculture in that region will shrink in physical terms. In most regions, it will not.
Although the assumption of ongoing improvement in production technology is fundamental to the projected rates of labour productivity improvement, this assumption is purposely general. Specification in terms of technology developments that influence environmental implications has been entered in subsequent stages of the analysis. For example, the mix and efficiency of energy production technologies, or the extent of irrigated crop area. These specific technology developments in the Baseline are described in the sections of this report that focus on environ-mental implications.
Trade
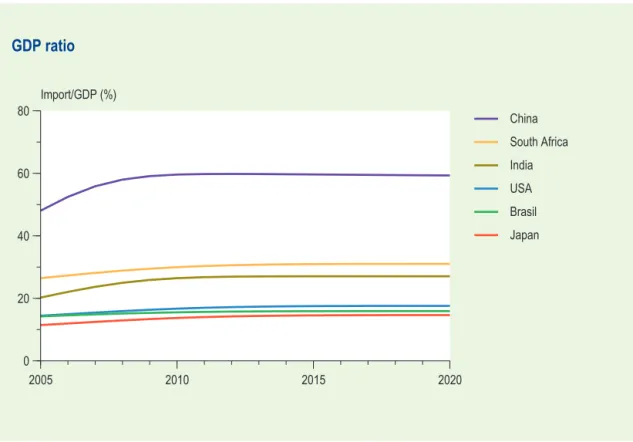
In most regions, imports and exports have grown faster than the regional economy in general, as measured by GDP. To the extent that this is the result of explicit policies on tariffs and quota, the Baseline assumes no new policies and therefore a gradual leveling off of the rate of trade growth. Thus, eventually, the Baseline features trade growing at just the same rate as the
economy in general. This is visualized in Figure 2.2, depicting imports relative to GDP for the three regional groupings of the outlook.
In contrast to the Baseline, new policies on agricultural trade (a ‘new Doha round’) are included in the outlook as part of its broad policy packages.
Not all impediments to trade are directly and explicitly driven by policies. In particular, changes in transport and communication costs are important while not directly determined by trade poli-cies. In order to investigate the effect of changes along this line, a variant to the Baseline has been analysed (see below).
Aggregate economic activity
The economic undercurrents of these three trends combine to produce a seemingly modest, but uniformly positive growth in real GDP for the world as a whole under Baseline conditions. The global average is would be 2.8 per cent per year between 2005 and 2030. China and India would see growth rates of 5 per cent per year averaged per over the whole period (from approximately seven per cent per year in the first years to approximately four per cent during 2020-2030).
Figure 2.3 and 2.4 show the resulting levels of GDP and GDP per capita.
The graphs show that the BRIC group, notwithstanding its strong and sustained growth, remains at a large distance from the OECD average in terms GDP per capita. By and large, this implies a similar distance for the average standard of living in this regional group.
Figure 2.4 shows that the increase in GDP per capita is especially fast in Russia, China and India. Details are given in chapter 3 Economic Development of the Outlook main report.
2005 2010 2015 2020 0 20 40 60 80 Import/GDP (%) China South Africa India USA Brasil Japan GDP ratio
Figure 2.2 Imports in proportion to GDP, baseline
Sectoral shifts
The resulting changes to the sectoral composition of the economies, in very broad terms, are shown in Figure 2.5. Overall, there is an especially large growth in value added of services as well as industry.
The chart is in value terms, not in terms of a percentage of GDP. This is to underline that whereas the significance of sectors like agriculture will decrease in relative terms, their value-added in constant dollars might well increase. For example, in Figure 2.5, see agriculture in the OECD Pacific cluster (ANZ), Russia and Caucasus (RUS) as well as in the world total.
Variants
Against the background of a wider notion of uncertainties for the outlook, the following key uncertainties have been identified in the three driving forces of the economic Baseline. • Active labour force: a relatively large uncertainty was identified here, given that the UN
population projections come with substantially wide confidence limits (+/- 7 per cent by 2030, as well as uncertainty about subnational differences) and statistics on current participa-tion rates are problematic for important parts of the world.
Rate of labour productivity increase:
• two variants have been explored, namely with
conver-gence benchmarks of 1.25 and 2.25 per cent per year instead of 1.75.
• Trade development: a variant was explored assuming a continued decline in impediments to trade such as transportation and communication costs and border delays. (The Baseline assumes that in the next decades the decline in these factors will level off.) This variant is designated as the globalisation variant.
2000 2010 2020 2030 2040 2050
0 20000 40000 60000
80000 billion US$ (2001 US$) OECD
BRIC ROW Gross Domestic Product, baseline
Figure 2.3 Gross Domestic Product, baseline
Lat but not least, a variant was explored for the recent history to which the Baseline is grafted. The Baseline evolves from growth rates in the 1980-2000 period. In contrast, the variant is derived from five-year growth rates around the year 2000 – for important countries a period of fast growth. It is designated here as the ‘millennium’ variant.
Table 2.2 presents summary results of the variants in productivity growth rate. It clearly shows that the millennium variant has a large effect (a much larger GDP growth, especially in the BRIC group).
The effect of the two alternative benchmarks for labour productivity improvement is much smaller, even though they constitute considerable deviations from the Baseline assumption. Interestingly, between the latter two variants the resulting differences relative to the Baseline are asymmetric. This reflects that in the initial years of the Baseline, connecting to recent trends, rates of labour productivity increase are assumed high in many countries.
The globalisation variant, continued decrease in transportation costs and the like, only increases cumulative GDP growth to 2030 by one or two per cent. However, it does increase the value of international trade in proportion to GDP in almost all regions, typically adding one-third to a half to the Baseline numbers. Assumedly, China and India would see a lesser or almost no effect, as it is doubted whether the proportion of trade to GDP is can increase much beyond the already high numbers of the Baseline.
Key lessons are the following.
In a no new policies future, the volume of economic activity can be less, but especially much •
more than projected as the Baseline. The latter could happen if productivity trends in the next
1970 1980 1990 2000 2010 2020 2030 2040 2050 0 20 40 60 80
100 thousand US$ ppp/yr (2001 US$) USA
OECD Europe Russia China Brazil India GDP per capita in purchasing power parity, baseline
Figure 2.4 Gross Domestic Product per capita in purchasing power parity, baseline