The EURURALIS study: technical document
215
0
0
Hele tekst
(2) 2. Alterra-rapport 1196.
(3) The EURURALIS study: Technical document. J.A. Klijn L.A.E. Vullings M. v.d. Berg H. van Meijl R. van Lammeren T. van Rheenen A.A. Tabeau A. Veldkamp P.H. Verburg H. Westhoek B. Eickhout. Alterra-rapport 1196 Alterra, Wageningen, 2005.
(4) ABSTRACT Klijn, J.A., L.A.E. Vullings, M. v.d. Berg, H. van Meijl, R. van Lammeren, T. van Rheenen, A.A. Tabeau, A. Veldkamp, P.H. Verburg, H. Westhoek & B. Eickhout, 2005. The EURURALIS study: Technical document. Wageningen, Alterra, Alterra-rapport 1196. 215 blz.; 60 fig.; 15 tab.; 122 ref. EURURALIS is developed for policy makers dealing with the future of agriculture and other land use in the enlarged Europe of 25 member states. Expecting that major developments affect the rural areas in Europe pro-active rural policy has to be informed timely and in a targeted and crispy way. A scenario study was launched that built upon : I) recognizable and internationally authorized scenarios encompassing drivers such as global developments like world trade, climate change, demography, II) predicted transformations in land use (area, regions, intensity), III) impacts on the various domains of sustainability (People, Planet, Profit) and IV) possibilities of policy instruments. The study builds upon IPCC and related scenarios, though adapted for our goals, a global economy model (GTAP/LEITAP) linked to an environmental model (IMAGE) and thirdly a land use allocation model (CLUE). Modelling outcomes were generated for 30 years in 10 year time steps; indicators were selected from economical, socio-cultural and environmental/ecological domains respectively. Meta-indicators were added to offer overview. The product is tuned to non-specialists and offers many graphs, maps and texts for easy use in policy, research and education. This background document aims not to deliver the contents of the CD Rom in a hard copy version, but focuses on policy context, leading concepts, methods and data. It also offers discussions on desired improvements and ways to expand the current 1.0 version.. Trefwoorden: scenarios, driving forces, sustainable development, indicators, policy orientation, land use models ISSN 1566-7197 This report can be ordered by paying € 20,- to bank account number 36 70 54 612 by name of Alterra Wageningen, IBAN number NL 83 RABO 036 70 54 612, Swift number RABO2u nl. Please refer to Alterra-rapport 1196. This amount is including tax (where applicable) and handling costs.. © 2005 Alterra P.O. Box 47; 6700 AA Wageningen; The Netherlands Phone: + 31 317 474700; fax: +31 317 419000; e-mail: info.alterra@wur.nl No part of this publication may be reproduced or published in any form or by any means, or stored in a database or retrieval system without the written permission of Alterra. Alterra assumes no liability for any losses resulting from the use of the research results or recommendations in this report.. 4. Alterra-rapport 1196 [Alterra-rapport 1196/juli/2005].
(5) Contents. Preface. 11. Acknowledgements. 13. Summary. 17. 1. Introduction: 1.1 Background 1.1.1 Europe in space and time: a diverse and dynamic continent 1.1.2 Imminent changes: threats and opportunities 1.1.3 Policy making and the role of research 1.2 Aims, character and steps of the EURURALIS study in short 1.2.1 Discussion support rather than decision support 1.2.2 EU- 25 coverage; a broad spectrum of issues 1.2.3 Rural areas at the centre, but not without urban areas 1.2.4 Sustainable development as guiding principle 1.2.5 Long-term perspective combined with shorter time steps 1.2.6 Existing data, scenarios and methods : added value in combining data and insights 1.2.7 Role of an interactive model 1.2.8 Target Goup Policy makers; policy context 1.2.9 EURURALIS in a simple flow diagram. 29 29 29 30 31 32 32 32 33 33 33. Basic concepts and tools 2.1 Introduction 2.2 A simple DPSIR approach: The distinction of Driving Forces, Pressures, States, Impacts and Responses (DPSIR) 2.3 Selftest: from personal intentions to scenario comparison 2.4 The scenario-approach 2.5 Sustainability: PPP-aproach 2.6 Choice of Indicators 2.7 Interface 2.7.1 Interfaces 2.7.2 Eururalis interface definition. 36 36 36 38 43 43 44 46 46 48. Scenarios 3.1 Eururalis scenario set-up 3.2 Roots of the scenarios 3.2.1 The overall view 3.2.2 Short story lines per scenario 3.3 Characteristics 3.3.1 Time paths. 51 51 52 52 53 55 55. 2. 3. 33 34 34 34.
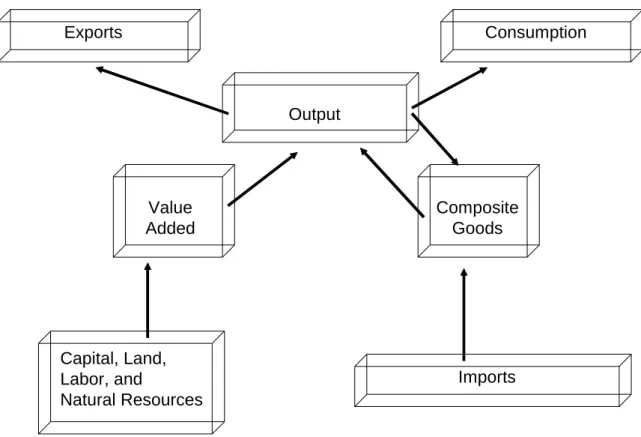
(6) 3.3.2 Not a la carte policy choices 3.3.3 Careful presentation 3.4 Further elaboration of the scenarios 3.5 Different views on sustainability. 55 55 57 58. 4. Models and data 61 4.1 General framework 61 4.2 LEITAP (adapted version from GTAP) 62 4.2.1 Global Trade Analyses Project: The standard Model 63 4.2.2 Extensions to the standard GTAP model: 67 4.2.2.1 Land allocation under the heterogeneity of land assumption:67 4.2.2.2 Variability of total area 68 4.2.2.3 Yield and feed conversion: Linkage with IMAGE 70 4.2.2.4 Feed conversion in livestock 71 4.2.2.5 Feed demand in food processing industry 72 4.2.2.6 Segmentation of factor markets and endogenous production quota 72 4.2.2.7 Agricultural production quotas 73 4.2.3 Projection methodology 73 4.2.4 Data 75 4.2.5 Policy assumptions and their implementation 76 4.2.5.1 Enlargement and Free Trade Areas (FTAs) 76 4.2.5.2 Decoupled payments implementation 76 4.3 The IMAGE model 77 4.3.1 Introduction 77 4.3.2 Background of the IMAGE model 77 4.3.3 Link with scenarios 78 4.3.4 Land-use change 79 4.3.5 Linkage between LEITAP and IMAGE 81 4.3.6 Linkage between IMAGE and CLUE 82 4.4 CLUE 83 4.4.1 Introduction and background 83 4.4.2 Technical outline CLUE 83 4.4.2.1 Non-spatial module: land use requirements 84 4.4.2.2 Spatial module: land use allocation 86 4.4.2.3 Calibration and Validation of LUCC models 92 4.5 Discussion on methods; calibration/validation 93 4.5.1 Scenarios 93 4.5.2 Core models 94 4.5.3 Other models and "rules of the thumb" 95 4.5.4 Data 95 4.5.5 Concluding remarks 95. 5. Some data on the past and their function in a scenario study 5.1 Drivers, a few examples 5.1.1 Climate change 5.1.2 Population (demographic changes) 5.1.3 Common Agricultural Policy (CAP). 6. 97 97 97 97 98. Alterra-rapport 1196.
(7) 6. 5.1.4 Regional dynamics. 5.2 Indicators 5.2.1 Yield 5.2.2 Income 5.2.3 Employment 5.2.4 Self sufficiency 5.2.5 Animal diseases 5.2.6 CO2 storage 5.2.7 Biodiversity 5.2.8 Land degradadtion 5.2.9 Pollution 5.2.10 Land use. 99 99 99 100 100 100 101 101 102 102 103 103. Simulation per scenario/per time step 6.1 Drivers 6.1.1 Demographic projections 6.1.1.1 Demographic projections for the EU-25 6.1.1.2 Rural population 6.1.1.3 World population 6.1.1.4 CAP 6.1.1.5 Source 6.1.2 Climate 6.1.2.1 Source 6.1.3 Gross Domestic Production (GDP) 6.1.3.1 Source 6.1.4 Trade 6.1.4.1 Source 6.1.5 Production 6.1.5.1 Source 6.2 Landuse change 6.2.1 Comparison of the scenarios 6.2.2 Interpretation of land use change: Landscape impact 6.3 Indicators 6.3.1 Introduction 6.4 People indicators 6.4.1 Employment 6.4.1.1 Source 6.4.2 People: Self-sufficiency. 6.4.2.1 Source 6.4.3 People: Animal Disease 6.4.3.1 Introduction 6.4.3.2 Future risk of spread of contagious animal diseases in livestock 6.4.4 Planet: Nitrogen emission and deposition 6.4.4.1 Introduction 6.4.4.2 Future 6.4.4.3 Source 6.4.5 Planet: Soil degradation and salinisation. 105 105 105 105 106 107 108 109 109 113 113 114 114 115 115 117 117 119 120 121 121 125 125 126 126 128 128 128 129 133 133 133 134 134.
(8) 6.4.5.1 Introduction 6.4.5.2 Future 6.4.5.3 Method 6.4.6 Planet: Biodiversity nature 6.4.6.1 Introduction 6.4.6.2 Future 6.4.6.3 Method 6.4.7 Planet: Biodiversity agriculture 6.4.7.1 Introduction 6.4.7.2 Future 6.4.7.3 Method 6.4.8 Planet: Carbon sequestration 6.4.8.1 Introduction 6.4.8.2 Future 6.4.8.3 Method 6.4.9 Profit: Yield 6.4.9.1 Crop production 6.4.9.2 Livestock production 6.4.9.3 Yield and climate change 6.4.9.4 Source 6.4.10 Profit: Income (agriculture) 6.4.10.1 Future 6.4.10.2 Source 6.4.11 Profit: Expenses 6.4.11.1 Future 6.4.11.2 Source 7. 8. 134 135 135 137 137 137 138 139 139 140 141 142 142 142 144 145 145 145 146 147 147 147 148 148 148 149. Meta-indicators and integrated outcomes 7.1 Introduction 7.2 Meta-indicators 7.2.1 Overall methodology 7.2.1.1 Results of EURURALIS modelling expressed in meta indicators; comparison of goal indicators and modelling results 7.2.2 Hot spots. 151 151 151 151. Conclusions 8.1 Policy recomendations 8.2 Further research 8.2.1 Concepts and methods 8.2.2 Geographical extent, wider coverage of issues 8.2.3 Quality of data, validation of models, sensitivity analysis 8.2.4 The interface. 159 159 160 160 161 162 162. 154 156. Literature/ data. 165. Appendix 1 Descriptions of Scenarios Appendix 2 Specifications of scenarios Appendix 3 Eururalis regions and comprising GTAP regions Appendix 4 Overview of unweighed scores for all EU 25 countries. 175 185 203 209. 8. Alterra-rapport 1196.
(9) Appendix 5 Overview of unweighed scores for EU 15 countries and EU 10 countries 211 Appendix 6 Ranking and score distances 213 Appendix 7 Original priorities 215.
(10)
(11) Preface. The EURURALIS study , version 1.0 , "A scenario study on Europe's rural areas to support policy discussion”, was carried out in 2004 in about 10 months. A number of 58 people, researchers, data processors, software engineers, designers and various others were involved to cover the complex terrain of scenarios, driving forces in- and outside Europe, modelling in a complicated set of models and presenting results in a crispy, digestible and policy oriented application. Taking into account the time frame and the number of people involved, it reveals that such a project was executed in a pressure cooker atmosphere. The tight time frame had to do with the Dutch presidency of the EU in the latter half of 2004 and more specifically the launching of the CD Rom during the meeting of directors rural development of most of the relevant ministries of all member states of the enlarged EU (EU 15 + EU 10) held in Castle Groeneveld (Baarn). The CD Rom contains the essentials of the project insofar interesting for policy makers and others committed to the future of the rural areas in Europe. So far our impression is that the CD Rom draws due attention and seems to fulfil its goals pretty well for policy makers, colleague researcher and for educational goals. This background document tries to give technical information in more depth on policy context, conceptual aspects, scenarios chosen, modelling and the question how to connect various models, the choice of indicators and meta-indicators and eventually recommendations for policy makers and further research. Readers may find the contents rather technical and scientific in nature.We did not bother to compose a very balanced, carefully edited repor. Its primary function is to present basic information on context and concepts, assumptions, modelling specifics and data. It forms the memory of the project. It is advised to interpret this text in direct relationship with the CD Rom, that is more user friendly, visual and colourful. On behalf of the authors, The editors, Jan Klijn Wies Vullings. Alterra-rapport 1196. 11.
(12)
(13) Acknowledgements. The initiative to launch the EURURALIS study was taken within the working group Sustainable Development and Systems Innovation, Wageningen University and Research (In Dutch: Werkgroep Duurzame Ontwikkeling en Systeeminnovatie = DOS. Professor Rabbinge and Professor Bouma paved the path within the Ministry of Agriculture, Nature and Food Security that made funds available . Their interest was enforced by the fact that The Netherlands was chairing the EU during the latter half of 2004. On behalf of the Ministry aPolicy Advisory Group (PAG) was installed to give advice on the policy relevance and presentation mode of EURURALIS. The members of the PAG were: • H.E. van Latesteijn • S. Mager • G. Meester • M.Remmers • J. Bakker • T. Breimer • J.G. Deelen Next to mention is the Scientific Advisory Group (SAG) giving their contribution in designing the project and helping the team in all other ways. The members of the SAG were: • J.M. Boussard (INRA-CIRAD, France) • M. Baranowski (Director UNEP-GRID, Poland) • J. Bouma (Former professor Wageningen UR): chair • R. Rabbinge (professor Wageningen UR) • J. Blom (Deputy director Agricultural Economics Institute (LEI)) • K. van Egmond (director Environmental Assessment Agency (RIVM)) We specially appreciated the effort from Prof. Boussard from France and Dr. Baranowski from Poland to come over to The Netherlands for the meetings helping us to broaden our views. The project has been carried out by a consortium of Dutch research institutes or groups. Many people contributed directly and indirectly to the contents, the working process and the good atmosphere within the project. The Netherlands Environmental Assessment Agency (MNP) of the RIVM took part for their own account, were leading in scenario choices and elaborations, the application of the IMAGE model and various thematic topics. • Land use and climate change: B. Eickhout and T. Kram • Biodiversity: R. Alkemade, T. Tekelenburg and P. Reidsma • Data collection and processing: K. Klein Goldewijk and J. Meijer. Alterra-rapport 1196. 13.
(14) • • • • •. Urbanization: L. Crommentuijn Nitrogen fluxes: H. Eerens and L. Bouwman Demography: H. Hilderink Scenarios: J. Bakkes, M. van den Berg and H. Westhoek Selftest: T. Aalders. A large portion of the work, especially in the domain of the economy, has been done by the Agricultural Economics Institute (LEI). They contributed by integrating the model LEITAP into the chain of models and were responsible for economic and social parameters. • H. van Meijl, A. Tabeau, F. van Tongeren, M. Betgen, T. de Kleijn The Soil Inventarisation and Land Evaluation Group from Wageningen University worked on integrating the model CLUE in the chain of models, the land use chapter of EURURALIS and the hotspot-maps. Moreover many data were centrally stored and processed thanks to their efforts. • Landscape Level Modelling (CLUE) P. H. Verburg, A. Veldkamp, N. Witte, N. Schulp The team of Geo-information and Remote Sensing Group, Wageningen University, did work on data processing and the design and supervision of the developing of the CD ROM application.We mention the following persons • •. Interface: R. van Lammeren Data processing: A. Bergsma, W. ten Haaf. Alterra contributed in specific indicator studies, such as carbon storage, land degradation, biodiversity (together with RIVM), animal diseases (with help from ID lelystad) and agricultural yield. .. The application itself was built by members of the Centre for Geo-Information. Graphical designers were involved in making the CD ROM and booklet. Alterra was also esponsible for the project coordination. • • • • • • • • •. 14. Biodiversity: J. Verboom-Vasiljev; R. Reijnen Carbon sequestration: G.J. Nabuurs, N. Heidema, T. Helmink, P. Kuikman Yield: R. Rötter, K. van Diepen Land degradation: J. Stolte, R. Hessel Animal disease: M. Perez Soba, I. Gies, T. Hagenaar (ID Lelystad, The Netherlands) Data processing: S. Mucher, E. Muller, A. Willemen, J. Clement Design booklet and design figures: J.Klijn,M. Jansen, R. Olde Loohuis, C. Onderstal, J. Wiltink Editorial advice: J. Luttik, J. Stuiver Application development: A. Lamakers, W. de Winter, P. Verwey, T. van de Wal. Alterra-rapport 1196.
(15) • •. Application design: M. Stoker Project coordination: J.Klijn, W.Vullings. Jan Banning, David Viner (UK), Dirk Wascher, Lammert Kooistra and Sander Mucher made relevant photos available to Eururalis. All people involved are gratefully thanked for their contributions on behalf of the. Core team:. Jan Klijn (projectleader) (Alterra) Wies Vullings (Alterra) Maurits van de Berg (MNP - RIVM) Bas Eickhout (MNP - RIVM) Hans van Meijl (LEI) Ron van Lammeren (WUR) Teunis van Rheenen (LEI) Tom Veldkamp (WUR) Peter Verburg (WUR) Henk Westhoek (MNP - RIVM). Alterra-rapport 1196. 15.
(16)
(17) Summary. 1. Introduction. Policy makers on the level of the (enlarged) EU(15+10) as well as on national levels are increasingly apprehensive about future developments in rural areas. These areas occupy 80 % of the total European (EU) area and harbor 105 Million of the total 455 million people (i.e. 23 % of the population). Half of EU 's territory is in agricultural use (fact sheet European Community, 2003).These rural areas are subject to a multitude of transformation processes set in motion by interacting driving forces of various origin (Klijn, 2004). We mention I) the recent enlargement of the EU bringing about a larger internal market and the challenge to bridge socio-economic differences between older and newer member states, II) the ongoing world trade liberalization affecting all economic sectors but especially the agri-food sector that gradually will loose its market protection and export subsidies, III) current or imminent demographic changes (stagnation or even decline in number, aging and/or migration from rural to urban areas) and IV) global change (climate and climate related phenomena; IPCC, 2001; Watson et al., 2000). Other relevant processes (urban and infrastructure developments) act more locally or regionally, but are meaningful (UNEP, 2002). All these long-term and large scale processes embody threats as well as opportunities for socio-cultural, economic and ecological values in rural areas and their communities. One notices that the full spectrum of sustainable development aspects (People, Planet, Profit) is at stake, including the abundant interactions acting between them. Whereas many processes are long term affairs and often hard to correct by policy measures politicians need to act in an anticipative or "pro-active" manner and from an awareness of the most effective ways to intervene. Therefore they need to be informed timely on what will or could happen and on what could be done to minimize risks and to stimulate promising developments. The role of science is to deliver conceptual support, methods, insights and data. This should include notions of unavoidable uncertainties regarding future developments. What will happen during the forthcoming three decades set as the time horizon for our study is hard to predict in view of unknown mechanisms and even intrinsic uncertainties. The only scientifically defendable way to support policy makers in discussions and decisions is to sketch what could happen, assuming (changes in) preconditions that differ in nature, course, rate, duration or place. That is where scenario methods come in, helping to depict future situations according to some contrasting world visions and related story lines accompanied by "what - if " questions if a certain course of events is imagined. So-called explorative scenarios help to delineate the margins of the "possible and conceivable". (An example of a scenario study that proved to exert "shock effects" on politicians and stakeholders was the study by the WRR (1992) titled "Ground for choices", indicating that agriculture in Europe could do with an enormously smaller area if practiced at a much higher level of efficiency. It made visible that 40 - 80 % of the cultivated land. Alterra-rapport 1196. 17.
(18) could become redundant when highly efficient farm management was taken as main entrance!). The role of contrasting explorative scenarios is to make explicit what the alternative assumptions, beliefs and attitudes are and how they diverge in outcomes. To assess various effects simulation models or sometimes simple "rules of the thumb" are used. Their role is to incorporate cause - effect relationships and interactions in a transparent manner and to deliver outcomes that either can confirm or deny the various expectations or desires. The latter adds to self reflection among participants on their presumptions and fuels debates on policy goals and instruments. That is why we prefer to consider a tool like EURURALIS primarily as a discussion support tool rather than a decision support tool. The EURURALIS-project was designed against the above background. In the next sections we give some essentials of policy backgrounds, concepts, methods , conclusions and ways to improve or expand its applicability.. 2. The policy background.. The EU committed itself to various international treaties or agreements such as made in Rio de Janeiro, Johannesburg, Kyoto, that basically were inspired by the concept of sustainable development. This concept (Brundtland et al., 1987) puts a balanced development of economic, socio-cultural and ecological domains at the forefront, while safeguarding all essential resources for coming generations. Its basics are expressed and visualized in the well-known People, Planet, Profit (3P-) triangle. While committing itself to these general principles the EU has the challenge to tune this with the current bio-physical cultural, social, economic and administrative / political situation. From a recent Policy document on the strategy for sustainable development (European Commission, 2001) we derived the following issues that underline both the general attitude towards sustainable developments as well as the then expected - and in between realized - accession of new member states. We rephrased and classified themes according to the 3 P categories ourselves! • • • • • • •. 18. Climate change (drought, increase in precipitation, flooding, rising sea levels, violent events) =Planet Threats to public health (toxic substances, food safety risks, sufficient health services) =People Pressure on natural resources (bio-diversity, fish stocks, fresh water, increased amounts of waste) =Planet Poverty/social exclusion = People Ageing/shrinking labour force = People Gap between rich and poor regions (between enlarged EU member states) = People +Profit Congestion/pollution related to urban sprawl/ urbanisation; impacts on rural areas related to sub optimal spatial planning = Planet + Profit.. Alterra-rapport 1196.
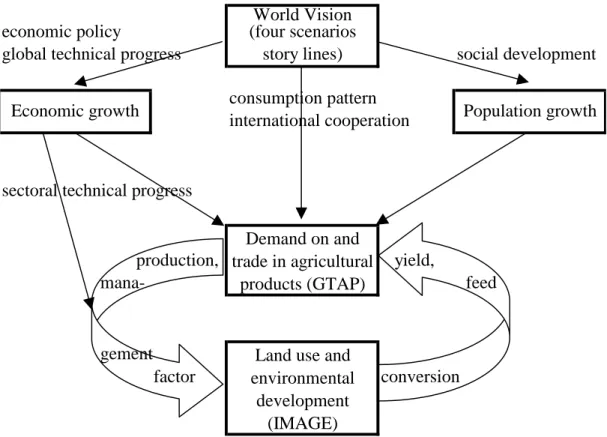
(19) As can be noticed this list focuses at the Planet and People rather than Profit aspects. We can assume that Profit aspects are left somewhat implicit, but still regarded by the EU as crucial for a.o. social development and, sometimes, ecological improvements. We refer to the Lisbon strategy that aims at economic restoration and even a leading position of the EU. Such will affect rural area qualities undoubtedly, though suspicions arise about the safeguarding of Planet and People aspects (EEA, 2004). In the EURURALIS study items as mentioned above were used to select 3P indicators as elaborated later, adding a few topics such as soil erosion or salinization, carbon sequestration, and animal diseases on the one hand and leaving out some others due to data shortage or insufficient time or money. The final choice as elaborated hereafter was made in close interaction with a Policy Advisory Group and a Scientific Advisory group, both installed by the Dutch Ministry of Agriculture, Nature and Food Quality. The policy context made it necessary to present data, insights and model results in a user friendly format. This explains the choice of a CD ROM that is easily to approach and to browse (Wageningen University and Research, RIVM, 2004). This tool is made highly visual by a liberal use of possibilities for users to make their own graphs, maps and comparisons of scenarios, countries or periods according to their interest. We tried to build in several levels of detail: I) the level of the simple "takehome" messages (one-liners), II) a second level with some more explanation and III) if necessary more detailed, technical information as background (e.g in PDF format).. 3. The main concepts and architecture of the EURURALIS project.. Sustainable development, the explicit policy orientation and the required user friendliness were the main user requirements for the EURURALIS project. We started from the following concepts, methods and architecture of modules (fig. 1): • the selection of contrasting scenarios that are scientifically and politically accepted and fit for the job; therefore we used IPCC/SRES related scenarios or versions that were built upon comparable lines of thought, be it somewhat adapted and made more specific for European rural area issues; • the identification of major driving forces (DF's) considered to be crucial for current or future developments. The idea of DF's causing effects in the state of variables, impacts and possible policy responses fits into the general DPSIR concept (Driver, Pressure, State, Impact, Response) (OECD,1994; EEA,1998; Klijn, 2004); • due to the nature of currently important driving forces the inclusion of global processes and data (e.g. for world economy, population growth, welfare development or global change insofar necessary) was seen as crucial. So we had to throw the net wider than EU 25 countries alone to get relevant data and processes on board, especially on world trade; • to understand and assess future changes it is necessary to analyse the nature, rate and geography of drivers and effects in the past. This helps to underline that all periods differ from each other in some aspects as much as that every. Alterra-rapport 1196. 19.
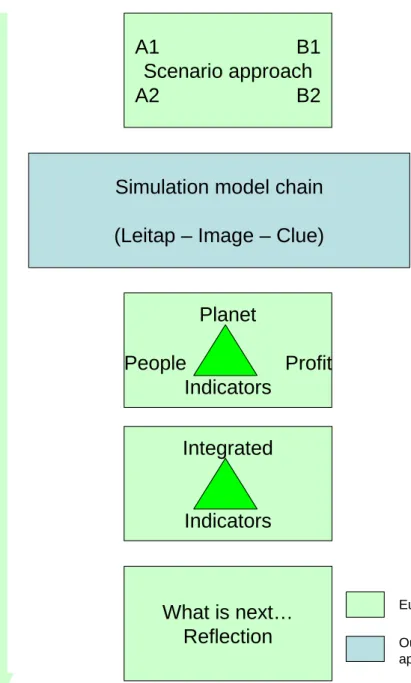
(20) •. •. •. •. 20. region can differ from the other due to physical, socio-cultural ,economic or political differences; the use of generally accepted and tested core models that could be linked in order to specify and break down driving forces to the EU25 and to translate their impacts on chosen 3 P parameters. We started with a global trade model (GTAP for our goals adapted in LEITAP), linked that to an environmental model with mainly national level output (IMAGE) and finally a more detailed - even to kilometre grid-level - land use changes in a land use model (CLUE). These models are dealt with elsewhere in this volume (Meijl et al., in press, The impact of different policy environments on land use in Europe, Eickhout et al., in press, Economic and ecological consequences of four European landuse scenarios, and Verburg et al., in press, High-resolution simulations land use changes in European landscapes). Models were lined up in the order of appearance and made interactive. Their combined output was used to assess various effects on indicators in either thematic models or "rules of the thumb"; land use change is seen as pivotal for changes in the 3P domains in rural areas. Land use change can encompass change in total area of a certain land use type (more of type A, less of type B), it can be specified after its precise geographical situation (where) and - when possible (!) - the change in intensity. Logically impacts can result from land use change, spatial characteristics, the change in intensity and/or from driving forces as such (e.g. climate change affecting bio-diversity or farm productivity). spatio-temporal specification: temporal scales and related intervals and spatial scales and related spatial resolution were chosen to fulfil diverging wishes:. For the temporal scales is chosen to give an overview for a period of 30 years with intervals of 10 years). For the spatial resolution is chosen to present overviews for the whole of Europe, distinguished for EU 15 respectively EU 10 countries (country level) or lower levels (regions) or when feasible and meaningful even on kilometre grid level. indicators: as stated above we tried to choose indicators from the 3P domains that were meaningful for policy makers as such, representative for other related phenomena as much as possible and based upon sufficient data and scientific insights. The overall aim was that indicators should be limited in number to avoid an overdose of data. In addition we tried to aggregate the results of individual indicators in more integral or meta-indicators.. Alterra-rapport 1196.
(21) A1 B1 Scenario approach A2 B2. Simulation model chain (Leitap – Image – Clue). Planet People Profit Indicators Integrated. Indicators. What is next… Reflection. Eururalis application Outside Eururalis application. Figure 1: Architecture of EURURALIS project. 4. Scenarios. As explained earlier we tried to build on "state of the art" scenarios that were useful for our goals (Europe, long term, large scale (global) processes of various kinds, affecting all aspects of sustainability) and that are politically accepted. The IPCC scenarios and various close relatives (ATEAM, undated ; UNEP, 2002; UNEP/ RIVM, 2003; UNEP/RIVM, 2004; Nakicenovic and Swart, 2000; Mooij and Tang, 2003) were used as the fundament. This delivered four familiar scenario-alternatives , in our study titled Global economy(A1), Continental Market (A2), Global Cooperation(B1) and Regional Communities(B2). Their respective positions are determined by two perpendicular axes defining the four quadrants: the assumed role of governments (high versus low regulation, the latter fitting the ideas on the. Alterra-rapport 1196. 21.
(22) benevolence of a free market) and the scale level of processes and interventions (global versus regional).Necessary specifications were given for EURURALIS to comply with special conditions and requirements for Europe, especially for Common Agricultural Policy issues. We include a figure (fig. 2) showing the most elementary characteristics, extensive information on scenarios is given elsewhere in this volume (Westhoek, et al., in press, Scenario development to explore the future(s) of Europe’s rural areas). A1. B1. Global Economy. Global Co-operation. Continental. Regional. Market. Communities. A2. B2. High Regulation. Low Regulation. Global. Regional. Figure 2: Scenarios in EURURALIS. 5. Driving forces. Driving forces (DF's), considered to be relatively autonomous and sometimes literally outside forces affecting processes in rural areas are manifold and not seldom causally interconnected. We identified the following as important: I) demographic developments (growth, decline, ageing, migration) as these determine partly consumption, needs for housing, infrastructure and availability of labour, II) changes in welfare (inside and outside the EU), that determine food demands quantitatively and qualitatively (food quality, diet), III) geopolitical change (e.g. the EU formation, possible further expansion or international agreements and legislation), IV) changes in attitude such as consumer concern (influencing diet preferences of people, their behaviour, societal positions towards animal welfare), V) technological progress (for instance mechanisation, automation on farms, gen-technology and the diffusion of existing techniques) and VI) global change (e.g. climate change affecting regions within Europe in various directions and at various rates). None of these driving. 22. Alterra-rapport 1196.
(23) forces can be predicted reliably or precisely over 30 years. In EURURALIS we made assumptions as concrete and transparent as possible in the detailed formulation of scenarios (Westhoek, et al., in press, Scenario development to explore the future(s) of Europe’s rural areas). The combined effect of a certain constellation of DF's has been translated to changes in land use. The CLUE model (Verburg et al., 2002, 2004) distinguishes eight (8) land use categories, changing in area and spatial position. Land use change, though not a relatively independent driving force comparable to the above mentioned but a more intermediate shackle in de cause-effect chain, causes effects on e.g. ecology, pollution, erosion hazards, labour, income and others or interacts with other, more autonomously acting forces, such as climate change.. 6. Indicators further explained.. Indicators for sustainable development in 3P domains form the alpha and omega of the project. As made clear the "raison d'être" of EURURALIS lies in the choice of policy- relevant indicators that represent 3P domains sufficiently. In view of their central importance we focus on them and explain how we dealt with them or what could be added in later stages. For explanations on the various thematic models and various decisions on rules of the thumb, criteria or classes we must refer to the background document of EURURALIS (Klijn et al, in prep) or the contributions of van de Berg et al. (in press, Impacts of land use change on biodiversity: an assessment for agricultural biodiversity in the European Union) elsewhere in this journal.. 6.1. (Single) Indicators.. Generally indicators for use in policy making ought to be I) limited in number, II) comprehensible and policy relevant and III) representative for the 3 P domains. Compared to what was theoretically desired, we had to be practical as not all data were available with sufficient cover over all EU 25 countries. Finally we selected the following list, grouped after the People, Planet and Profit categories:. People : •. •. Employment in the agricultural sector, unemployment relating to poverty or causing migration to cities. Changes in employment in agriculture were calculated and expressed in growth or decline for the sector on country level. Together with other indicators, such as demographical ones, and harder to define aspects such as the level of medical, social and cultural services attainable for inhabitants (un)employment is a measure for the viability of the countryside. Self sufficiency : considered important by people and governments alike as it symbolises food security, the independence of import of food and other essentials from elsewhere, be it on regional, national or EU level. The importance depends on the world vision and in-built trust in the absence of wars or major disasters and a well-greased trade and transport circumstances. Some scenarios (e.g. A1) disregard such a goal, others take this as an. Alterra-rapport 1196. 23.
(24) important issue. Self sufficiency was assessed for the EU level for major categories of products. • Animal diseases : seemingly a peculiar topic to be placed under the heading of People as it has substantial economic aspects (indirect and direct loss of capital) and outbreaks of diseases and patterns of spreading resemble ecological phenomena and could be grouped under Planet aspects. Nevertheless, for EURURALIS the dominant factor is how people are ethically / morally and physically affected and value how official policies (non-vaccination, massive cullings, transport bans, passage prohibited) respond to the outbreak of animal diseases. Predictions of higher or lower risks of outbreaks of diseases were linked to scenarios in which farm size, nearness and some other aspects were used for a qualitative comparison. However, shortage of data and insufficient spatial resolution did not allow more than a qualitative outcome for the EU 15 countries only. Planet : • Bio-diversity in natural areas: these were explicitly distinguished from biodiversity in agricultural areas, i.e. largely extensively farmed areas or areas with a mosaic pattern of farmland and natural elements. Natural areas are primarily vulnerable for fragmentation or area reduction, climate change, pollution and disturbance. • Bio-diversity in agricultural areas (mostly related to the continuity in extensive farming and susceptible to change in farming type, scale enlargement, change in farming intensity or land abandonment) • Pollution: for practical reasons we selected Nitrogen pollution (by deposition from the atmosphere) as an example of diffuse pollution of which the effects are relatively well known and well linked to farming intensities as well as other industrial and urban sources. • Soil erosion risks: change in land use (e.g. the conversion from arable land to grassland or to permanent nature) assessed in terms of increased or decreased risks of soil erosion. • Salinization risks: risks for agricultural land related to initial soil salinity, seepage in low lying coastal flats taking into account water deficits. The issue is the more relevant in view of imminent climate change. • CO2 storage: relevant to the desired control of climate change in view of the KYOTO targets for Europe. The issue of carbon sequestration in rural land use has been selected. A special focus is given to storage in forests, whereas the expansion of natural forest after land abandonment creates opportunities. Other meaningful data related to farm management were not yet included for practical reasons only.. Profit •. 24. Change in yield of major agricultural crops has been assessed taking into account I) a gradual increase in productivity and II) especially a more than average increase in Central and Eastern Europe due to the diffusion of more efficient farm management techniques The difference between actual and. Alterra-rapport 1196.
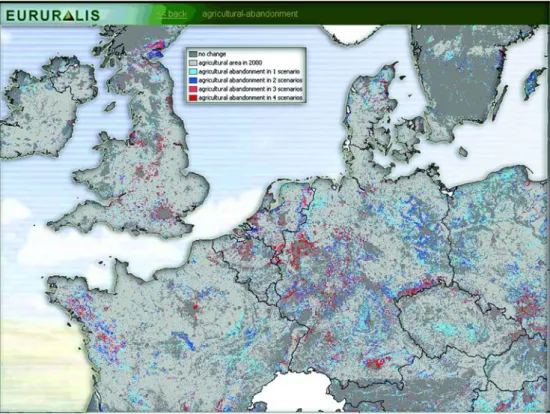
(25) •. • •. potential production levels can be indicated as yield gap. Its size determines possible yield growth. Yields, related to assumed climate change has been assessed to see whether for Europe as a whole or for some regions specific problems could arise. Expert judgement, taking into account predicted change in temperature and precipitation and higher CO2 levels has helped to assess effects. Income in agriculture has been assessed, with or without CAP support measure Expenses in this case for the CAP (Common Agricultural Policy) are connected to the various assumptions or ‘a priori's’ in the scenarios, varying from abolishment to a continued use of support measures. 6.3. Meta - indicators. Even a limited set of scenarios (4) each with a different nature or weight of major drivers, data on land use change ( 8 land use types, area size, position), single 3Pindicators (12), periods (4) and countries(25) and last but not least a possible specification of agricultural products yields a huge pile of information. The danger for the non-experienced user, is that he/she cannot see the forest for the trees and misses major points. Therefore we tried to aggregate or generalise the output in a more limited manner, while adding some aspects that could be relevant for politicians such as the implications of scenarios and in-built policy measures for developing countries. We addressed these as meta-indicators (comprising integrative aspects, aggregations, extra aspects) : • overall 3P scores : tables for the scores in the People, Planet and Profit domains shown for EU 25 countries or specified for EU 15 and EU 10 countries after the 4 scenarios • East-west: Specification EU 10 and EU 15 countries, focused at the question whether or not cohesion between these older and newer member states is furthered by closing the gap in e.g. income or employment • North-South: an expert judgement (!) on the various pro's and con's of scenarios for developing countries • Hot-spot areas: an indication of. those areas where in one or more (up to four) scenarios land use change can be expected. These areas are considered the most interesting for policy makers as they show what different policies can mean in practice and to be warned timely that these areas are prone to changes that often require extra measures to guide these processes orderly (Fig. 7) • "Should be versus will be differences": a confrontation of how the various world visions and related expectations within the four scenarios are confirmed or denied by the outcome of the EURURALIS assessments. Often presumptions will be confirmed, though not seldom the opposite is true. The latter are counter-intuitive outcomes. EURURALIS 1.0 offers in the introduction a self test to identify ones personal preference towards world visions.. Alterra-rapport 1196. 25.
(26) Figure 7: Hotspots map for agricultural abandonment. 7. Main conclusions. As stated above a huge number of conclusions can be generated from the EURURALIS project. We present the main conclusions considered policy relevant on EU level;. Rural population : shrinking and ageing more than proportionally. All scenarios yield a strong decrease in rural population: from 100 million people in 2000 to around 75 million in 2030. The ageing of Europe’s population as forecasted will be even stronger in rural areas compared to urban areas. Ageing and depopulation will affect the viability of rural communities.. Firm future for farming, also in a global economy. Agriculture, though shrinking in GDP share, employment and in cultivated area will remain the principal player in rural areas in all scenarios. Also in a free market scenario where support measures are abolished. The scenarios encompass quite different agricultural policies, from abolition of Europe’s Common Agricultural Policy (tariffs, export subsidies, farm support) to maintenance of the present policy. Most scenarios (except A2) show a decrease of agriculturally used land. Land abandonment could create possibilities for a more sustainable agriculture and nature restoration.. Inescapable climate change asks for adaptive strategies. Climate change will affect all of Europe, more notably the Mediterranean, Alpine and northern regions. Impacts will increase in future decades due to time lag of processes and expected increase of problems caused by economic growth in the 3rd World,. 26. Alterra-rapport 1196.
(27) especially in the A1 scenario. Next to source oriented policies, adaptive strategies are inevitable, to safeguard bio-diversity, to allocate sustainable agriculture and to avoid risks for people and goods such as flooding. Carbon sequestration by conversion of cropland into forest or by large scale bio-fuel production will have limited contributions to Kyoto targets.. Accession: mutual profits for existing and new countries. The EU enlargement (EU15 + EU10) will bring economic profits to both the EU15 and EU10 countries. The EU 10 countries will be affected most, in economy, in socio-cultural and in ecological sense. Rates of transformations seem to be highest here, especially in free market conditions, having strong impacts in the social and ecological domains as well.. Rural transitions require support for social, cultural, ecological values in marginal areas.. Transitions in rural areas can be fast and massive in certain regions. Most marginal areas will see land abandonment and socio-cultural and economic decline as well as possible landscape deterioration. Areas where agriculture will undergo further intensification, will be affected negatively in environment, biodiversity and landscape qualities. Both transformations demand an adequate strategy to safeguard values by spatial planning and management.. Urbanisation has many effects on rural areas. The tendency in all scenarios is that further urbanisation takes place, having effects on biotope losses, fragmentation of natural areas, environmental stress and larger claims on rural areas for recreation and tourism. Careful planning with respect to existing values and possible future risks due to climate change is required to lead urbanisation processes in a desired manner.. Supranational spatial planning still a missing link?. Many driving forces act on a Europe wide scale, many European level policy responses tend to be thematic (aimed at a certain issue) and at the same time generic (valid everywhere), whereas national policies disregard supranational interests. In view of many problems surpassing national boundaries international spatial strategies for urban and rural areas are required.. Responsibilities for developing countries. In two scenario’s (A2, B2) strong trade barriers remain between the EU (in A2 together with the USA + Canada) and other countries (both industrialised and developing countries). In developing countries this will lead to continued poverty of many people, accompanied by high population growth and more land conversion for subsistence agriculture. This affects social and ecological aspects negatively. Dismantling of trade barriers in itself is not enough: effective development aid and the support of good governance in development countries are crucial as well.. Alterra-rapport 1196. 27.
(28) Scenarios are just a support to envisage threats and opportunities, no blueprint.. Scenarios as presented serve as a help to envisage alternative futures, not as a simple choice from four meals. The four contrasting scenarios are not intended to suggest an either-or type of choice. Policy makers can, as the present state of policy making may illustrate, make their own choices that are well-considered compromises of policy elements from more than one scenario.. 8. Further research. The current EURURALIS 1.0 version results from a 10 months study with practical limitations in time and money. Improvements can be considered on the following points: • extending the scenario approach by including bottom-up procedures such as developed by the PRELUDE project and/or by including backcasting scenarios that depart from a defined end situation in e.g. 2030; • adding possibilities to choose policy goals and policy instruments as the primary entrance to assess their effects on indicators; • by expanding the area studies : e.g. new applicant countries or the new neighbours of the enlarged EU; even other continents could be studied; • offering more detail for some countries or groups of countries with tailor made specifications; • adding new topics in the list of indicators: especially attention for water quality and quantity aspects (related to the Water Framework Directive), a more integral approach of greenhouse gases, a consistent inclusion of landscape qualities or certain social or cultural parameters; • adding more data on intensification or extensification processes within the categories of land use; • carrying out a more rigid analysis of errors, uncertainties and a sensitivity analysis; • making the future EURURALIS versions more appropriate for public discussions and/or education purposes.. 28. Alterra-rapport 1196.
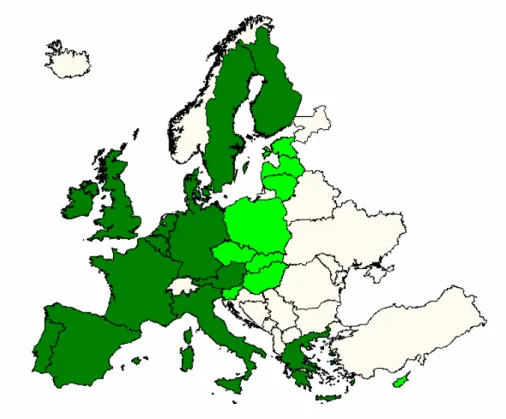
(29) 1. Introduction:. 1.1. Background. 1.1.1. Europe in space and time: a diverse and dynamic continent. To put the project in its societal context we give some characteristics first. Europe's rural area harbours economic, ecological and socio-cultural assets. The area - in this study restricted to the EU 25 countries - exhibits many remarkable and attractive regional differences in nature. Both a-biotic diversity (recently addressed as geo-diversity and bio-diversity are determined by a host of different geological and climate conditions, the variety in topography, soils and bio-geographical patterns.Superposed on these natural patterns a millennia long history of land use caused further differentiation and delivered a full spectrum of fully natural to cultural ecosystems.Cultural aspects reflect the wealth of cultures and social conditions found throughout Europe. Rural areas harbour many people, whose social and cultural values and interests are strongly dependent on the course their future could take. Last but not least Europe's rural area is a productive area with a variety of agricultural products and timber, also yielding many other goods and services (water, recreation). Compared to other and larger continents Europe emerges as a physically and culturally very diverse and economically seen wealthy region with a relatively long and intensive interaction of nature, culture (Klijn & Vos, 2000). All these issues require (re-)assessments in view of dominant developments to be expected, of which the majority reflect the importance of globalisation and global change in various respects... Change as the constant factor. The landscapes of Europe by no means form a static pattern. They were continuously subject to transitions or - stated otherwise - processes of change. These changes differ from region to region and are invariably driven by a combination of processes. History shows major demographic, geopolitical, economic and biophysical as well as socio-cultural driversTheir relative importance and pace changed in time As well as in regions. Some periods are relatively stable, others exhibit sudden and massive transformations driven by forces of various origin. Europe experienced massive migrations in previous millennia, it saw the rise and fall of kingdoms, it witnessed many smaller and greater wars, underwent changes in climate such as the mediaeval Little Optimum later followed by Little Ice Age, devastating diseases like the Black Death, great famines such as observed in Ireland late in the 19th century, it saw the colonisation of the third world from various expansive European countries. More recently the continent underwent large industrial revolutions and urbanisation, a process during which a steadily increased welfare was accompanied by the important increase of Europe’s population size. A recent geopolitical feature is the formation and stepwise expansion of the EU on the one hand and the collapse of the former Soviet Union on the other, creating new socio-economic challenges for East. Alterra-rapport 1196. 29.
(30) and West alike. Landscapes were used accordingly to serve the various demands of people and landscapes under sometimes contrasting social, economic and political regimes. It is not only the landscapes that changed due to natural or man-induced causes. People's perception and their valuation of material and immaterial characteristics of the rural environment and its use were equally subject to change: new demands such as a high mobility of people, recreation and tourism, but also an awakened environmental awareness, consumer concerns on food production and animal welfare changed considerably. All these changes set their stamp on the rural area of Europe in history. Certainly they will do so in future in an equally dynamic manner. The relationship between driving forces, land use and finally the impact on the rural area and rural communities is the primary subject of our study. Our interest is how rural areas could develop in the coming decades The current study did not approach these issues from an academic point of view .Our primary concern was how policy making could influence the course of processes in a desired direction while avoiding adverse developments. That is why we tried to address threats and opportunities.. 1.1.2. Imminent changes: threats and opportunities. Recent and ongoing developments in Europe's rural areas are fast and will have major impacts. We perceive the recent accession of ten new member states causing an enlargement of the EU from 15 to 25 countries, creating a larger internal market and bringing the challenge to abridge socio-economic differences in order to create more cohesion between East and West. Furthermore the negotiations within the WTO context will lead to a further opening up of the European market for non European countries. Thirdly, demographic conditions will presumably take quite another course than in preceding centuries. We can witness phenomena like stagnation in population growth or even a decline, ageing and ongoing migration to cities draining the rural areas. Europe, named after the young and attractive maiden EUROPA in Greek mythology, seems to turn into an old lady, demographically spoken (see later in this report dealing with demographic forecasts). Though uncertain in its precise future the course and impacts of global change (climate, sea-level) will undoubtedly bring about several and sometimes important changes in climatic conditions and related processes. Furthermore we can expect all kinds of other influences such as new technologies (e.g. in agriculture) and changes in attitudes of people (consumer concerns for instance). All these changes and their driving forces are complex and interacting with each other. Effects are hard to fathom as their directions and rates are sometimes highly uncertain.Nevertheless, they can arguably be considered as possibly significant, large scale and affecting a. 30. Alterra-rapport 1196.
(31) host of values at stake in rural areas. Taking all these processes seriously it always has to be remembered that Europe as a whole is an extremely diverse continent, where regions show remarkable differences in bio-physical conditions, socio-cultural properties and where the direction and rate of changes could differ considerably. Figure 1.1: EU countries. 1.1.3. Policy making and the role of research. Policy making is or at least should try to be congruous to be anticipative and proactive. This is the more true as many changes respond to forceful drivers that can only be controlled or corrected if policy measures are taken timely and implemented in a powerful manner. Interventions may be of the type that avoids regrettable developments or on the opposite promote promising developments that fit new opportunities. Policy makers, especially at the level of an enlarged EU, should have a clear picture of shared overall goals for coming decades against the background of threats and opportunities. These political goals can be expressed in various levels of detail. On the most general level the internationally shared concept of sustainable development as launched by Brundlandt et al. (1987) , settled in Rio de Janeiro and confirmed in successive agreements (Johannesberg, Kyoto) has been accepted for the EU. The concept implies a dynamic balance between socio-cultural, ecological and economic interests on time scales that span at least the coming generations. The European Union committed itself to these general goals.. Alterra-rapport 1196. 31.
(32) The role of research is to inform policy makers on the relevant issues and policy options in an anticipatory, reliable and digestible way. Primary tasks are the ordering concepts and theories, gathering and ordering data, making scenarios explicit and transparant, the identification of the most relevant interactions (interdependencies, cause-effect studies) , making and handling models that enable to predict "what - if " situations and indicating the effect of policy interventions. The predictability of processes over some decades has its limits. Science has to cope with various degrees of uncertainties. Sometimes onecan predict developments within reasonable margins, but in many other cases this is not feasible at all. The most sensible approach is then to identify the margins of what is conceivable in the future. Policy makers are thus assisted by delineating the playing field instead of giving them the most probable or profitable course to cross the field.. 1.2. Aims, character and steps of the EURURALIS study in short. 1.2.1. Discussion support rather than decision support. The general aim was to build a tool that supports discussion on the future of the rural area of Europe (EU25) based upon a scenario-approach addressing the major issues playing in the areas seen from the perspective of sustainable development.We consider discussion support the primary goal to be facilitated by facts, figures and insights, which implicitly means that the tool should be digestable, interactive and policy oriented. It should be based upon the "state of the art" in science. Due to limitations in time and money the study was primarily a desk study, based upon existing and widely acknowledged scenarios, data, models and policy options. Major added value is given by combining various data, insights in interrelationships and by presenting results in a crispy, digestable manner.. 1.2.2. EU- 25 coverage; a broad spectrum of issues. Set against the background depicted above the current project has a specific position and role. Policy makers want to be informed on the possible future developments in the European rural area. The Dutch Ministry for Agriculture, Nature and Food Quality (ANF) commissioned this study from an interest in Europe's future. The Netherlands geographically form a part of a much larger and still enlarging Europe. EU's agricultural policies (CAP) and its agricultural sector have to de defined against the background of a world encompassing market. A special argument to launch the study was the Dutch EU chairmanship in the latter half of 2004. Issues addressed are identified from current policy documents. Europe in 2004 grew to a much larger and more complicated union of countries (15 + 10 !) , whereas it has to cope with a multitude of issues synchronously.To do this in a balanced way is one of the major challenges An overarching goal is to safeguard and enforce sustainable development(see below). 32. Alterra-rapport 1196.
(33) 1.2.3. Rural areas at the centre, but not without urban areas. Rural areas, here considered as both natural and cultivated areas,and comprising some 80 % of the total area of Europe, are largely multifunctional Several goals and interests are combined in land use.These relate to economic functions (e.g. agricultural production, mining, water extraction) and an array of social, cultural and ecological values.Rural areas cannot be studied separately from urban or urbanising areas. Urban functions, including housing, infrastructural works, , transport nodes industrial developments , offices etcetera, are powerful in their spatial developments and affecting the rural surroundings in many ways. Therefore, EURURALIS tried to incorporate major developments in urbanisation patterns to assess their effects on rural areas.. 1.2.4. Sustainable development as guiding principle. This study is also a product of our time. Political assessments and decisions are no more an outcome of one-sided economic appraisal, as touched upon in the introduction. Choices and decisions will be discussed from a wider perspective as sketched by the generic aims of sustainable development. This approach- later summarized under the heading of the People, Planet, Profit approach, helps to reflect and decide in a more balanced manner than some decades ago when profit dominated our thinking and where quantity (e.g. in housing or in food production) was more important than quality. 1.2.5. Long-term perspective combined with shorter time steps. Many scenario studies define a relatively remote time horizon and the then to be expected or imaginable situations. Our study, while setting the time horizon quite far from now (30 years), tries to include shorter term steps (e.g. per 10 years) as well to enable a view at the various pathways leading to that distant future as well as the effects of interventions in the various stages. This aim roots in the reality of policy making that has to accomplish a change of course in shorter time steps.. 1.2.6. Existing data, scenarios and methods : added value in combining data and insights. The present study is an attempt to bring existing knowledge and experience together rather than inventing all possible research modules ourselves.. This applies to the choice of scenarios, in which we chose to follow internationally accepted approaches such as IPCC's/SRES to the use of data and models (authorised data, tested models; see section). We were neither able to develop complete new scenarios or models or gather new data in a short time frame, nor were in favour of that as scientific and political acceptability was more important. Alterra-rapport 1196. 33.
(34) 1.2.7. Role of an interactive model. The study is not designed as a product of scientists shedding their academic light on interesting issues. Its goal was to build an interactive model, that allows e.g. politicians, to get information and insights in a digestible and comprehensive way.We built in various options to follow personal interest and to get information on various levels of detail. We tried to give answers on questions that are put most often. Interactivity is therefore not complete: many aspects are pre-cooked, for instance the choice of scenario's and indicators. More tailor made information or answers on specific questions cannot be answered by the CD ROM as they require targeted modelling. That however is possible when returning to original data and models and investing more effort and time .. 1.2.8. Target Goup Policy makers; policy context. The EURURALIS project contributes by its attempt to include policy aims and measures as background.Main traget groups are policy makers at the EU and national level, commtitted stakeholders and researchers Most relevant for the policy context are the World Trade negotations, the CAP (Common Agricultural Policy and its two pillars) policies and measures regarding the environment (e.g. on the Kyoto agreements on the reduction of greenhouse gases, directives on nutrients or pollutants), Nature conservation (e.g. Natura 2000, Habitat and Bird Directives) , Water management (Water Framework Directive) and European Spatial Planning (ESP) .. 1.2.9. EURURALIS in a simple flow diagram. The general framework of the present study is visualised in figure 1.2:. 34. Alterra-rapport 1196.
(35) Figure 1.2 General framework for Eururalis project. Alterra-rapport 1196. 35.
(36) 2. Basic concepts and tools. 2.1. Introduction. In EURURALIS we relied upon some central concepts or philosophies such as the DPSIR approach, an explorative scenario-approach, the concept of sustainability (People, Planet, Profit) , the choice of a limited set of indicators to represent the various domains of sustainability, meta-indicators to integrate them, a certain architecture of a chain of core models that enable us to predict and assess assumed changes ("what-if" outcomes) and ways to deliver our findings in an partly interactive, digestable presentation. We elaborate these in the following paragraphs.. 2.2. A simple DPSIR approach: The distinction of Driving Forces, Pressures, States, Impacts and Responses (DPSIR). The DPSIR model shown here (fig 2.1) (see Klijn, 2004; OECD, 1994 ; Wascher, 2004) represents the idea that we can distinguish between driving forces (D) (either direct or proximate or indirect or distant) affecting a defined system (ecosystem, agro-system) by so-called pressures (P) affecting its state (S) This can be seen as the impact, which has to be assessed from society’s interests (negative or positive, acceptable or unacceptable). This assessment can lead to policy interventions (Response:R). These can be targeted at effects (mitigation, compensation) or - more fundamentally - at the direct or indirect drivers. In the current project we emphasised the importance of land use, which is more or less an intermediate entity. Land use is on the one hand the expression of societal needs, interest, economical laws, (Profit), techniques and on the other hand it exerts direct influences on the biophysical en partly socio-cultural values (Planet, People).. A s im p le D P S IR re la te d m o d e l D r iv in g fo r c e s D is t.. P r e s s u re s. S ta te. Im pact. P ro x.. R esponse U n d e rly in g c a u s e s. P o lic y O p tio n s M a jor d o m a in s. S ector. L an d u se. E ff e c t. C u r a t iv e. Figure 2.1: DPSIR related model (from Klijn, 2004). 36. Alterra-rapport 1196.
(37) A more targeted specification of the general DPSIR approach is shown in a mental map (fig. 2.2); It shows the major drivers, land use and values or functions in the European rural areas, going from the outward rim to the inner circle of the diagram. Items are indicative, not limitative.. Figure 2.2: DPSIR approach. Referring to the mental map presented in the above diagram we distinguish a number of major driving forces acting both in the past and the future.: Demography: (expected) growth/decrease of population in (future) member states + (internal) migration between and within states (rural area to cities and /or the other way around) + significant change in age distribution. Specified on the level of countries and/or major regions within countries Global change: expected (range) of climate change (Summer- and winter temperatures, precipitation and other), change in sea-level according to IPCC scenario studies(not included in effect predictions as such) Specified for zones within Europe and refined based upon topography and other parameters. Political/ administrative regime: depending on the level of European coordination, legislation and regulations (strong vs. weak). This could enhance Common Agricultural Policy (CAP) measures, specified according to the two pillars. Spatial. Alterra-rapport 1196. 37.
(38) Planning of countries regulating land use (urban and industrial development, main infra-structural works, nature protection) and other policies (environmental, nature) as well as other policy domains. Some scenarios assume further enlargement of the EU Macro-economy/ trade : To be considered as a major driving force, rooted in changes in production and consumption relationships, import and export of goods and services and growth or decline of certain sectors. For agriculture these aspects can be translated in areal demands. Progress in technology and diffusion of technological findings: Technology and technology diffusion has been documented as an important driver that changes economic and non economic activities in significant manners. Agricultural sector underwent many changes, generally leading to higher production, efficiency and scale increase in farm size.More efficient agricultural production has been incorporated in scenarios. Change in values in society, consumer concerns and behaviour : for instance related to responsibility for environment and biodiversity; care for food security and quality of production and products; environment, safety respectively specific behaviour (e.g. preference in recreation) . Not all drivers could be included in EURURALIS explicitly or made quantitive. 2.3. Selftest: from personal intentions to scenario comparison. Reflecting upon the future and its various threats and opportunities is a mix of knowledge, more or less justified expectations, personal convictions and sometimes sheer belief or disbelief. Generally people include many explicit and maybe more often im-plicit normative aspects in their way of thinking. Eururalis offers a test, the so-called Self test, to verify the intentions that drive the personal normative notions. This Self-test is based on the WIN-model of the Dutch Institute TNS NIPO (Hessing et al. 2004). After conducting the test the result shows in which of the eight predefined normative groups the user of Eururalis is classified to. These groups are Care-takers (Zorgzamen), Conservatives (Behoudenden), Hedonists (Genieters), Well-balanced (Evenwichtigen), Materialists (Luxezoekers), Professionals (Zakelijken), Broadminded (ruimdenkers), Socially minded (Geëngageerden).. 38. Alterra-rapport 1196.
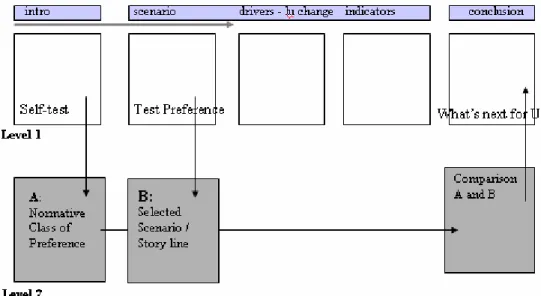
(39) Figure 2.3: Eururalis: from personal intentions into a comparison of scenario preferences. In the Eururalis application (figure 2.3) this Self-test is available by the Intro-Tab (level-1) followed by Self-test Tab (level-2). When the user click subsequently on these Tabs a screen will pop up and asks the user to select one out of 18 human modes of desire, followed by 18 desired end states of existence. The value systems of respondents are determined according to the WIN-model (Hessing and Reuling, 2002). Each respondent had to rank two lists with 18 values in order of how they desire to be, as developed by Rokeach (1973)1. Rokeach (1973) distinguished the 36 values, which are all social desirable, in 2 groups. One group has 18 instrumental values (modes of conduct) and the other has 18 terminal values (end states of existence) .. 1 Rokeach (1973) defined a value system as an enduring organisation of belief of conduct or end-state of existence along a continuum of relative importance. In a value system values are ordered in priority with respect to other values. Here a value is an enduring belief that a specific mode of conduct or end-state of existence is personally or socially preferable to an opposite or converse mode of conduct or end-state of existence.. Alterra-rapport 1196. 39.
(40) Table 2.1 The two lists of 18 values, according to Rokeach (1973) Instrumental values Terminal values (desired modes of (desired end states of existence) conduct) 1. Ambitious 1. A comfortable life 2. Broadminded 2. A sense of accomplishment 3. Capable 3. A world at peace 4. Cheerful 4. A world of beauty 5. Clean 5. An exiting life 6. Courageous 6. Equality 7. Forgiving 7. Family security 8. Helpful 8. Freedom 9. Honest 9. Happiness 10. Imaginative 10. Inner harmony 11. Independent 11. Mature love 12. Intellectual 12. National security 13. Logical 13. Pleasure 14. Loving 14. Salvation 15. Obedient 15. Self-respect 16. Polite 16. Social recognition 17. Responsible 17. True friendship 18. Self-controlled 18. Wisdom. Next a value space is calculated according to Schwartz and Bilsky (1987) by forcing a two-dimension solution of a principal component analysis (PRINCALS). Finally, Hessing and Reuling (2003) made a cluster analysis for the respondents in the value space. They forced an eight-cluster solution and gave names to the value groups, based on their value pattern and other known aspects (figure 2.4). Mind that the names mentioned in figure 2 are not based on the perception of the respondents but given by Hessing and Reuling.. 40. Alterra-rapport 1196.
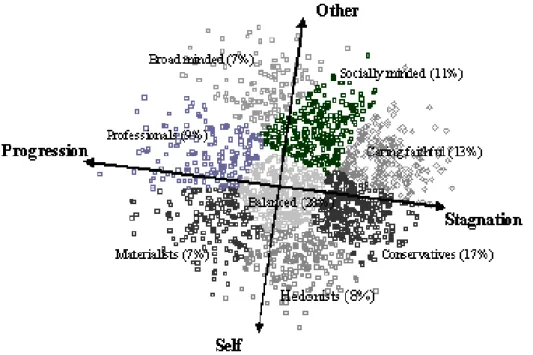
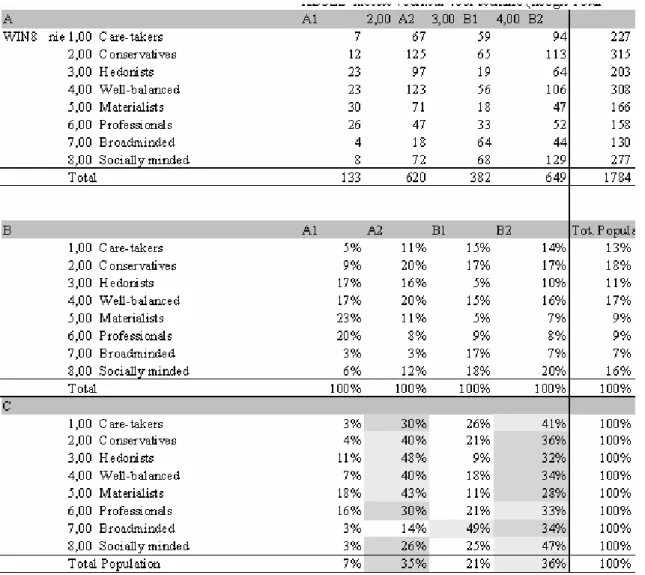
(41) Figure 2.4 Normative groups (Hessing and Reuling (2002)). Figure 2.4 shows the 8 different classes of normative preferences. The percentages reflect the size of the groups in the Dutch population. The last screen of the self-test shows your normative mode. In the meanwhile this normative mode will be linked to the story line of one of the four scenarios. This link is based on the outcome of previous research of TNSNIPO and RIVM (MNP-RIVM, 2004) on the relation between normative modes in the Dutch Society and story line preferences. In other words this link is based on a Dutch study and for that reason culture dependent. (figure 2.5). Figure 3 shows by cross table A the absolute division of the selected representatives of the Dutch Population in normative groups and the scenario preferences. Cross table B shows the relative numbers of this division under the condition that the total population will be 100% and the summation of the preferred scenarios is also 100%. Well-balanced, Socially-minded and Conservatives seem the majority groups. Broadminded, Materialists and Professionals are the minorities. Cross table C gives a relative overview of the preferred scenarios per normative group. Each group is totalized by 100%. Scenario A1 seems to have the lowest overall priority and the scenarios A2 and B2 will have a preference.. Alterra-rapport 1196. 41.
(42) Figure 2.5: The link between normative groups and scenario preferences of the Dutch society. The next step is to select by reading the story lines of the scenarios you scenario of preference. First select the Scenario-Tab (Level 1) and afterwards select Your Preference Tab (level 2). Finally the match between your normative mode (by the linked story line) and the selected story line can be found by the Conclusion-Tab (level 1) followed by the What’s next for you-Tab (level 2). By figure 2 cross table C it turns out that there is not one single preference for a scenario. For example the Caretakers do have preferences for all 4 scenarios, but the scenario B2 scores highest. Analysing the cross table from another perspective it turns out that each normative group has never the highest preference for scenario A1. Even scenario A2 has just once the highest preference (see Broadminded). For the comparison we made a selection of the highest preferences (light grey) and the second highest (dark grey). The highest have been used for comparison by Eururalis conclusion “What’s next for you “.. 42. Alterra-rapport 1196.
(43) If the user selects View all Maps (level 3) to be reached by the Conclusion-Tab (level 1) then the differences between the drivers, land use changes and indicators of the selected and calculated scenarios could be compared. Knowing that the scenario A1 will never be selected by the Self test it could be of interest to compare the A1 scenario results by the View Map options.. 2.4. The scenario-approach. EURURALIS followed a scenario-approach that has been chracterized as an explorative scenario-method in which the focus was on conceivable futures in plural, i.e. the development of story lines, assumptions and ideologies that form a consistent line of reasoning. Generally various contrasting, alternative scenarios are chosen to delineate the intellectual playing field. As an extensive explanation is given in the next chapter we confine us to this short typification.. 2.5. Sustainability: PPP-aproach. The idea of sustainability and sustainable development as addresssed by Brundtland et al.(1987) emphasizes a balanced development of various value domains for coming generations. Their ideas are later summarized by the 3P concept (People, Planet,Profit) distinguishing ecological properties and values (Planet), socio-cultural values (People), and values belonging to the economical domain (Profit). The original concept and goals have been endorsed by all countries in the famous Rio Convention, in later conventions (including Johannesburg) and is embraced by the EU and its individual member states. The current project took sustainable developoment as guiding principal and leading symbol ( the well known 3P triangle in fig 2.6.) ) and tried to define indicators for all 3P domains involved.. People. Profit. Planet. Figure 2.6: 3P representation: People, Profit and Planet. Alterra-rapport 1196. 43.
(44) 2.6. Choice of Indicators. In Eururalis we followed the above general approach of sustainability domains and tried to select an operational set of indicators Indicators form the alpha and omega of the project. As made clear the "raison d'être " of EURURALIS lies in the choice of policy- relevant indicators that represent 3P domains sufficiently. Scenarios , their various assumptions on driving forces , the choice and necessary adaptation of models, their linking, the gathering of input data, followed by the running and tuning models , finally results in specified outcomes for indicators in future. We made a distinction between single indicators (grouped after their significance for People, profit or Planet domains, and more integrative indicators (see next section).. (Single) Indicators.. Indicators should be limited in number, policy relevant and representative for the 3 P domains. Compared to what was desired in theory , we had to be practical as not all data were available with sufficient cover over all EU 25 countries.. People : •. Employment in the agricultural sector, leading to either unemployment and often poverty or the migration to cities. Changes in employment in agriculture were calculated and expressed in growth or decline for the sector on country level. The item is relevant for the policy issue "viability of the countryside". • Self sufficiency : is considered as an item regarded important by people and governments as it symbolises the independence of import of food and other essentials from abroad. Some scenarios seem to disregard such a goal assuming an unimpeded flow of goods and services in an optimally functioning market, others take this as an important issue. Self sufficiency was assessed in EURURALIS for the EU level. • Animal diseases : this seemingly peculiar topic to be placed under the heading People has also substantial economic aspects (indirect and direct loss of capital) and ecological backgrounds as outbreaks of diseases and patterns of spreading represent ecological phenomena. Nevertheless the dominant impact is on people, who are ethically / morally and physically affected by the way official policies (non-vaccination, massive cullings, transport bans, passage prohibited) handled the outbreak of animal diseases. Predictions of higher or lower risks of outbreaks of diseases were linked to scenarios in which farm size, nearness and some other aspects were used for a qualitative comparison. Shortage of data, insufficient spatial resolution did not allow more than a qualitative outcome for the EU 15 countries. Planet : • Bio-diversity in natural areas: explicitly distinguished from bio-diversity in seminatural, i.e. largely extensively farmed areas. Natural areas are primarily vulnerable for changes such as fragmentation or areal reduction, climate change, pollution a.s.o. • Bio-diversity in semi-natural areas (mostly related to extensive farming ) which is susceptible to change in farming type and intensity or land abandonment. 44. Alterra-rapport 1196.
Afbeelding
+7
GERELATEERDE DOCUMENTEN
De ACM heeft daarop destijds aangegeven aan GTS dat te willen doen op basis van zo recent mogelijke cijfers over realisaties (besparingen moeten blijken).. GTS geeft aan
De ACM heeft echter geen aanwijzingen dat zij geen goede schatter heeft voor de kosten van kwaliteitsconversie per eenheid volume.. Daarom komt zij tot de conclusie dat zij wel
[r]
De historische PV gemeten op de transportdienst achtte de ACM representatief voor de verwachte PV op de aansluitdienst.. De transportdienst vertegenwoordigt het grootste deel van
Rescue archaeology at Maastricht-Belvédère: excavation of an Early Weichselian site (Site J) in front of the bulldozer, May 1986. order of their date of discovery. Table 1 lists
De ALV kan slechts tot wijziging van de artikelen 1, 2, 5 lid 3, en de onderhavige bepaling besluiten, indien dit besluit met algemene stemmen wordt genomen in een vergadering waarin
geïsoleerd te staan, bijvoorbeeld het bouwen van een vistrap op plaatsen waar vismigratie niet mogelijk is omdat de samenhangende projecten zijn vastgelopen op andere
Verplichtingen > 25.000,- aangegaan door GroenLinks in de Europese Unie in 2019 Naam adres Postcode Plaats Omschrijving hoogte schuld Schulden met externe partijen
