This content has been downloaded from IOPscience. Please scroll down to see the full text.
Download details:
IP Address: 195.169.103.98
This content was downloaded on 26/03/2015 at 12:54
Please note that terms and conditions apply.
Key role of China and its agriculture in global sustainable phosphorus management
View the table of contents for this issue, or go to the journal homepage for more 2014 Environ. Res. Lett. 9 054003
(http://iopscience.iop.org/1748-9326/9/5/054003)
Key role of China and its agriculture in global
sustainable phosphorus management
S Z Sattari
1, M K van Ittersum
1, K E Giller
1, F Zhang
2and A F Bouwman
3,41
Plant Production Systems Group, Wageningen University, PO Box 430, 6700 AK Wageningen, The Netherlands
2
Centre for Resource, Environment and Food Security, China Agricultural University, Beijing 10093, People’s Republic of China
3Department of Earth Sciences–Geochemistry, Faculty of Geosciences, Utrecht University, PO Box 80021,
3508 TA, Utrecht, The Netherlands
4
Netherlands Environmental Assessment Agency (PBL), PO Box 303, 3720 AH, Bilthoven, The Netherlands
E-mail:sheida.sattari@wur.nl
Received 9 January 2014, revised 24 March 2014 Accepted for publication 15 April 2014
Published 15 May 2014 Abstract
Growing global demand for food leads to increased pressure on phosphorus (P), afinite and dwindling resource. China is the largest producer and consumer of P fertilizer in the world. A mass balance analysis of historical P use on China’s arable land shows that P input substantially exceeds crop P uptake leading to the accumulation of residual soil P. A Dynamic P Pool Simulator (DPPS) model is applied to estimate future P demand in China’s arable land. Our simulations show that more sustainable use of P accounting for the residual P can save ca. 20% of the P fertilizer needed until 2050 in China relative to the Rio + 20 Trend scenario. This saving would be equivalent to half of the P required in Africa or sufficient for Western Europe to achieve target crop P uptake in 2050.
S Online supplementary data available fromstacks.iop.org/ERL/9/054003/mmedia
Keywords: phosphorus reserves, food security, crop, agriculture, China
1. Introduction
Phosphorus (P) is a major limiting nutrient in agriculture [1, 2] that is increasingly considered to be a new global sustainability challenge because offinite P resources [3]. In the short-term, increasing P demand may lead to rising prices of P-fertilizer and food, and in the long-term to depletion of global P reserves [4] that will seriously impact food security particularly in developing countries because agriculture is the prime P consumer [5]. P scarcity has five dimensions, including physical, geopolitical, institutional, economic and managerial scarcity [3]. Some studies depict a world with rapidly depleting P reserves in the near future [6]. While the
time scale of P depletion is debatable [6–9], a critical question beyond the physical availability of P is whether P resource depletion can be managed by sustainable P consumption. This question is especially relevant as the global issue of P depletion is largely studied from the perspective of P sourcing (i.e. current production and use of phosphate rock) rather than future P requirements (i.e. P required to feed the world in future) [10]. The critical role of P management was recently illustrated by including residual soil P from past surplus fer-tilizer and manure applications in the estimation of required future P input [10]. Our results showed that by considering residual soil P, the global P crisis can be postponed. Since different countries experience P scarcity in different ways, assessing the P vulnerability and adaptive strategies to increase the resilience of the food system to P scarcity at national scale would be most appropriate [3].
Among all countries, China has a strategic position in P production and consumption. China as a country with a long
Environ. Res. Lett. 9 (2014) 054003 (8pp) doi:10.1088/1748-9326/9/5/054003
Content from this work may be used under the terms of the
Creative Commons Attribution 3.0 licence. Any further distribution of this work must maintain attribution to the author(s) and the title of the work, journal citation and DOI.
history of agriculture and currently feeding 20% of the world’s population (1.3 billion) on only 7% of the arable land (130 million ha) [11] has been selected for this assessment. At the start of the 21st century almost one third of the total P consumed in China was imported, and the remainder mined from its own phosphate rock deposits. Gradually, China started to increase P production, consumption and even export (figure1), with substantial government support [12]. Conse-quently, this country is now the largest global consumer (30%) [12] and the largest producer (37.5% of world total in 2010) of P fertilizer [13] and is responsible for 50% of total Asian fertilizer P use. From the livestock side China also ranks first in terms of monogastric animal stocks (pigs and poultry) in the world [14]. It is relevant to assess future P requirements to support food production, since Zhang et al [12] reported that in the next two decades, 30–50% more food will be needed to meet China’s projected demand.
Hence, among all countries, China has an undeniable influence on global P production and consumption trends, which is key information for politicians and policy makers [15].
Environmental impacts associated with large P surpluses are multiple [16]. Excessive P fertilizer application leads to accumulation of P in the soil and a significant amount of P can be lost by surface runoff to surface waters [17], a major cause of eutrophication of freshwater ecosystems and P leaching.
In this study we analyse the historical and future per-spective of agricultural P use in China. We investigate whe-ther China can play a significant role in global supply of P, while fulfilling its own need to feed a growing population in future decades.
We present an analysis of historical P budgets on China’s arable land at national, regional and provincial levels. Using these budgets, we estimated the time needed to reach soil P saturation at the provincial scale and consequent P leaching from soils. A Dynamic P Pool Simulator (DPPS) [10,18] was applied to simulate the history of four decades of P uptake. Subsequently, DPPS was used to estimate future P demand in China’s arable land by accounting for the residual P stored in the soil due to the surplus P application between 1970 and
2010. Our estimates can be considered as sustainable P rates, as they are based on the soil available P stocks combined with production conditions and crop yields. The text refers to online supplementary information (SI), available at stacks. iop.org/ERL/9/054003/mmedia, that provides details not included in the main text.
2. Materials and methods
2.1. Overview of China’s agriculture
Agriculture is a vital industry in China, employing over 300 million farmers. Through intensification, the agricultural revolution in China has influenced the usage and accumula-tion of nutrients, but at the same time increased the risk of water pollution [14]. Crop production has greatly increased from the 1980s, due to improved crop varieties in combina-tion with increasing use of fertilizers, pesticides and irrigacombina-tion water [19]. China ranks first in worldwide farm output, pri-marily producing rice, wheat, potatoes, sorghum, peanuts, tea, millet, barley, cotton, oilseed, pork, and fish.
Before 1978 most of the nutrients were recycled in mixed farming systems; the livestock was fed with feed crops, fodder and crop residues, and crops in turn were fertilized with animal and human manure and fertilizers [20]. Since 1978 a modern market-oriented farming started to gradually replace traditional farming. Mineral fertilizer became cheaper in comparison with labour costs to collect and recycle the wastes in arable land [14]. Moreover, livestock production increased rapidly due to increased imports of animal feed [19] and became more centralized with an increase in the average number of animals per farm. Spatially, livestock production was increasingly uncoupled from crop production [19]. Manure from confined animal feeding operations is increas-ingly discharged directly to surface water. In areas with highly intensive livestock production, the supply of nutrients in livestock manure often exceeds the crop needs, and sur-pluses accumulate in soils or are lost by surface runoff or leaching and can lead to eutrophication of freshwater and marine aquatic ecosystems [14].
China has 31 provinces, which were grouped in this study infive regions (North, South, Northeast, Northwest, and Yangtze Plain, see figure S1). The farming and cropping systems in these regions differ significantly. Slightly more than 10% of the total land area is used for intensive crop production, mostly in the North, Northeast and Yangtze plain regions. Furthermore, animal production has partly moved from the rural areas to urban areas, close to the food pro-cessing industry and main food consumption centres [19].
The decoupling of livestock and crop production is most apparent around big cities. High animal densities are nowa-days found around Beijing, Shanghai and Guangzhou, and less so in many rural areas in the North, Northeast, Yangtze plain and Southeast with traditional smallholders. Low-den-sity grazing systems occur mostly in the Northwest region of China infive main pastoral districts (Inner Mongolia, Gansu, Qinghai, Tibet, and Xing Jiang). Fertilizer use is generally
Environ. Res. Lett. 9 (2014) 054003 S Z Sattari et al
2
Figure 1.Historically produced, consumed, imported and exported phosphorus during 2002–2011 in China [21].
much lower in the western than in the eastern part of the country. In some areas, crop residues are used for animal feed or fuel, while animal manure is also used as fuel [19].
2.2. Model description
The DPPS—a simple two-pool P-model [18] including labile and stable pools and long-term P input and output data [10]— was used. The DPPS model reproduces historical crop uptake as a function of P inputs (fertilizer and manure). This model considers the essential P fluxes between crops and soil. It includes both labile and stable pools of P with a yearly time step. The model can calculate P transfer between different pools, the P uptake by crops, and the pool sizes. The model can also be applied for calculating the fertilizer requirement for a future target yield. The DPPS model successfully simulated the historical patterns of crop P uptake as a response to the application rates in all continents and the entire globe as shown in Sattari et al [10].
The model was used to calculate future P fertilizer and manure application rates in China based on target crop pro-ductions in 2050 derived the Rio + 20 Trend or baseline scenarios [10]. Details of the model, and its application to estimate future P requirements are given in Sattari et al [10] and Wolf et al [18].
2.3. P inputs and outputs
Annual P input—output budgets were calculated from 1970 to 2010 at three different scales, i.e. provincial, regional and the country. Annual crop yields, annual chemical P fertilizer consumption and areas of arable crops are available at country scale from FAO [21] for the period 1970–2010 and from Chinese statistics [22] from 1978 onwards at both national and provincial scales. Chinese statistics at provincial scales were used to disaggregate the long-term FAO national data to provincial level [23].
2.3.1. Manure. No data on manure P production and use is available from the agricultural statistics. We used data on animal stocks for dairy and non-dairy cattle, buffaloes, sheep and goats, pigs, poultry, horses, asses, mules and camels for the years 1970, 1980, 1990, 2000, 2005 and 2010 [24] and used linear interpolation between these years. Total manure production of P was calculated from total animal stocks and P excretion rates (see SI) [24,25]. Animal manure available for application to crops and grassland includes all stored or collected manure and excludes excretion in grazing land and animal manure used for other purposes (fuel, building material), or manure not used at all (such as manure from confined animal feeding operations collected in lagoons or discharged to surface water). More explanations about the manure calculations, manure use and excretion rates per animal category as well as manure not recycled in agriculture are given in the SI.
2.3.2. Weathering and atmospheric deposition. We used global values from Liu et al [26] for P supply from
weathering (1.6 Tg yr−1) and atmospheric deposition (0.4 Tg yr−1) and to calculate the average P inputs per hectare (1 and 0.25 kg ha−1yr−1 from weathering and deposition, respectively).
2.3.3. Runoff and erosion. Runoff is the overall dominant loss pathway for P from agricultural land, and P leaching is important in areas with P-saturated soils in some industrialized countries. To estimate P runoff loss, we used the increase of global P river export as presented by Seitzinger et al [27] for the period 1970–2000 (excluding the contribution of sewage), assuming that this increase can be completely attributed to agricultural activities. This increase includes sediment, particulate and dissolved P forms, and is corrected for P retention in river systems. This simple calculation yields a P loss rate to aquatic systems through surface runoff [24] of about 10% of the soil P inputs from fertilizer and manure.
In DPPS, fertilizer and manure inputs are directly allocated to the labile and stable pools. Wolf et al [18] proposed indicative values for the fractions of labile and stable pools in superphosphate fertilizer of 0.8 and 0.2, respectively. The calculated P loss by runoff is therefore actually taken from the labile and stable pools in a ratio of 4 : 1 [10] before allocation to the pools.
2.3.4. Crop uptake. Yields of 116 crops grown in China are available from 1970 to 2010 [21]. P contents for each crop were obtained from different sources [28,29] and the amount of P harvested was calculated as production times the P content.
2.4. Scenario for the period 2010–2050
We used the Rio + 20 Trend scenario for simulations of future P use in China. Similar to the baseline scenario of the Environmental Outlook of the Organization for Economic Cooperation and Development (OECD) [30], the Global Orchestration scenario of the Millennium Ecosystem Assessment [31] and the A1 scenario of IPCC-SRES [32], the Rio + 20 Trend scenario is a baseline or business-as-usual scenario with similar assumptions on population growth and economic development pathways. Baseline scenarios repre-sent a continuation of current trends, with no dramatic changes or shifts in production and management systems, attitude towards environmental problems, etc. The Rio + 20 study [33] describes four scenarios, the Trend scenario and three challenge pathways. The Trend scenario describes possible trends in the absence of five climate and sustain-ability policies. The three challenge pathways were designed to assess the potential to achieve sustainability goals.
In the Rio + 20 Trend scenario, the world population is projected to grow from 7 to 9 billion people and the popu-lation of China from 1.360 billion to 1.415 billion inhabitants during the period 2010–2050. Towards 2040, the highest economic growth rates are projected for Asia compared with other continents, which will lead to a strong increase in demand for agricultural products and consequent changes in
land use. Historically, almost 20% of the global increase in agricultural production was achieved by expanding the total agricultural area. This trend is expected to continue in the Rio + 20 Trend scenario, leading to some further expansion of agricultural areas mainly for crops. However, as a reflection of the slow-down in global population growth around 2050, global land-use expansion will become stable towards the end of the scenario period.
According to FAO [34] the total agricultural area in China will decrease towards 2030 and 2050, mostly because of urbanization. Due to the uncertainties about the future expansion or contraction of agricultural area in China, we used a constant arable land area from 2010 onwards for future estimations.
3. Results
We present the P budgets for the past and future four decades (1970–2010–2050) for the provincial (section 3.1), regional (section3.2) and national scale (section3.3).
3.1. Provincial P budget
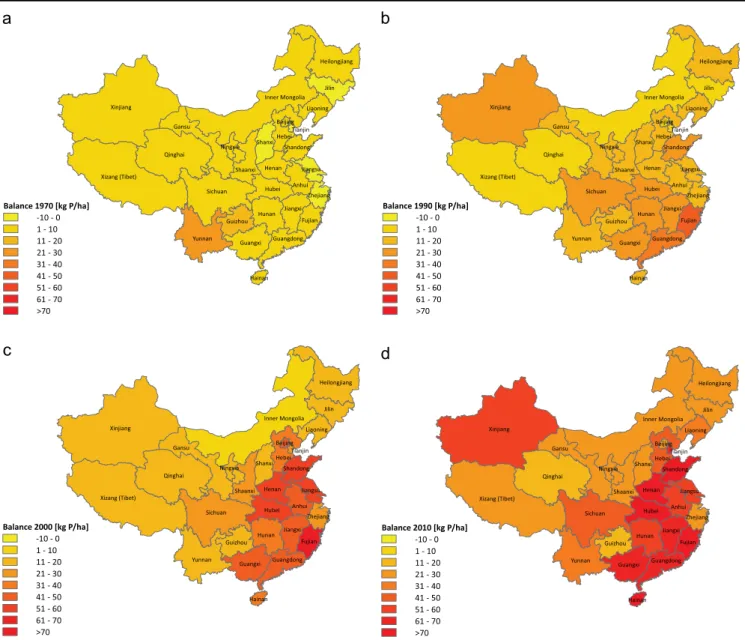
The agronomic P budget of the arable lands in 1970 showed a P deficit or a small P surplus in provinces such as Tianjin in the North, Jilin in the Northeast, Jiangsu in the Yangtze Plain, Shanxi in the Northwest and Zhejiang in South China (figure2(A)). Since 1990 increasing P application as chemical fertilizer and manure led to positive soil P budgets in all provinces (figure2(B)). In 2010 the P surpluses reached more than 70 kg P ha−1yr−1 in Sichuan, Guangdong, Shandong, Guangxi, and Hainan provinces. Hubei province in the Yangtze Plain showed the highest P surplus with 90 kg P ha−1yr−1in 2010 (figure2(D)).
3.2. Regional P budget
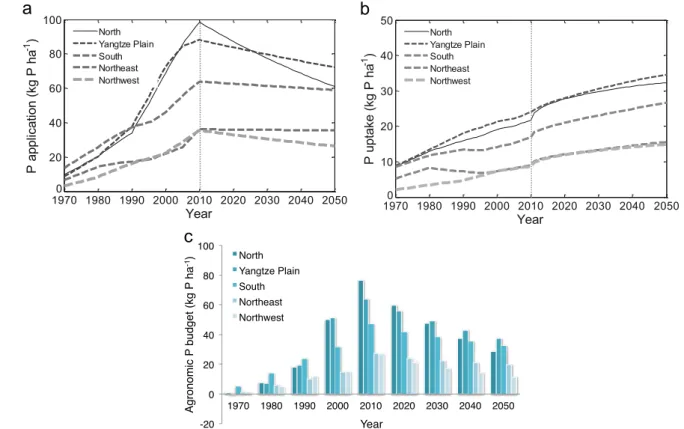
The divergence in incremental use of P fertilizer between the different regions of China is evident (figure3(A)). In 1970, P application was around 10 kg ha−1 in North, South and Yangtze Plain, 6.0 kg ha−1 in the Northeast and only 3.0 kg ha−1in Northwest. Since then, it increased almostfive-fold in South and Northeast and more than ten-fold in the Northwest, the Yangtze Plain and the North (up to 100 kg ha−1) (figure 3(A)). During the 1970–2010 period, P uptake in Northeast and Northwest regions remained less than 10 kg ha−1. In the South, North and Yangtze plain, P uptake reached 17, 21 and 24 kg ha−1, respectively, revealing that crop uptake does not respond proportionally to the higher rate of P inputs (figure3(B)).
P surpluses increased dramatically in North, South and Yangtze plain between 1970 and 2010. Between 2000 and 2010, the surplus of P in the North and Yangtze Plain regions increased from ca. 50 kg P ha−1 to ca. 76 and 64 kg P ha−1, respectively (figure3(C)).
Using the Rio + 20 Trend scenario for target P uptake for thefive Chinese regions, the P application simulated by the
DPPS model can go down as illustrated in figure 3(A). Figure 3(C) shows the agronomic P budget in the different regions from 1970 to 2050. The levels of application and uptake do not result in an equilibrium fertilization scheme, as the level of residual P is not as large as in industrialized regions such as Western Europe. Hence, the model predicts slightly positive P budgets in 2050 (figure3(C)).
The regional differences are mainly related to differences in production systems (traditional mixed smallholder versus the decoupled crop and landless, animal feeding operations), fertilizer management practices and differences in soil ferti-lity. Furthermore, the type of livestock and its distribution has a large effect on P use efficiency and P surpluses. For example pig and poultry production have higher P use ef fi-ciency than beef and sheep production [19].
3.3. National P budget
Comparison of P application and P uptake between 1970 and 2010 in China’s croplands showed that P input is much larger than crop uptake. Crop yield in China increased only about 2.5 times between 1970 and 2010, while the use of chemical P increased 7.5 times. P use efficiency in crop production (defined as the P uptake as a percentage of P application) decreased from about 88% in 1970 to only 25% in 2010 (figure4). The value for 2010 is less than the 36% for 2005 from a recent study [19, 35] because fertilizer P use still increased between 2005 and 2010.
In 2010, China’s chemical P fertilizer consumption exceeded 6.3 Tg [22], with an additional 1.8 Tg P from animal manure spreading in croplands. At the same time P in grain yield was only 2.0 Tg, out of the 8.1 Tg supplied by fertilizer and manure. Consequently, the estimated total P surplus is about 6.1 Tg, which is equivalent to the chemical P fertilizer input in 2010.
4. Discussion
China’s production of phosphate rock was 68 Tg in 2010 (corresponding with 8.7 Tg P5), which was more than twice the amount mined in 2005 (30.4 Tg) [13]. Total global pro-duction of phosphate rock was 181 Tg in 2010 (corresponding with 52.4 Tg P2O5and 23 Tg P). Hence, the P surplus from
synthetic fertilizers in China’s cropland (4.3 Tg) (see section 3.3) was about 50% [13]−60% [21] of the China’s total P production and around 20% of global P production in 2010. The total P surplus through chemical P fertilizer application in China’s cropland for the period 1970–2010 was 56 Tg—more than 3.5 times the total chemical P application in Africa’s croplands (15.3 Tg) during the same time period [10] and more than twice the total chemical P production on the globe in 2010 [13].
The total accumulated P in the labile pool in China’s cropland since 1970 is estimated to be 44 Tg P in the year
Environ. Res. Lett. 9 (2014) 054003 S Z Sattari et al
4
5 Units of phosphorus (elemental P) are calculated assuming 29% P
2O5in
2010 in China’s cropland corresponding to 345 Tg rock phosphates. This amount is almost five times the amount of Chinese phosphate rock production in 2010 and around one tenth of Chinese estimated phosphate rock reserves, which is equal to 3700 Tg in 2010 [13].
Estimates of future P fertilizer demand accounting for residual soil P [10] were made with the DPPS model; DPPS calculates P application rates (fertilizer and manure) based on target crop production in the Rio + 20 Trend scenario with the projected population of 1.415 billion people in China by 2050 [33]. This scenario turns out to be closer to the actual trends than any of the other Rio + 20 scenarios assuming a deviation from current trends. Population and income growth are pro-jected to lead to the strong demands for food and energy by 2050 [33]. According to the Rio + 20 scenario, P uptake in China needs to increase by 60% between 2010 (2.0 Tg) and 2050 (3.2 Tg) to satisfy the 2050 food demand.
In this paper we show that residual soil P plays a crucial role to sustain the indicated P uptake by 2050 in China. Crop production can benefit from the P surplus from past P ferti-lizer and manure use. Theoretically, increased P uptake can be achieved even with a reduction in P application (figure 5). The reduction trend in P application has been confirmed with the conceptual model of Li et al 2011 [11]. When soil available P (Olsen-P) is sufficient, only low rates of P ferti-lizer need to be applied to obtain good crop yields. Readily available P in the soil solution, which in DPPS is a part of labile pool, provides most of the plant-available P. The two main factors that control the availability of P to plant roots are the concentration of phosphate ions in the soil solution and the P-buffer capacity, i.e. the ability of the soil to replenish these ions when plant roots remove them [2]. A critical concentration of readily available P must be maintained to obtain good crop yields.
Figure 2.The annual agronomic phosphorus budget in different provinces of China in (a) 1970; (b) 1990; (c) 2000 and (d) 2010 (Province of Sichuan includes the municipality of Chongqing). The agronomic P budget is the difference between P inputs from chemical fertilizer and manure and P withdrawal through crop P uptake (kg P ha−1). The light yellow colour refers to P deficit and the dark red colour refers to P surpluses.
The importance of residual P has already been demon-strated through different experiments. For example a farm-scale study showed that equilibrium P fertilization between 1989 and 2006 did not lead to reduced crop yields in Dutch sandy soils [36]. Another national-level study on P fertilizer in Japan indicated that crop yields remained constant or even increased, despite a decline in use of P fertilizer and manure between 1985 and 2005 [37]. Even in high P-fixing soils a large initial application of P (around 600 kg P ha−1) can be adequate for cultivating maize for 7–9 years due to the effect of residual P [38].
To quantify the crucial impact of residual P for China at the country scale, our modelling results are compared with estimated P applications from the Rio + 20 Trend scenario
(figure 5). The cumulative P application in the original Rio + 20 studies between 2010 and 2050 is 353 Tg P [33] and the estimated P required based on the DPPS model simula-tions is only 283 Tg. The total amount of P that can be saved by accounting for residual soil P over the 2010–2050 period is thus about 20% (70 Tg) of the Rio + 20 scenario estimate. The difference between Rio + 20 and our calculations would be equivalent to more than twice the cumulative P required between 2010 and 2050 in Oceania (31.7 Tg), half of the P
Environ. Res. Lett. 9 (2014) 054003 S Z Sattari et al
6
Figure 3.Trends of P application and P uptake. (a) Trends of annual P application (chemical P and manure), (b) crop P uptake and (c) agronomic phosphorus budget in different regions of China’s croplands for the period 1970–2010 (historical data) and 2011–2050 (model).
Figure 4.Historical P application, P uptake and P use efficiency (PUE) during 1970–2010 in China.
Figure 5.Trends of annual P application and P uptake in China’s cropland for the period 1970–2050. Red triangles and green circles refer to P application and P uptake rates based on historical data, red solid and green dashed lines refer to P application and P uptake rates, simulated with the DPPS model accounting for residual P. The dotted grey line shows P application taken from the Rio + 20 Trend scenario and does not account for residual P.
required in Africa (143 Tg) or sufficient for Western Europe (56.4 Tg) or Eastern-Europe (44.7 Tg) to reach their target P uptake in 2050 [10].
The simulated trend infigure5, i.e. increasing P uptake and declining P application rates cannot continue over pro-longed periods, since soil P stocks would deplete leading to soil degradation. Ideally, P withdrawal and runoff losses need to be balanced by P inputs [10]. In contrast, in soils that have been depleted due to minimal P application rates in the past, P input has to exceed crop requirements by 30–50% during a period of 30–50 years to build up a good soil P status [39].
Excessive P application through mineral fertilizer in the arable farming system has led to the accumulation of soil P and constitutes an eutrophication risk for surface water. In contrast, Chinese grazing systems may be confronted with a severe P deficit problem due to the massive transfers of P in the form of manure, while grasslands are hardly fertilized. An efficient way to solve these two problems (P excess in cropland, P deficit in grassland) simultaneously may be through regulating and balancing the Pflows between the two systems [14].
Leaching of P may be a significant component of P losses to waterbodies from agricultural soils with low P sorption capacity and that have experienced large cumulative surpluses [40]. Based on the P budgets for the past 40 years, soils may become P saturated (at the critical value of 25% saturation) in less than ten years in poorly drained soils with high surplus of P in North, South and Yangtze plain, while the time needed to reach saturation is longer in well drained soils and where less P has been applied (see SI online material and table S1).
Many industrialized countries have had periods with excessive P fertilizer use, for example in the 1970s parts of Europe were heavily over fertilized (FAO, 2011). However, since the 1980s in much of Europe, P application rates have been decreasing, and uptake continues to increase due to the use of plant-available P from the residual soil P pool [10] as well as optimized agricultural systems. Efficient use of P in Western European countries could be considered as an example for other countries, such as China, that face the agronomic P surpluses challenge China [41]. Such a shift in nutrient management in crop production systems to stimulate the efficient use of P, will only be feasible when ‘smart cooperation’ [42] occurs between all sectors along the P value chain. We argue that further reforms are needed in govern-mental policy, ultimately leading to an integrated nutrient management policy based on three pillars: food security and farmers’ income, environmental sustainability, and resource use efficiency. Implementing integrated nutrient management in practice requires a mix of policy instruments including education, demonstration, regulations, and targeted economic incentives [43].
5. Conclusions
As a result of residual soil P built up in the past four decades in China, crop production targets can be achieved in combi-nation with a reduction of soil P surpluses through reducing P
application. This brings the concept‘Less input, more output’ [41] into practice. Such shifts have been observed in other regions such as in Europe. Reduced nutrient inputs will be agronomically, economically, and environmentally beneficial. Using our quantitative model approach we illustrate the undeniable key role of China in managing the global P crisis if policy makers adopt a proper and sustainable P application strategy. Such improvements will only be achieved when ‘smart cooperation’ occurs between all sectors along the food production–consumption chain and also different countries.
Acknowledgments
This project is funded by Wageningen Uiversity and Research Center Program KB4 and C T de Wit Graduation School for Production Ecology and Resource Conservation (PE&RC). We would like to thank Guohua Li for providing the map of China (figure S1).
References
[1] Sattari S Z, van Ittersum M K, Bouwman A F, Smit A L and Janssen B H 2014 Crop yield response to soil fertility and N, P, K inputs in different environments: testing and improving the QUEFTS model Field Crop. Res.157 35–46
[2] Syers J K, Johnston A E and Curtin D 2008 Efficiency of Soil and Fertilizer Phosphorus Use: Reconciling Changing Concepts of Soil Phosphorus Behaviour with Agronomic Information (Rome: Food and Agriculture Organization of the United Nations)
[3] Cordell D and Neset T-S 2014 Phosphorus vulnerability: a qualitative framework for assessing the vulnerability of national and regional food systems to the multi-dimensional stressors of phosphorus scarcity Glob. Environ. Change24
108–22
[4] Smil V 2000 Phosphorus in the environment: naturalflows and human interferences Annu. Rev. Energy Environ.25 25–53 [5] Koning N B J et al 2008 Long-term global availability of food: continued abundance or new scarcity? NJAS—Wageningen J. Life Sci.55 229–92
[6] Cordell D, Drangert J and White S 2009 The story of phosphorus: global food security and food for thought Glob. Environ. Change19 292–305
[7] Déry P and Anderson B 2007 Peak phosphorus Energy Bull.13 available at: www.resilience.org/stories/2007-08-13/peak-phosphorus
[8] Van Kauwenbergh S J 2010 World phosphorus rock reserves and resources Tech. Bull. IFDC-T-75
[9] Van Vuuren D P, Bouwman A F and Beusen A H W 2010 Phosphorus demand for the 1970–2100 period: a scenario analysis of resource depletion. governance, complexity and resilience Glob. Environ. Change20 428–39
[10] Sattari S Z, Bouwman A F, Giller K E and Van Ittersum M K 2012 Residual soil phosphorus as the missing piece in the global phosphorus crisis puzzle Proc. Natl Acad. Sci. USA
109 6348–53
[11] Li H et al 2011 Integrated soil and plant phosphorus management for crop and environment in China. a review Plant Soil349 157–67
[12] Zhang W et al 2008 Efficiency, economics, and environmental implications of phosphorus resource use and the fertilizer industry in China Nutr. Cycl. Agroecosyst.80 131–44
[13] USGS 2012 Phosphate Rock, Statistics and Information. Mineral Commodity Summaries (Reston, VA: USGS). Available at:http://minerals.usgs.gov/minerals/pubs/ commodity/phosphate_rock/mcs-2012-phosp.pdf
[14] Chen M, Chen J and Sun F 2008 Agricultural phosphorusflow and its environmental impacts in China Sci. Total Environ.
405 140–52
[15] Sheldrick W F, Syers J K and Lingard J 2003 Soil nutrient audits for China to estimate nutrient balances and output/ input relationships Agric. Ecosyst. Environ.94 341–54 [16] Vitousek P M et al 2009 Nutrient imbalances in agricultural
development Science324 1519–20
[17] Carpenter S R 2005 Eutrophication of aquatic ecosystems: bistability and soil phosphorus Proc. Natl Acad. Sci. USA
102 10002–5
[18] Wolf J, De Wit C T, Janssen B H and Lathwell D J 1987 Modeling long-term crop response to fertilizer phosphorus. I. the model Agron. J.79 445–51
[19] Ma L et al 2012 Nitrogen and phosphorus use efficiencies and losses in the food chain in China at regional scales in 1980 and 2005 Sci. Total Environ.434 51–61
[20] FAO 1977 China: Recycling of Organic Wastes in Agriculture (Rome: Food and Agriculture Organization of the United Nations) p 107
[21] FAO 2011 Production/Crops and Resource/Fertilizer. FAOSTAT Database Collections. Available at:http://faostat. fao.org/default.aspx
[22] NBSC 2010 National Bureau of Statistics of China. China Statistical Yearbook 2010 Available at:http://stats.gov.cn/ english/statisticaldata/yearlydata/(Beijing: China Statistics Press)
[23] Bouwman A F, Kram T and Klein Goldewijk K (ed) 2006 Integrated Modelling of Global Environmental Change. An Overview of IMAGE 2.4 Publication 500110002/2006 (Bilthoven: Netherlands Environmental Assessment Agency) p 228
[24] Bouwman A, Beusen A and Billen G 2009 Human alteration of the global nitrogen and phosphorus soil balances for the period 1970–2050 Glob. Biogeochem. Cycles23 GB0A04 [25] Bouwman L et al 2013 Exploring global changes in nitrogen
and phosphorus cycles in agriculture induced by livestock production over the 1900–2050 period Proc. Natl Acad. Sci.
110 20882–7
[26] Liu Y, Villalba G, Ayres R U and Schroder H 2008 Global phosphorusflows and environmental impacts from a consumption perspective J. Ind. Ecol.12 229–47 [27] Seitzinger S P et al 2010 Global river nutrient export: a
scenario analysis of past and future trends Glob. Biogeochem. Cycles24 GB0A08
[28] Bouwman A, Van Drecht G and Van der Hoek K 2005 Nitrogen surface balances in intensive agricultural
production systems in different world regions for the period 1970–2030 Pedosphere 15 137–55
[29] USDA 2010 Phosphorus Content. USDA National Nutrient Database for Standard Reference Available at:http://nal. usda.gov/fnic/foodcomp/search/
[30] OECD 2012 OECD Environmental Outlook to 2050. The Consequernces of Inaction (Paris: Organization for Economic Cooperation and Development) p 350 [31] Alcamo J, Van Vuuren D and Cramer W 2006 Changes in
ecosystem services and their drivers across the scenarios Ecosystems and Human Well-Being: Scenarios vol 2 ed S R Carpenter, P L Pingali, E M Bennett and M B Zurek (Washington, DC: Island Press) pp 279–354
[32] Nakicenovic N et al 2000 Special Report on Emissions Scenarios (Cambridge: Cambridge University Press) p 599 [33] van Vuuren D, Bouwman L and Lyon S 2012 Roads from
Rio+ 20: Pathways to Achieve Global Sustainability Goals by 2050: Summary and Main Findings to the Full Report (PBL, The Hague: Netherlands Environmental Assessment Agency)
[34] Alexandratos N and Bruinsma J 2012 World Agriculture Towards 2030/2050: the 2012 Revision (Rome: Food and Agriculture Organization)
[35] Ma L et al 2010 Modeling nutrientflows in the food chain of China J. Environ. Qual.39 1279–89
[36] Verloop J, Oenema J, Burgers S L G, Aarts H F M and Van Keulen H 2010 P-equilibrium fertilization in an intensive dairy farming system: effects on soil-P status, crop yield and P leaching Nutr. Cycl. Agroecosyst.87 369–82 [37] Mishima S, Endo A and Kohyama K 2010 Recent trends in phosphate balance nationally and by region in Japan Nutr. Cycl. Agroecosyst.86 69–77
[38] Kamprath E 1967 Residual effect of large applications of phosphorus on high phosphorusfixing soils Agron. J.59
25–7
[39] Steen I 1998 Phosphorus availability in the 21st century: management of a non-renewable resource Phosphorus and Potassium217 25–31
[40] Sims J, Simard R and Joern B 1998 Phosphorus loss in agricultural drainage: historical perspective and current research Environ. Qual.27 277–93
[41] Hvistendahl M 2010 China’s push to add by subtracting fertilizer Science327 801
[42] Ulrich A E, Stauffacher M, Krütli P, Schnug E and Frossard F 2013 Tackling the phosphorus challenge: time for reflection on three key limitations Environ. Dev.8 137–44
[43] Li Y et al 2013 An analysis of China’s fertilizer policies: Impacts on the industry, food security, and the environment J. Environ. Qual.42 972–81
Environ. Res. Lett. 9 (2014) 054003 S Z Sattari et al